This is a map and photo of Sharp’s Island and its sinking lighthouse in Chesapeake Bay, we’ll get back to that after the main article about Norfolk.

GreenHell Blog writes: In an above-the-fold, front-page story, the Times’ Leslie Kaufman tried to tell a sad tale about global warming-induced sea-level rise wreaking havoc in Norfolk, VA.
If the moon is going to be full the night before Hazel Peck needs her car, for example, she parks it on a parallel block, away from the river. The next morning, she walks through a neighbor’s backyard to avoid the two-to-three-foot-deep puddle that routinely accumulates on her street after high tides.
For Ms. Peck and her neighbors, it is the only way to live with the encroaching sea.
As sea levels rise, tidal flooding is increasingly disrupting life here and all along the East Coast, a development many climate scientists link to global warming.
And of course, what tale of global warming would be complete without an “expert”?
Many Norfolk residents hope their problems will serve as a warning.
“We are the front lines of climate change,” said Jim Schultz, a science and technology writer who lives on Richmond Crescent near Ms. Peck. “No one who has a house here is a skeptic.”
As sea levels rise, tidal flooding is increasingly disrupting life here and all along the East Coast, a development many climate scientists link to global warming.
The article continues, bold emphasis mine
But Norfolk is worse off. Situated just west of the mouth of Chesapeake Bay, it is bordered on three sides by water, including several rivers, like the Lafayette, that are actually long tidal streams that feed into the bay and eventually the ocean.
Like many other cities, Norfolk was built on filled-in marsh. Now that fill is settling and compacting. In addition, the city is in an area where significant natural sinking of land is occurring. The result is that Norfolk has experienced the highest relative increase in sea level on the East Coast — 14.5 inches since 1930, according to readings by the Sewells Point naval station here.
But, that is just part of the story. While Norfolk has fill subsidence issues, other areas of Chesapeake Bay have disappearing islands.
Take for example Sharp’s Island, well up into Chesapeake Bay, and now a historical footnote on Google Earth at 38.621218° -76.363095°:

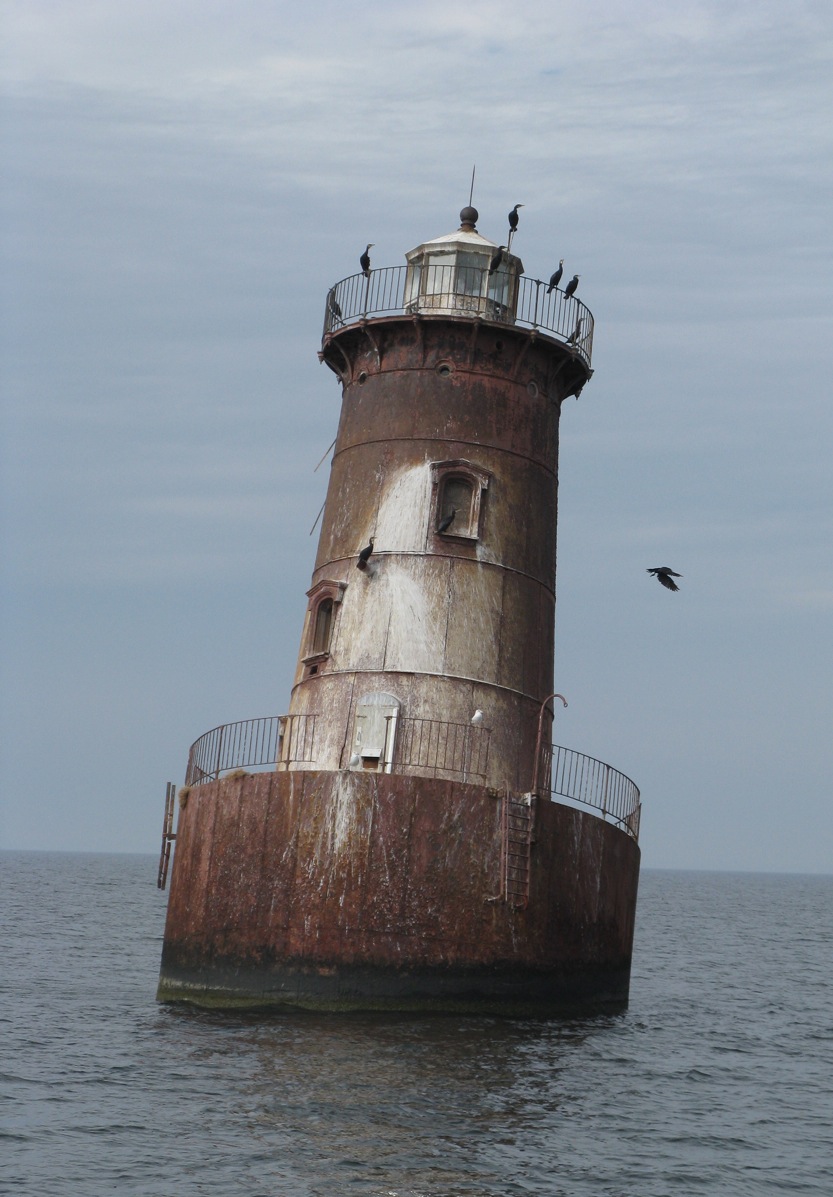
Here is the Sharps Island Light in 2009, no land is visible at all now:
It has been assumed that it is a victim of “global warming induced sea level rise” also. For example from the book: Slow Motion: The Log of a Chesapeake Bay Skipjack By M. Kei:
Sharp’s Island Light was nudged into a lean by a heavy blow in 1970 and has remained that way ever since.
…
It is one of several vanishing islands in the Chesapeake, a natural process that has been going on for millennia, but which is getting worse with global warming.
But, have a look at this before and after map of Sharp’s Island, from a NOAA/University of Maryland Newsletter in 1990:

And, note the dates of the map comparison, 1848-1942. This is well before our “hottest decade ever”.
This undated historical photograph, shows there wasn’t much left when it was taken, perhaps at high tide:

While “climate change” gets some blame in the article:
Over this last century, once inhabited Chesapeake Bay shorelines have been disappearing rapidly, transformed by rising waters into shoals and marshes. The loss of land, says Michael Kearney, a geographer at the University of Maryland College Park, has been accelerating much faster than sea level rise from global warming can account for.
He and Court Stevenson of the University’s Horn Point Environmental Laboratories believe that accelerated sea level rise is the result of massive upland and shore erosion and depletion of underground waters.
Though it has been generally accepted that water levels have risen steadily since the 1800s, Kearney and Stevenson believe the rates have increased more rapidly along the Eastern Shore since the mid-19th century. From core dating and tide gauge records which date back to the early 1800s in Baltimore, there is evidence of acceleration in rising waters,” Stevenson says. “The problem is that we could not trust existing data.”
He found a way to get more accurate data, and this is what he found, bold emphasis mine:
He found that the rate of change in land area loss during the 1600s and 1700s was fairly low, possibly because sea level rise is slow. “That overlaps the marsh record,” Kearney says, and “it is what we would expect given the several hundred year cooling between 1450 and 1850, known as the Little Ice Age.”
Between 1850 and 1900, however, he found a dramatic increase in land area lost to marsh or erosion: Sharps island near the Choptank River, for instance, lost more than 80% of its remaining area, Poplar Island 38%, James Island 50%.
Then, between 1900 and 1950, another decline in land area occurred. “it must have been eroding very quickly and unexpectedly,” Kearney says. “People were building on a lot of these islands – then all of a sudden they had to move off.”

[Oh no, “Climate refugees” ! Maybe the U.N. IPCC can scare up some reparations money to families /sarc]
“When I saw that island data,” says Stevenson, “that’s when I really got excited: we knew we were seeing accelerated sea level rise in the tide gauge record, but this shoreline data just reinforced that belief.”
Worldwide estimates of sea level rise due to climatic warming range between 1.2 and 2.4 millimeters per year. “The increases in sea level rise we are seeing in the Bay are some 3.4 millimeters a year,” Stevenson says. “There have to be other things going on – global warming alone cannot account for it.” Both he and Kearney believe those other things are land erosion and subsidence, or sinking, due to underground water withdrawal.
The sediment load Chesapeake Bay receives, the result of land clearance and development, is massive – some 2 million metric tons a year. Under this weight, Kearney and Stevenson argue, the Bay crust is sinking, literally “downwarping” the bottom and displacing upper mantle material. At the same time, they hypothesize, groundwater withdrawal from surficial aquifers has been increasing for more than a hundred years.
Of course these are hypotheses, Kearney says. “We haven’t shown that groundwater withdrawal is the problem, but it is curious,” he adds, “that the timing of initial canning operations on the Eastern Shore in the 19th century corresponds to the rapid acceleration in shore erosion of Bay islands as well as increased rates of local marsh loss.”
Just what are the relative contributions of climatic warming, sediment loading and groundwater withdrawal to accelerating sea level rise? That is an unknown, Stevenson says, though he thinks warming is only a quarter of the problem. “But there’s not a lot of data.” The poultry industry, for instance, uses a great deal of groundwater; so do the power plants. With the prospects of increasing development throughout the Eastern Shore, the demand on underground water will continue to increase.
In 1998, the USGS had this to say about the area:
Tide gauges for the Chesapeake Bay and the Mid-Atlantic coast show rates of sea-level rise twice that of the worldwide average.
And here’ s one tide gauge that shows what was going on between 1937 and 1997:

So, it sure seems like land use change, sediment load, groundwater withdrawal, and subsidence, are all factors in the area. Sea level rise is surely a contributor, but only one of many factors. Kudos to whoever the NYT editor was that added the part about subsidence in Norfolk.
It is also the centre of a 90 km wide crater from a 4 km asteroid strike just 35 Mya which means it is not a stable region. It also sinking due to post-glacial rebound – about 1.5 mms per year (it was uplifted in the ice ages because the weight of the glaciers farther north suppressed the land there, pushing a bulge up at Chesapeake which is now settling).
http://en.wikipedia.org/wiki/Chesapeake_Bay_impact_crater
http://www.ngs.noaa.gov/GRD/GPS/Projects/CB/SEALEVEL/sealevel.html
@ur momisugly HalfEmpty: Chesapeake Bay is a former river valley that was formed during the last ice age. Chesapeake Bay, Delaware Bay and the canyon off New York harbor were all formed from glacial outwash as sea levels were at least 300 ft lower during the ice age.
Had the marsh been left completely alone by humans it would generally rise with sea level rises and fall with sea level falls – just like coral island atolls.
Someone had better copyright that historical photo before Al or WWF use it to illustrate Europe in 2020.
Here comes Chris, Norfolk, VA, USA, aka savethesharks ?
It boggles the mind how unbearably stupid and one-sided these people are when they use the term “sea level rise”.
One mm / year for a while in the past 100 years, a slight decline, and now relative stability, according to the world’s preeminent sea level expert, Dr .Nils-Axel Mörner is hardly anything to be concerned about.
But of course it doesn’t stop the Maldives from holding a parliament meeting underwater, even though their sea levels are dropping….but I digress.
The “land level sink” is the concern. And Norfolk sits in a similar “forebulge region” from the last glaciation, as does The Netherlands and other areas around the North Sea.
All of this can be geo-engineered, just as the Dutch have been doing for 1000 years.
Also there have been recent decadal higher than normal tides for the Mid-Atlantic. A yet undiscovered cycle?
http://hamptonroads.com/2009/07/higher-tides-affecting-entire-east-coast-region
http://www.wired.com/wiredscience/2009/07/hightides/
Chris
Norfolk, VA, USA
Coos Bay Oregon has similar problems, when a stormtide hits, you can take your
jetski down Hwy 101….
It’s original name was “Marshfield” -better fit.
They’ll be OK, the good Lawd willin’ an’ the crik don’t rise.
🙂
Bill, above, has the solution: bring the glaciers back down to NY so Chesapeake can pop up above the waves again!
Speaking of Venice, sunspots are to blame:
http://www.upi.com/Science_News/2010/08/02/Sunspots-linked-to-Venice-flooding/UPI-98191280790936/
Neither the “scientists” nor I can figger out the connection.
The graph at
http://tidesandcurrents.noaa.gov/sltrends/residual.shtml?stnid=8577330&name=Solomons+Island&state=Maryland
is the Interannual Variation at Solomons Island (through which my wife and I passed on our sailboat a couple of weeks ago). While the Mean Sea Level Trend (link provided above by John M.) shows rising levels, this Interannual Variation is visually flat.
Can someone explain the differences between the two?
savethesharks says:
November 26, 2010 at 6:34 pm
“Also there have been recent decadal higher than normal tides for the Mid-Atlantic. A yet undiscovered cycle?”
This paper suggests one possibility.
http://www.agu.org/pubs/crossref/2007/2007GL030862.shtml
Copy the following address in to your browser, and observe the expansion of lower Manhattan since 1660.
http://www.racontours.com/archive/coastline_anim.php
Note that the West Side Highway (West Street) over half of the World Trade Center site, and the South Street Seaport were “under water” in 1660!
Dave Wendt says:
November 26, 2010 at 7:34 pm
This paper suggests one possibility.
http://www.agu.org/pubs/crossref/2007/2007GL030862.shtml
==============================
Thanks for that, Dave. Any idea how I would get the complete paper? I am not a subscriber unfortunately.
Looks like an interesting read.
Chris
Norfolk, VA, USA
How do they measure ‘sea level rise’? Is it like measuring the rising temperature using thermometers accurate to +/- 5 degrees (?). You can’t just put a stick in the water and measure the average of the waves…..unless you are a AGW’er of course. Or tack some proxy signals to make it look like a hockey stick. How is this done? Makes you wonder if the MSM gets anything right about anything. I suspect not.
I’ve never been quite sure how we can really tell sea level rise/fall – several examples of land subsidence have been given here, another that was occuring at least at some point was the coast around Houston & Galveston, Tx. Then you have situations like the Florida Everglades, where iirc, our water control with levee’s and canals starting causing significant amounts of land to be lost because of changes in sediment deposition or other changes that the canals etc., caused… and I believe, once we allowed some areas to return to a more ‘natural’ water flow, that ‘land’ being eaten up by the sea started reversing… its not like we’re talking about a bathtub with solid floor & walls and a certain water level….. its a misshapen ball with lower areas water covered, land rising and falling at various rates and for various reasons both under the oceans and above, glacial rebound or similar effects, or subsidence from below ground fluid level changes… add to that a hydrological cycle that puts various amounts of water in the air coming from both land and oceans… then we get uneven water spread too, from things like La Nina & El Nino…. land growing from ocean currents depositing soil, sediments, whatever, land growing from coral growth, land being eroded from ocean currents, coral’s dying off…. volcanic contributions including significant ones along sea rifts that are just now becoming discovered and appreciated, volcanism even creating new islands, or like the pre-krakatoa massive eruption, vaporizing significant amounts of islands/land leaving an ocean covered caldera…. sooooooo, then where are we for really telling what the ‘sea level’ is or isn’t, on a mm scale no less? Perhaps all of these things have too small an effect for the vast amount of water in the oceans, but conceptually this has always been a bit of a bother for me.
The first mention of Nix’s Mate, the smallest island in Boston Harbor, was 1636. It’s shrunk to 0.9 acres at low tide from it’s original 12 acres. It was used as quarry for ship’s ballast in the sixteen and seventeen hundreds (as well as a gallows for pirates). Like everything else in the Harbor, it’s also subject to the daily nine and a half foot tides. There’s no mention in anything I’ve read of sea level rise being the cause of it’s near disappearance.
When sediment load is mentioned in the article, it is associated with weighting down the bay area land. However, another factor would be the filling in of the bay causes some of the encroachment of the water onto the land. If the volume of water passing through the bay is the same, then the same cross-sectional area will have to be maintained. Makes sense that the water would create an apparent rise in the confines of the bay. Also, water removed from the ground is used, then “flushed” to the bay which increases volume, in turn increasing the required cross-sectional area. Once the volume of water is out of the bay the apparent rise in level dissipates. What is the level history of the ocean just off the mid Atlantic states as compared to the Chesapeake Bay?
savethesharks says:
November 26, 2010 at 8:22 pm
Dave Wendt says:
November 26, 2010 at 7:34 pm
I thought I’d saved the link to the PDF. Whoops! Can’t find the link to the full paper right now but this gives more info.
http://www.aviso.oceanobs.com/fileadmin/documents/OSTST/2007/miller_gyre.pdf
Is there a geostationary satellite that tracks its distance from the surface of the sea at various points within its line of sight? Would this accurately measure sea level from the center of the earth, or are there fluctuations in gravity or the earth’s rotational speed that would make such a measurement inaccurate?
Here’s the USGS definition of “sea-level change”: Variation in the relative vertical position of land and ocean waters. Caused globally by changes in the distribution of ice masses and the shape of the oceans, and locally by the rate of uplift or subsidence of the land surface. Includes both global (eustatic) and local (relative) sea-level variations. http://www.usgs.gov/science/science.php?term=1028
Nothing there about an absolute measurement of the mass of the water in the oceans.
And, as I’ve written previously, but have seemingly been ignored:
http://www.yorkshirepost.co.uk/news/Discovery-of-log-boat-shows.5537797.jp
http://www.severnestuary.net/sep/pdfs/severnarchaeodesignguidefinal06.pdf
http://www.rcahmw.gov.uk/HI/ENG/Heritage+of+Wales/Places/Sea+and+Coast/
http://www.archaeoleg.org.uk/pdf/roman/KEY%20SITES%20SE%20WALES%20ROMAN.pdf
This story only goes to highlight the problems of using one station for measuring a global phenomenon; you get errors and the wrong assumptions.
Globally sea levels have leveled off, due to cooling waters probably, so any rise in Chesapeake Bay has to be due to sinking. Rather like Bangladesh a country on a delta and the worlds largest alluvial fan, sinking is due to extra sediment increasing natural dewatering and consolidation.
Sea level is one of the most difficult things to accurately measure because of all the inputs that drive the changes.
I cannot find the links but there were reports in the UK about dredging of shipping channels and for building materials, causing coastal erosion and or sinking of shorelines. In the Bristol Channel the sandbank that is being dredged is many miles from where the beach is disappearing but the currents carry material at quite remarkable speeds and the erosion only started after the dredging started on an industrial scale.
Or maybe Gilligan has been moving the measuring stick out into deeper water to catch bigger lobsters…
savethesharks says:
November 26, 2010 at 8:22 pm
This is a later paper that covers much the same ground as Miller and Douglas and basically supports their results.
http://www.ocean-sci.net/6/185/2010/os-6-185-2010.pdf
In our high school geography classes in the 1950s we learnt about places such as Mexico City and Phoenix, Arizona, which sunk and continue to sink due to artesian bores pumping water out from under relatively recent urban settlement and development. There was no such concept as ‘global warming’ then and our science teachers seemed to be quite keen to discuss the LIA with us, how the earth had warmed since then and the probability that the earth would eventually cool again slightly as it entered another period of glaciation.
But that was before Post-Modern thinking made trendy academics forget the first principles of their various disciplines.
In the town where I grew up, the city council built a very nice public swimming pool and leisure complex fed by artesian bores. Unfortunately, the artesian water was eventually contaminated with increasing amounts of sand which had a nasty effect on the pumping equipment. The sand contamination continued to increase until an engineer suddenly realised what was happening under the comples. The pumps were switched off while investigations were carried out; the complex, it was discovered, was now sited above an enormous cavern. New bores were sunk, this time to pump sand into the cavern, and the water supply was switched to run off the town mains fed from a catchment area in the hills behind the town.
The vacuity of some so-called science writers, such as those who were the authors of the article, leads one to wonder if science education was missed entirely by them.