By Joe D’Aleo, CCM
On October 21st the Associated Press hit the wires with a story entitled ”Sea Ice Melting as Arctic Temperatures Rise.”
The temperatures in the arctic have indeed risen in recent years and ice has declined, bottoming out in 2007 but it is not unprecedented nor unexpected. The arctic temperatures and arctic ice extent varies in a very predictable 60-70 year cycle that relates to ocean cycles which are likely driven by solar changes.
In 2007, NASA scientists reported that after years of research, their team had assembled data showing that normal, decade-long changes in Arctic Ocean currents driven by a circulation known as the Arctic Oscillation was largely responsible for the major Arctic climate shifts observed over the past several years. These periodic reversals in the ocean currents move warmer and cooler water around to new places, greatly affecting the climate. The AO was at a record low level last winter explaining the record cold and snow in middle latitudes. A strongly negative AO pushes the coldest air well south while temperatures in the polar regions are warmer than normal under blocking high pressure. See post here.
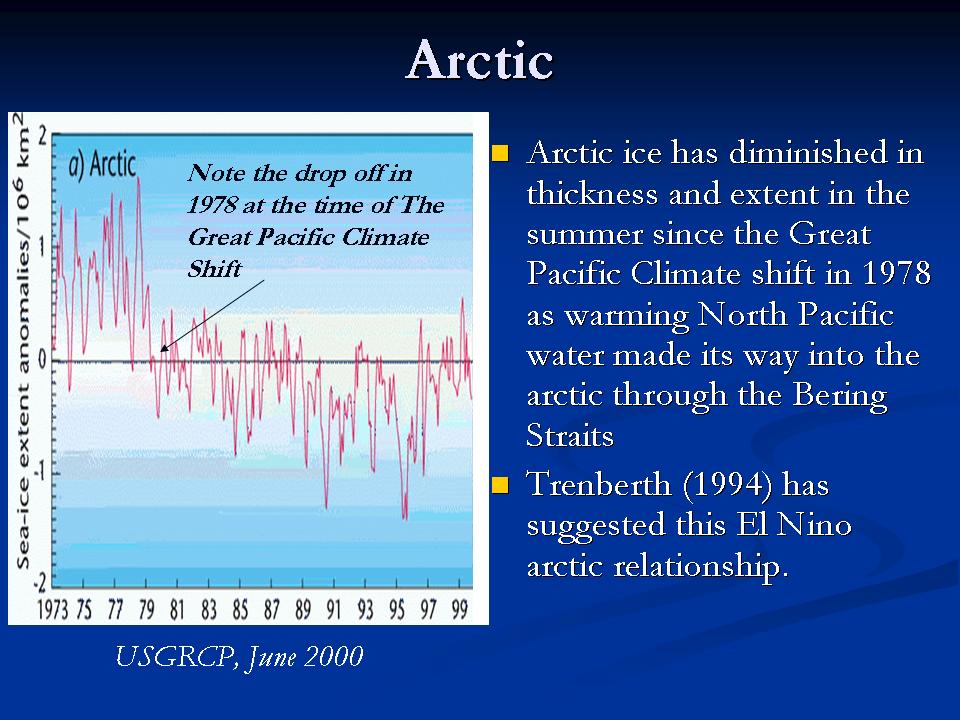
We agree. And indeed both oceans play a role. In the record-setting (since satellite monitoring began in 1979) summer melt season of 2007, NSIDC noted the importance of both oceans in the arctic ice.
“One prominent researcher, Igor Polyakov at the University of Fairbanks, Alaska, points out that pulses of unusually warm water have been entering the Arctic Ocean from the Atlantic, which several years later are seen in the ocean north of Siberia. These pulses of water are helping to heat the upper Arctic Ocean, contributing to summer ice melt and helping to reduce winter ice growth.
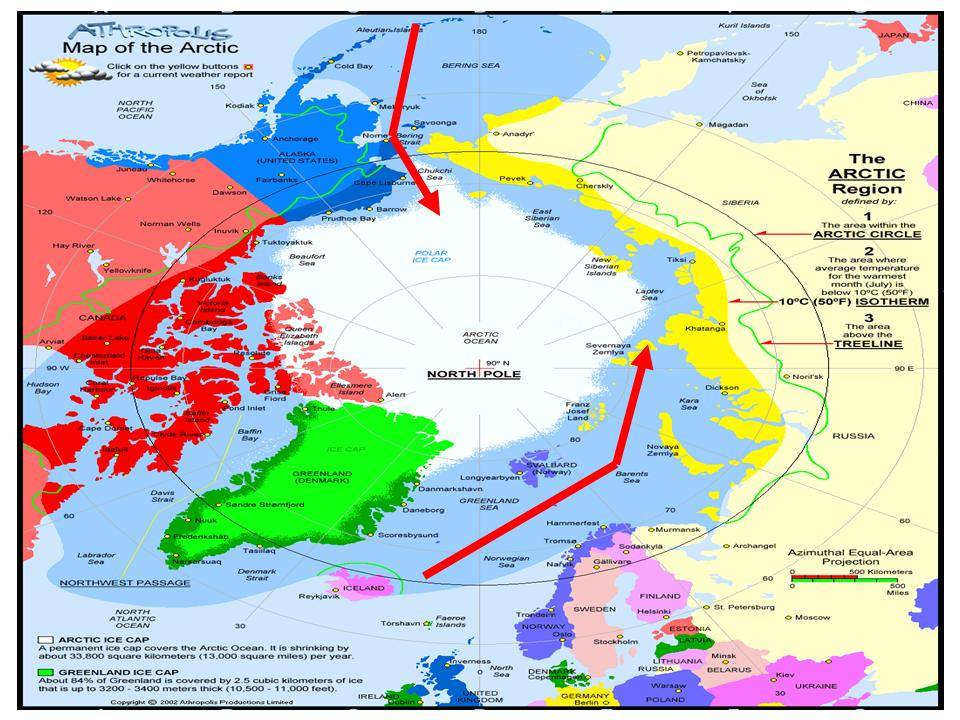
Another scientist, Koji Shimada of the Japan Agency for Marine-Earth Science and Technology, reports evidence of changes in ocean circulation in the Pacific side of the Arctic Ocean. Through a complex interaction with declining sea ice, warm water entering the Arctic Ocean through Bering Strait in summer is being shunted from the Alaskan coast into the Arctic Ocean, where it fosters further ice loss. Many questions still remain to be answered, but these changes in ocean circulation may be important keys for understanding the observed loss of Arctic sea ice.”

Enlarged here.
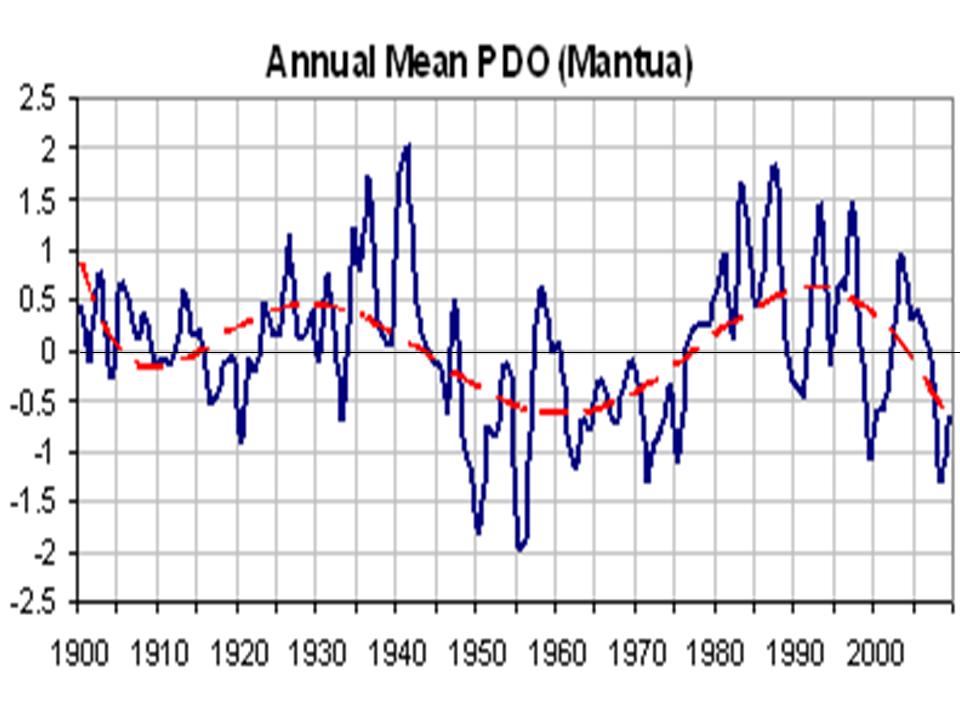
The Pacific warm mode favors more El Ninos and warmer water in the far northern Pacific including the Bering Straits. The PDO flipped into its warm mode in 1978 and the arctic temperatures began to warm and ice began to melt.

Enlarged here.

Enlarged here.
Notice how the temperatures in Alaska go through step changes tied to the PDO (Keen).

Enlarged here.
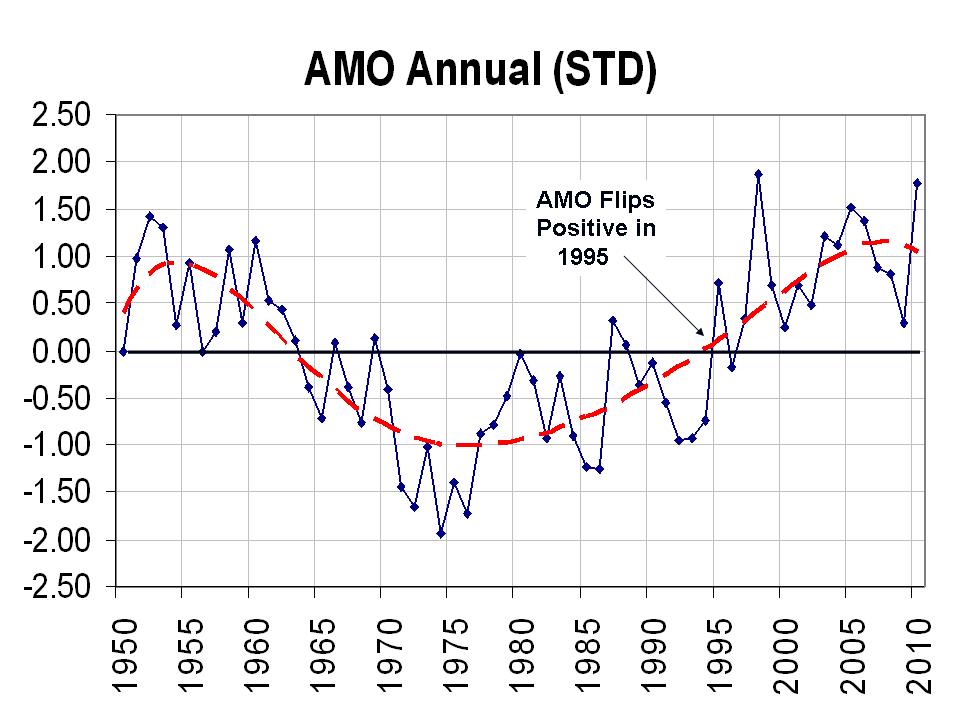
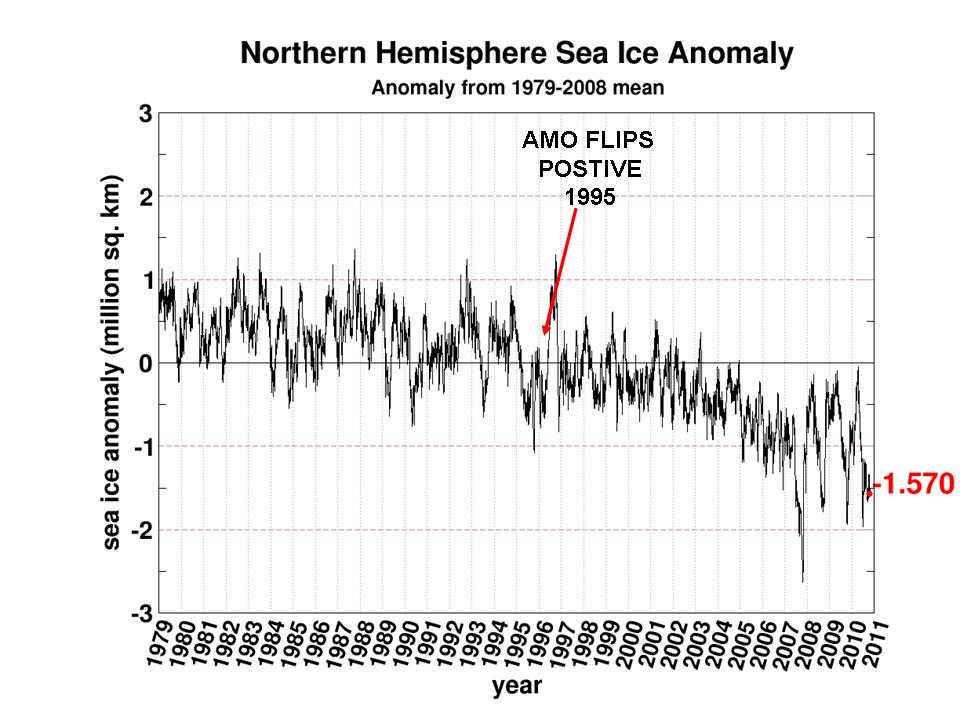
The Atlantic also cycles on a 60-70 year period. The Atlantic Multidecadal Oscillation or AMO returned to the positive warm mode in 1995.

Enlarged here.
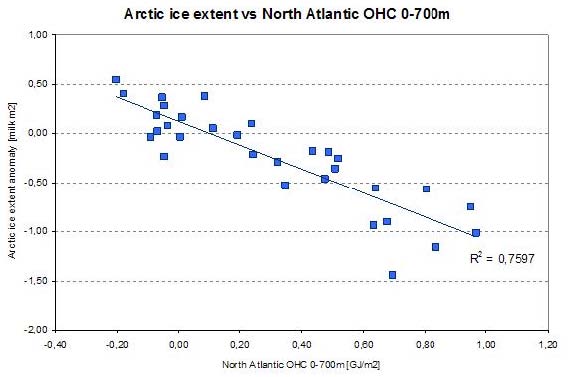
Frances et al. (GRL 2007) showed how the warming in the arctic and the melting ice was related to warm water (+3C) in the Barents Sea moving slowly into the Siberian arctic and melting the ice. She also noted the positive feedback of changed “albedo” due to open water then further enhances the warming.
The International Arctic Research Center at the University of Alaska, Fairbanks showed how arctic temperatures have cycled with intrusions of Atlantic water – cold and warm.

Enlarged here.
The correlation was also confirmed by Juraj Vanovcan.

Enlarged here.
See how quickly the arctic ice reacts to warming of the Atlantic sea surface temperatures in 1995 (source Cryosphere Today). This marked a second leg down. We have seen large swings after the big dip in 2007 following a peak in Atlantic warmth in 2004-2005.

Enlarged here.
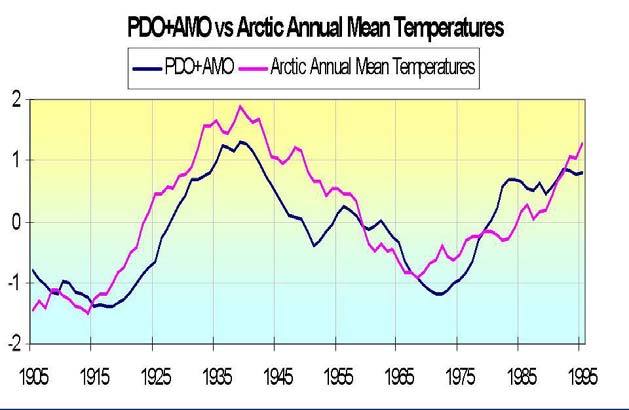
Although the PDO and AMO are measured differently, both reflect a tri-pole of ocean temperatures. Both have warm north and tropics and cool relative to normal in between in the positive phase and cold north and tropics and warm in between in the negative phase. By normalizing the two data sets and then adding the two, you get a measure of net warmth or cooling potential for both global and arctic temperatures. See how well the sum tracks with the arctic temperatures. Though we don’t have measurements of ice extent, there are many stories and anecdotal evidence that arctic ice was in a major decline from the 1920s to 1940s.

Enlarged here.
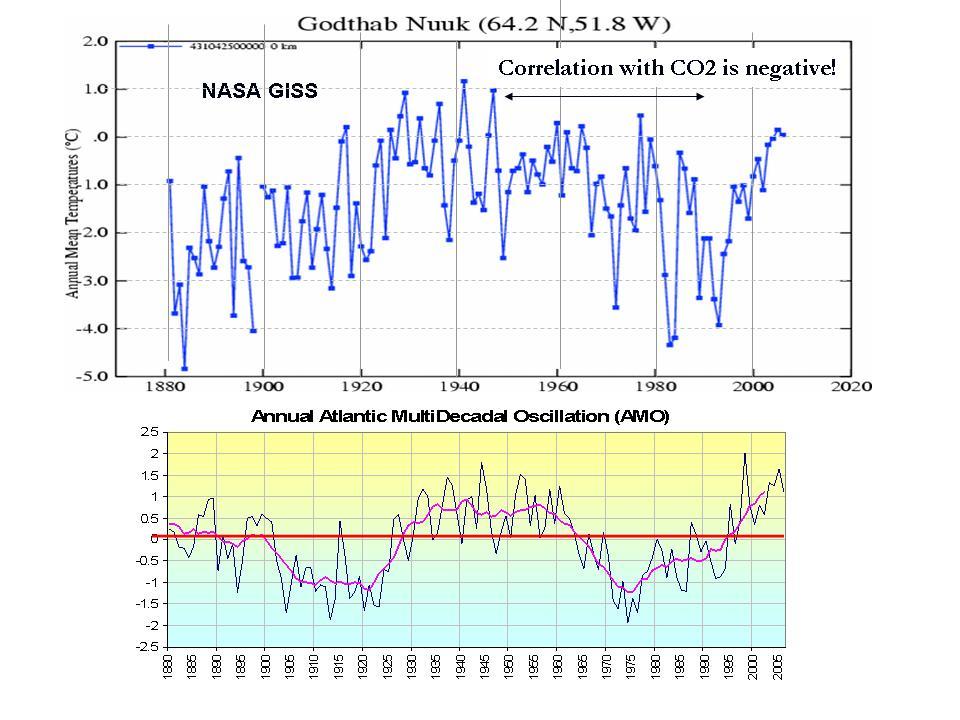
At the edge of the arctic Greenland behaves in the same way – with warming and cooling tied to the AMO.

Enlarged here.
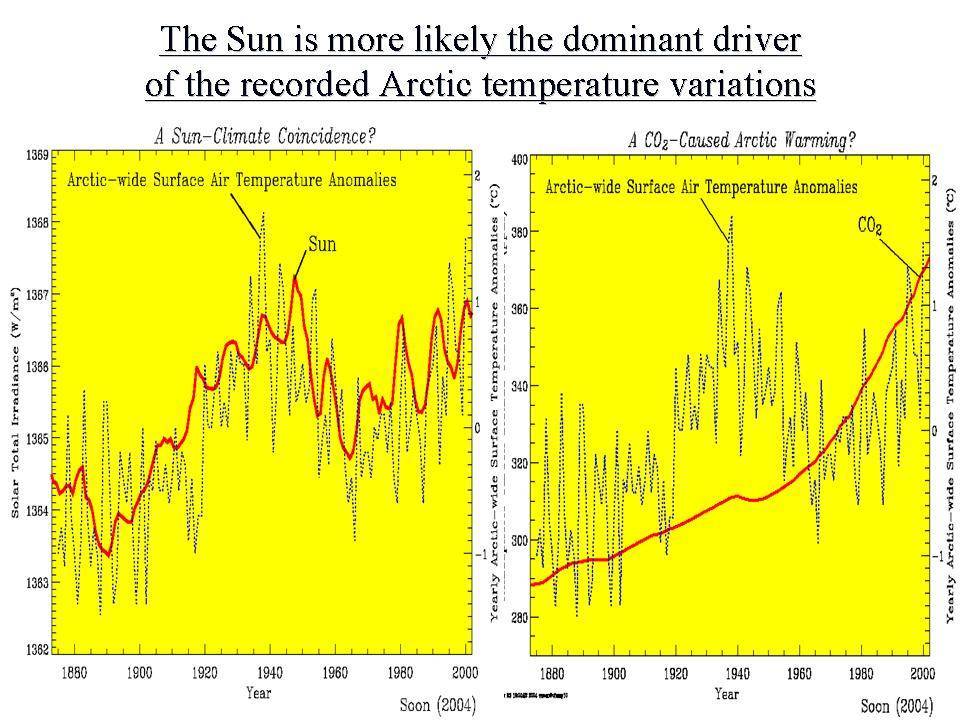
Dr. Willie Soon has shown how the arctic temperatures match the solar Total Solar Irradiance (Hoyt/Schatten/Willson) well. Correlation is poor with CO2.

Enlarged here.
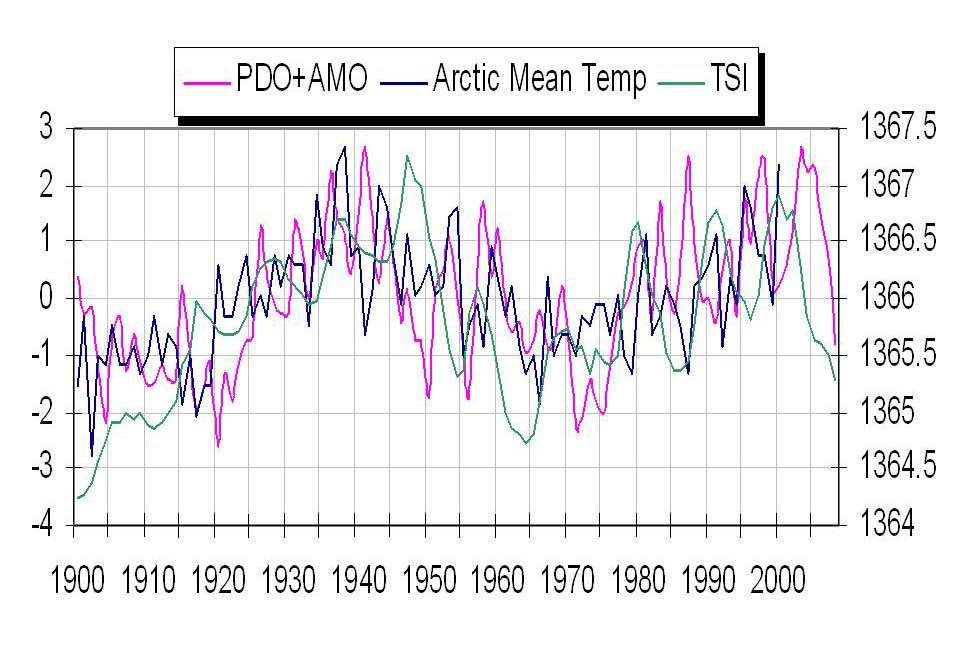
We see here how the annual TSI and annual PDO+AMO track together with arctic temperatures.

Enlarged here.
Though the current spike in the Atlantic temperatures and more high latitude blocking may cause another spike of melting in the next few winters as warm water from the AMO pop the last year works its way into the arctic, longer term you can expect arctic temperatures to decline and ice to rebound as the Pacific stays cold and the Atlantic cools and the sun stays in its 213 year Eddy minimum.
That doesn’t preclude some very cold and snowy winters short term. In 2008 glaciologist Bruce Molnia reported a bitterly cold Alaskan summer of 2008 following a La Nina winter with extreme cold and heavy snows resulted in area glaciers to expand, rather than shrink for the FIRST TIME IN RECORDED HISTORY. Summer temperatures, which were some 3 degrees below average, allowed record levels of winter snow to remain much longer, leading to the increase in glacial mass for the first time in at least 250 years.
See PDF here. See Verity Jones recent post on the arctic data here. See more on glaciers and icecaps here.
vukcevic says:
November 2, 2010 at 3:23 am
paulhan says: November 2, 2010 at 1:55 am
All I’m asking is that we quantify properly what role CO2 plays, and whether it is net positive or negative.
Paul Han you make a very important point, worth considering in more detail:
Let’s look at CO2 release and the Arctic temperature during the last 100 or so years:
http://www.vukcevic.talktalk.net/CO2-Arc.htm
Ignore the green line and concentrate on the blue (CO2) and red (Arctic temp).
1900 – 1950 CO2 rises slowly (low rate of rise) the temperature shoots up.
1950 -1980 CO2 suddenly takes off at the fastest rate ever, temperatures drop.
1980 -2000 CO2 rate slows down temperatures go up again.
Thus, CO2 is really crucial element in the Arctic temperature change, not the absolute level of CO2 but it is its rate of change that drives the temperature change, or put it in numerical terms:
d(CO2)/dt + dT/dt = const
Well that appears to be a new ‘incontinent truth’.
Hence, to prevent the rapid melting of the Arctic ice, we need to pump CO2 into atmosphere at an increased rate, i.e. doubling of CO2 emissions every 20 years, as it was case from 1950-80, when temperatures actually droped.
What do you (and R. Gates) say?
_____
At least there is still a bit of humor floating around here.
If only everything in the universe were strictly linear and that chaos and systems that constantly teeter on the edge of chaos did not exist…then the nice little one-for-one relationships with one domino toppling the next would be easy to spot. Begin to pile one grain of sand on a pile and the pile looks stable for a periods of time, even though you continue to put one grain of sand on it. Then, all of a sudden, you get a collapse of the pile…unpredictable but quite deterministic.
R. Gates says: November 2, 2010 at 6:37 am
Begin to pile one grain of sand on a pile and the pile looks stable for a periods of time, even though you continue to put one grain of sand on it. Then, all of a sudden, you get a collapse of the pile…unpredictable but quite deterministic.
A quote worth remembering, it should go on the AGW gravestone.
Agree absolutely 100%. No one but an AGW expert could describe the rise and fall of AGW theory so accurately.
I say : Sell your car buy a horse, throw away your pc get few clay tablets.
Advice to R Gates: Everybody panic!! [click in image to embiggen]
Ref – Mike says:
November 1, 2010 at 12:02 pm
“Joe is not a scientist – he is a former weather forecaster. He is no dummy, but he just knows the climatologists must be wrong. So sure is he that he can read the opposite of what they say about their research. He provides the confirmation bias many here crave.”
_________________________
I’ll take “Joe D’Aleo, CCM” any day of the week (and twice on Sunday) over the AGW Climatologist Gang of Gore that’s out to waylay and rob the public with their Sky is Falling Psyentific Crap and their UN Sponsored End Of the Century Solutions.
Mike: I think you miss the point about the Psyence Of Climatology being a BIGGER hazard to humanity than an honest Weatherman giving us his opinion and what he thinks is going on. We don’t ‘BUY’ anything around here until the Fat Lady Sings. (aka – Until the Game is Over!)
Very clearly written. I even understood all the graphs. :0)
Will Crump says: November 1, 2010 at 11:15 pm
I have no problem with using the UAH version 5.3 temperature records which indicate warming of .138 degress centigrade per decade.
And I have no problem with a 1.38 degree increase in 100 years. And the survival of humans and the vast majority of other species will be unaffected by a 1.38 degree rise in 100 years. I do have a problem attributing that increase to CO2.
Smokey says on November 2, 2010 at 7:32 am
Don’t you know that the hydrological cycle is going to accelerate! (Despite no reasonable definition of the velocity (ie, first derivative) of the hydrological cycle being offered.) It’ll probably run of the rails trying to negotiate a curve.
Then, climate change is going to accelerate, and in only a few decades we will see temperature swings of the order of 20C in parts of the world. We must all panic.
Is there a real scientist in the house?
paulhan:
Sorry about the labels. While the items in the arcticle by Joe D’Aleo are interesting, a claim that all of the observed change in arctic ice extent is due to “natural variability” with no impact from increasing CO2 levels is not supportable. Some of the claims made in the article with respect to TSI do not match current data.
I ask that you apply the same standards in testing the claims of Joe D’Aleo as you would in testing IPCC claims.
The use of the PDO in the manner claimed in the article does not appear to be supportable. See:
http://www.skepticalscience.com/The-Pacific-Decadal-Oscillation-and-global-warming.html
http://wattsupwiththat.com/2009/04/28/misunderstandings-about-the-pacific-decadal-oscillation/
http://www.skepticalscience.com/Is-Pacific-Decadal-Oscillation-the-Smoking-Gun.html
Additionally, the failure to note the impact of ENSO on PDO makes the analysis suspect.
Newman, M.; Compo, G.P.; Alexander, Michael A. (2003). “ENSO-Forced Variability of the Pacific Decadal Oscillation”. Journal of Climate 16 (23): 3853–3857. doi:10.1175/1520-0442(2003)0162.0.CO;2.
Also, the arcticle does not mention how recent observed changes in ENSO that could affect the analysis.
Zhang, Qiong; Guan, Yue; Yang, Haijun (2008). “ENSO Amplitude Change in Observation and Coupled Models”. Advances in Atmospheric Sciences 25 (3): 331–6. doi:10.1007/s00376-008-0361-5.
An anlysis of the impact of increases in the radiative forcing from CO2 on the described processes is also missing from the article, although that could be foregiven as a recent study indicates the impact is an open issue:
Collins, M., An, S.-I., Cai, W., Ganachaud, A., Guilyardi, E., Jin, F.-F., Jochum, M., Lengaigne, M., Power, S., Timmermann, A., Vecchi, G. and Wittenberg, A. 2010. The impact of global warming on the tropical Pacific Ocean and El Niño. Nature Geoscience 3: 391-397.
Concerning the statement:
“So far as I can see, CO2′s role has been a net positive.”
It is not clear if your statement only relates to the current state of CO2 warming or if it includes all future states. Are you advocating that we do everything we can to increase atmospheric CO2 concentrations?
A major negative is future sea surface rise, although it is not the only negative related to increasing CO2 levels. While the ability to quantify such matters either positively or negatively is well beyond my capabilities, there does appear to be a great deal of literature that finds that the future influence of CO2 is negative. I refer you to factors listed at http://www.skepticalscience.com/global-warming-positives-negatives-intermediate.htm and http://en.wikipedia.org/wiki/Climate_change_and_agriculture and http://www.gfdl.noaa.gov/climate-impact-of-quadrupling-co2
The view that CO2 is a net negative was endorsed by the IPCC and has been supported by an impressive list of scientific bodies of national or international standing, that have issued formal statements of opinion, that concur with the IPCC view. See:
http://en.wikipedia.org/wiki/Scientific_opinion_on_climate_change#Statements_by_dissenting_organizations
These views also appear to be supported by surveys of climate scientists since 2007, including:
Anderegg, Prall, Harold, and Schneider, 2010
William R. L. Anderegg, James W. Prall, Jacob Harold, and Stephen H. Schneider (April 9, 2010). “Expert credibility in climate change”. Proceedings of the National Academy of Sciences of the United States of America. http://www.pnas.org/content/early/2010/06/04/1003187107.full.pdf+html
Doran and Kendall Zimmerman, 2009
Doran, Peter T.; Maggie Kendall Zimmerman (January 20, 2009). “Examining the Scientific Consensus on Climate Change”. EOS 90 (3): 22–23. doi:10.1029/2009EO030002. http://tigger.uic.edu/~pdoran/012009_Doran_final.pdf.
Bray and von Storch, 2008
Bray, Dennis; von Storch, Hans (2009). “A Survey of the Perspectives of Climate Scientists Concerning Climate Science and Climate Change”. http://coast.gkss.de/staff/storch/pdf/CliSci2008.pdf.
Statistical Assessment Survice (STATS) , 2007
Lavelle, Marianne (2008-04-23). “Survey Tracks Scientists’ Growing Climate Concern”. U.S. News & World Report. http://www.usnews.com/articles/news/national/2008/04/23/survey-tracks-scientists-growing-climate-concern.html.
Lichter, S. Robert (2008-04-24). “Climate Scientists Agree on Warming, Disagree on Dangers, and Don’t Trust the Media’s Coverage of Climate Change”. Statistical Assessment Service, George Mason University. http://stats.org/stories/2008/global_warming_survey_apr23_08.html.
While there are dissenters to the view that action is needed, such as
http://en.wikipedia.org/wiki/List_of_scientists_opposing_the_mainstream_scientific_assessment_of_global_warming
there is a sufficient body of scientists and peer reviewed studies that indicate we have a problem. While not a definitive answer to this issue, I note that Bjørn Lomborg has changed his view on the need for action, (although I suspect he may be doing this out of economic self-interest and I have not examined the proposal that he has endorsed, but I doubt it would destroy the western economy given the source of the endorsement.)
Doing nothing is not the answer. Doing something which results in the ” demolishing the economies of the western world” is also not the answer. (Please cite a reference to the particular item you are referring to that will demolish the economy.) There are less extreme measures that could be taken to mitigate or diminish negative aspects of human influences on climate and the environment. It is not practical to eliminate all negative aspects of human influences. The selection of mitigation measures will involve a balancing of benefits derived and costs avoided with the costs incurred to carry out the mitigation.
Richard Sharpe says:
November 2, 2010 at 8:03 am
Smokey says on November 2, 2010 at 7:32 am
Advice to R Gates: Everybody panic!! [click in image to embiggen]
Don’t you know that the hydrological cycle is going to accelerate! (Despite no reasonable definition of the velocity (ie, first derivative) of the hydrological cycle being offered.) It’ll probably run of the rails trying to negotiate a curve.
Then, climate change is going to accelerate, and in only a few decades we will see temperature swings of the order of 20C in parts of the world. We must all panic.
Is there a real scientist in the house?
_____
The hydrological cycle always accelerates with increasing CO2. It has for millions of years and seems to be the way the earth naturally balances excess CO2 in the atmosphere. During the periods of higher CO2 and an accelerated hydrological cycle, more rock is weathered, which takes more CO2 out of the atmosphere, placing it into the oceans. The atmosphere CO2 levels then fall, the global temps cool, the hydrological cycle slows, and the whole things starts again.
The only issue is, this natural CO2 balancing act happens over hudreds of thousands and even millions of years (which is still a blink of an eye in geological terms). Rarely in the record to we see a 40% increase in CO2 in just a few hundred years (virtually instantly). The main question of course is: How will the earth respond to this human created virtual CO2 volcano?
“The arctic temperatures and arctic ice extent varies in a very predictable 60-70 year cycle that relates to ocean cycles which are likely driven by solar changes.”, which he has stated before too, and never any supporting information. I can’t see it in the various graphs here:
http://www.socc.ca/cms/en/socc/seaIce/pastSeaIce.aspx
“The hydrological cycle always accelerates with increasing CO2”
Of course it does as with any forcing limited to the air which tries to take the surface air temperature above the sea surface temperature.
It is that very acceleration that removes the temperature effect of any forcing limited to the air such as that from extra downward IR from more CO2 by locking it up as latent heat of evaporation until it is transported away upward where it is released as the latent heat of condensation and accelerated out to space by outward radiation from a higher level.
The sign of an acceleration of the hydrological cycle is a latitudinal shift in the air circulation systems. The shift required to deal with CO2 effects is so small as against natural solar and oceanic variations that it is miniscule and unmeasurable.
Will Crump,
Well laid out response.
I don’t personally contend that human produced CO2 has no effect, but the concentration on this one item in disregard of other causes, including other possible human factors is one of the reasons I’m skeptical. And like others, the only reason I can see to focus on this one item is to concentrate power and control. This one issue forces the EPA to list CO2 as a pollutant (don’t even start on acidification of oceans), exclusion of all energy sources except solar, hydro and wind and to start a global taxation system called cap and trade.
I believe that climatology is too young as a science to be making the leaps of faith on limited data that are in current use.
wayne:
So you believe the GISS temperatures are suspect. Are the UAH version 5.3 temperatures suspect?
What is the source of the temperature data base that was used in the original Dr. Soon paper on TSI?
Have you reviewed the criticism leveled at the Soon and Robinson paper on TSI “Environmental Effects of Increased Atmospheric Carbon Dioxide,” by Arthur B. Robinson, Noah E. Robinson, and Willie Soon, which was published in the Journal of American Physicians and Surgeons (strange place to put a peer reviewed study on climate) in 2007 ?
http://rabett.blogspot.com/2009/10/critical-review-of-robinson-robinson.html
What temperature data base is Dr. Soon using currently and is it a global base? Do you have any criticism for this temperature data base?
Do changes in TSI match changes in the UAH version 5.3 temperature data since 2000?
While it is possible to make graphs that appear to match if you carefully choose the overlapping scales for TSI and global temperature, does the study show that the actual change in radiative forcing from TSI corresponded to the observed change in temperature (this is an amount question, not a direction question)?
Doesn’t the model for TSI induced warming predict warming of all layers of the atmosphere and more warming during the day?
This does not match the observed cooling of the upper atmosphere and greater warming at night.
http://www.skepticalscience.com/solar-activity-sunspots-global-warming-advanced.htm
Do the TSI and global temperature studies have adjustments for clouds?
“The most obvious way for warming to be caused naturally is for small, natural fluctuations in the circulation patterns of the atmosphere and ocean to result in a 1% or 2% decrease in global cloud cover”
http://wattsupwiththat.com/2010/04/23/new-book-from-dr-roy-spencer/
Please see the many studies cited at the link below which support the following:
“In the last 35 years of global warming, the sun has shown a slight cooling trend. Sun and climate have been going in opposite directions. ”
“This conclusion is confirmed by many studies finding that while the sun contributed to warming in the early 20th Century, it has had little contribution (most likely negative) in the last few decades.”
http://www.skepticalscience.com/solar-activity-sunspots-global-warming-intermediate.htm
I do not contend that CO2 can “explain it all” for all periods and all temperature changes (which it can not). My position is that CO2 forcing is one of many components, including TSI, clouds, aerosols, ocean currents and others, that affect global temperatures. The relationships of the different factors are complex, but that does not mean CO2 is a nonfactor.
If you can provide an analysis that uses all the factors that can affect global temperature in a with and without fashion, for changes in CO2 radiative forcing from increases in CO2, that shows no impact for CO2, then perhaps we need to go back to the physicists who claim the CO2 is a greenhouse gas and find out why they are wrong.
Studies which attempt to show that TSI or clouds or CO2 alone are the only drivers of global temperature will fail given a long enough observation period as climate is more complex than any one factor.
R. Gates says:
“Rarely in the record to we see a 40% increase in CO2 in just a few hundred years…”
Key word: “Rarely.”
And the planet is still doing just fine. Some of the people on it have gone off the deep end, though.
http://icecap.us/images/uploads/ARCTIC11.jpg
Can someone describe the processing performed on TSI?
Upon a quick glance, it looks like some kind of smoothing and a rather substantial negative lag. A link to the data will suffice if folks don’t have time to explain. Thank you.
rtgr says:
November 2, 2010 at 2:09 am
warming in the arctic early 1920`s is marked in this article
http://www.climate4you.com/Text/1922%20SvalbardWarming%20MONTHLY%20WEATHER%20REVIEW%20.pdf
Warming in part of the arctic, at the same time the Chukchi Sea neighborhood was freezing solid!