By Joe D’Aleo, CCM
On October 21st the Associated Press hit the wires with a story entitled ”Sea Ice Melting as Arctic Temperatures Rise.”
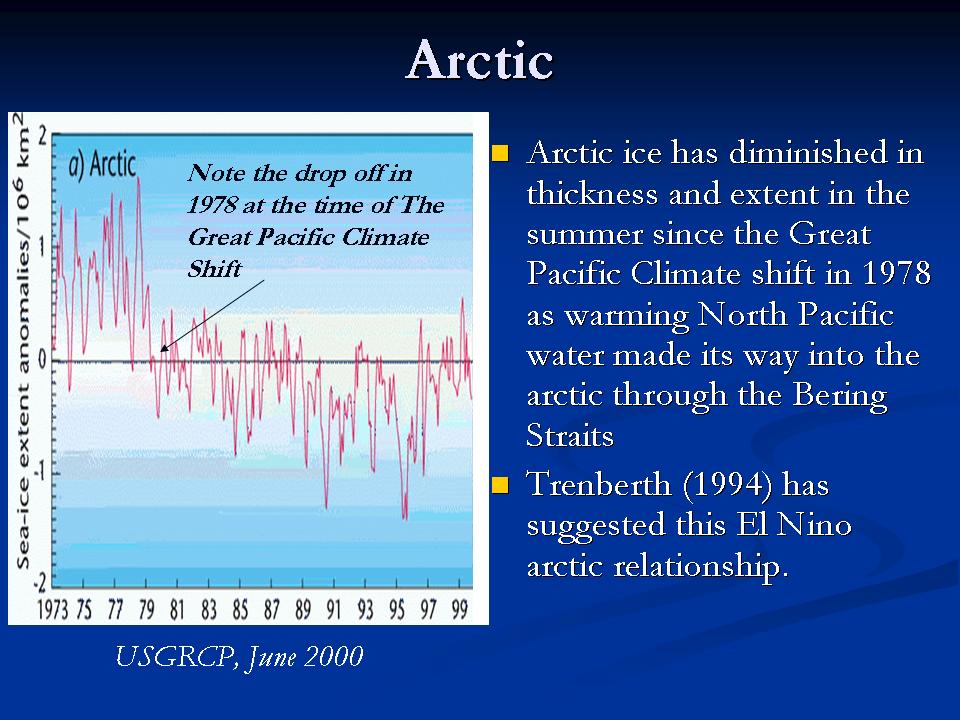
The temperatures in the arctic have indeed risen in recent years and ice has declined, bottoming out in 2007 but it is not unprecedented nor unexpected. The arctic temperatures and arctic ice extent varies in a very predictable 60-70 year cycle that relates to ocean cycles which are likely driven by solar changes.
In 2007, NASA scientists reported that after years of research, their team had assembled data showing that normal, decade-long changes in Arctic Ocean currents driven by a circulation known as the Arctic Oscillation was largely responsible for the major Arctic climate shifts observed over the past several years. These periodic reversals in the ocean currents move warmer and cooler water around to new places, greatly affecting the climate. The AO was at a record low level last winter explaining the record cold and snow in middle latitudes. A strongly negative AO pushes the coldest air well south while temperatures in the polar regions are warmer than normal under blocking high pressure. See post here.
We agree. And indeed both oceans play a role. In the record-setting (since satellite monitoring began in 1979) summer melt season of 2007, NSIDC noted the importance of both oceans in the arctic ice.
“One prominent researcher, Igor Polyakov at the University of Fairbanks, Alaska, points out that pulses of unusually warm water have been entering the Arctic Ocean from the Atlantic, which several years later are seen in the ocean north of Siberia. These pulses of water are helping to heat the upper Arctic Ocean, contributing to summer ice melt and helping to reduce winter ice growth.
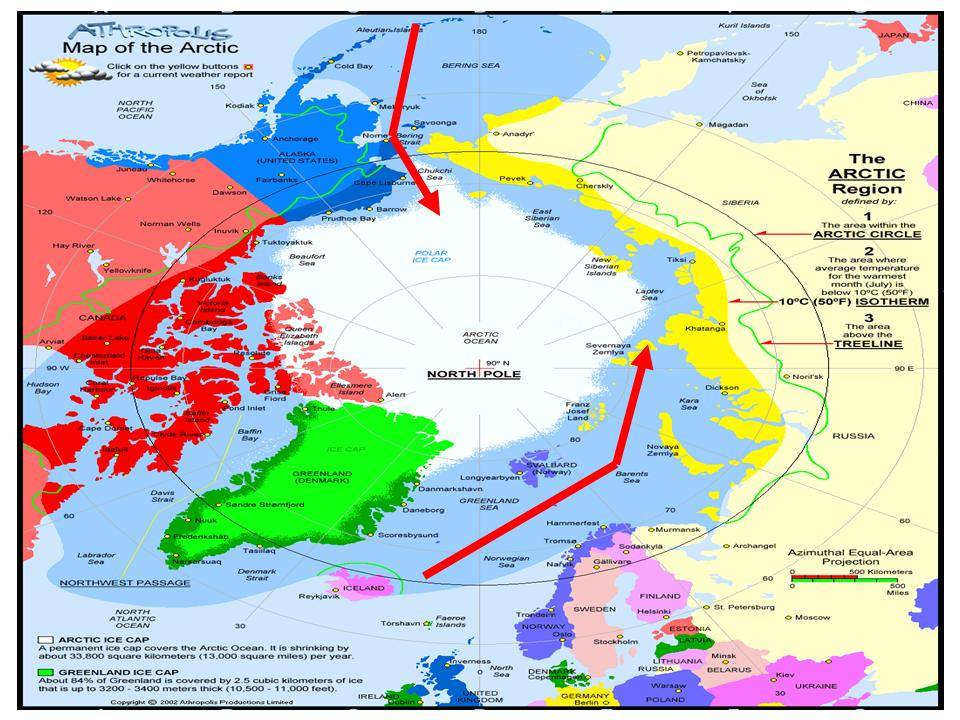
Another scientist, Koji Shimada of the Japan Agency for Marine-Earth Science and Technology, reports evidence of changes in ocean circulation in the Pacific side of the Arctic Ocean. Through a complex interaction with declining sea ice, warm water entering the Arctic Ocean through Bering Strait in summer is being shunted from the Alaskan coast into the Arctic Ocean, where it fosters further ice loss. Many questions still remain to be answered, but these changes in ocean circulation may be important keys for understanding the observed loss of Arctic sea ice.”

Enlarged here.
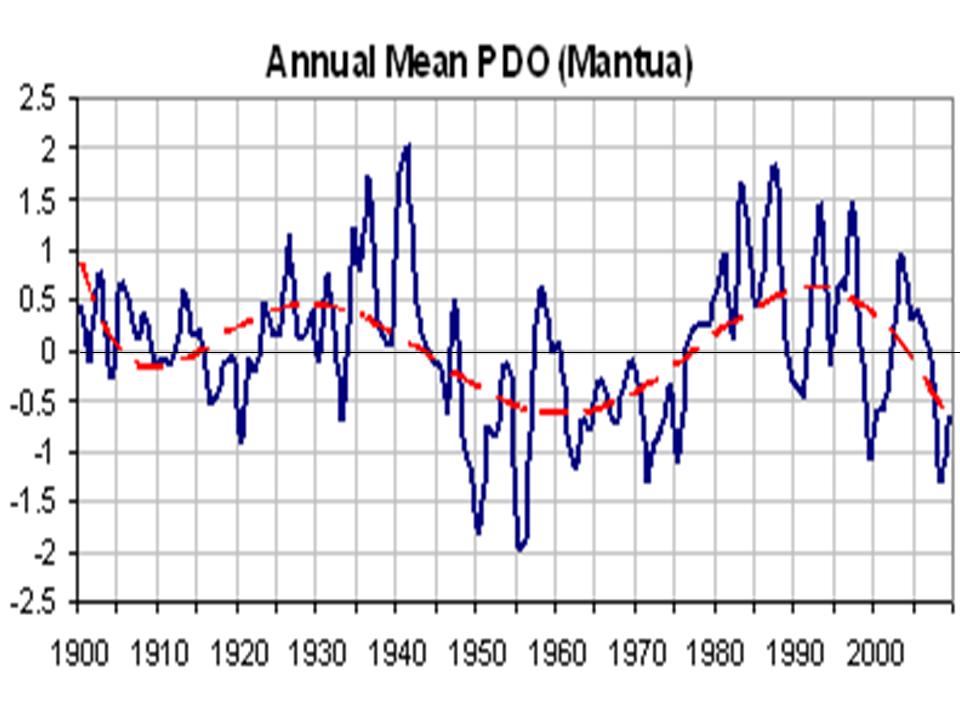
The Pacific warm mode favors more El Ninos and warmer water in the far northern Pacific including the Bering Straits. The PDO flipped into its warm mode in 1978 and the arctic temperatures began to warm and ice began to melt.

Enlarged here.

Enlarged here.
Notice how the temperatures in Alaska go through step changes tied to the PDO (Keen).

Enlarged here.
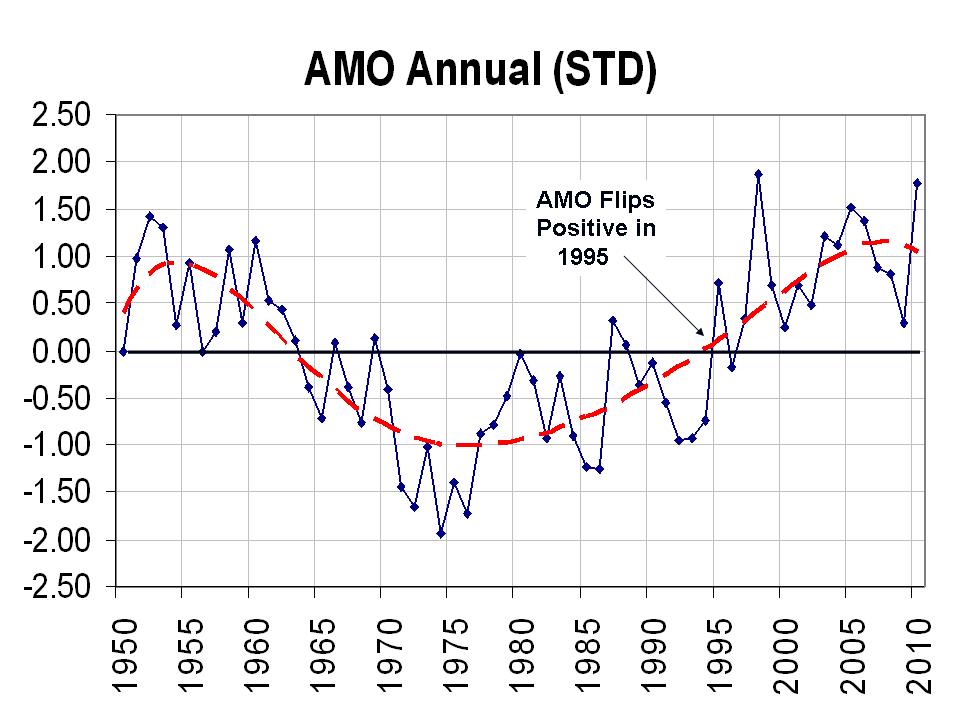
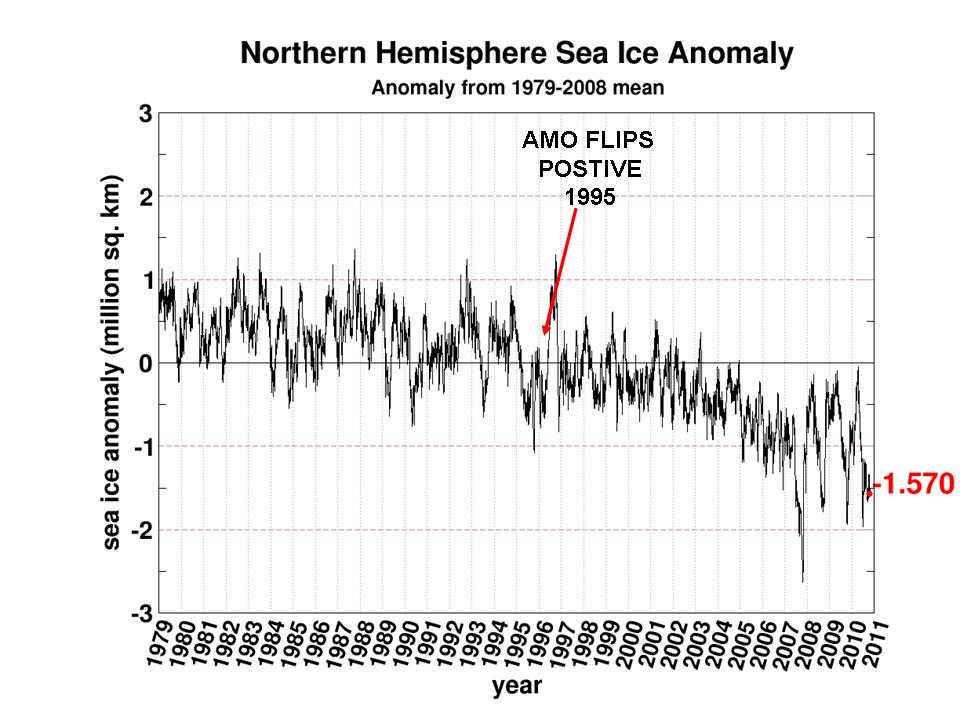
The Atlantic also cycles on a 60-70 year period. The Atlantic Multidecadal Oscillation or AMO returned to the positive warm mode in 1995.

Enlarged here.
Frances et al. (GRL 2007) showed how the warming in the arctic and the melting ice was related to warm water (+3C) in the Barents Sea moving slowly into the Siberian arctic and melting the ice. She also noted the positive feedback of changed “albedo” due to open water then further enhances the warming.
The International Arctic Research Center at the University of Alaska, Fairbanks showed how arctic temperatures have cycled with intrusions of Atlantic water – cold and warm.

Enlarged here.
The correlation was also confirmed by Juraj Vanovcan.

Enlarged here.
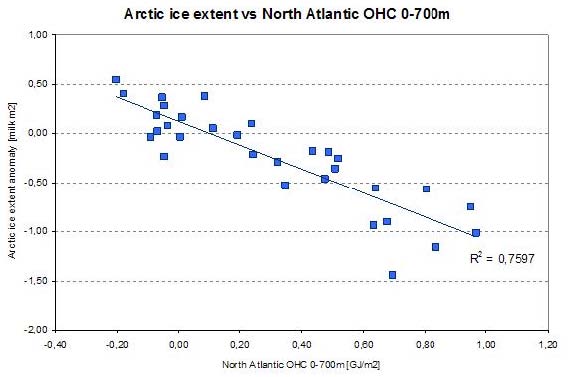
See how quickly the arctic ice reacts to warming of the Atlantic sea surface temperatures in 1995 (source Cryosphere Today). This marked a second leg down. We have seen large swings after the big dip in 2007 following a peak in Atlantic warmth in 2004-2005.

Enlarged here.
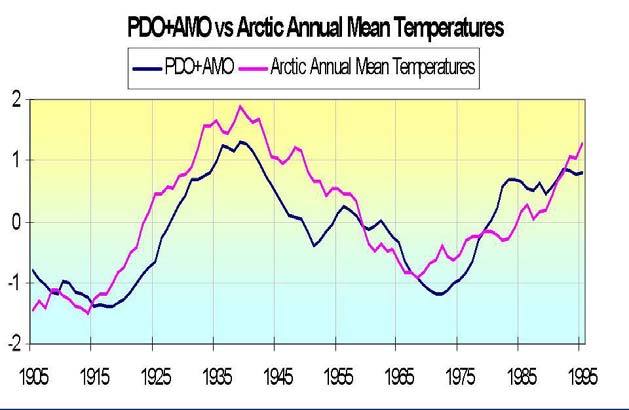
Although the PDO and AMO are measured differently, both reflect a tri-pole of ocean temperatures. Both have warm north and tropics and cool relative to normal in between in the positive phase and cold north and tropics and warm in between in the negative phase. By normalizing the two data sets and then adding the two, you get a measure of net warmth or cooling potential for both global and arctic temperatures. See how well the sum tracks with the arctic temperatures. Though we don’t have measurements of ice extent, there are many stories and anecdotal evidence that arctic ice was in a major decline from the 1920s to 1940s.

Enlarged here.
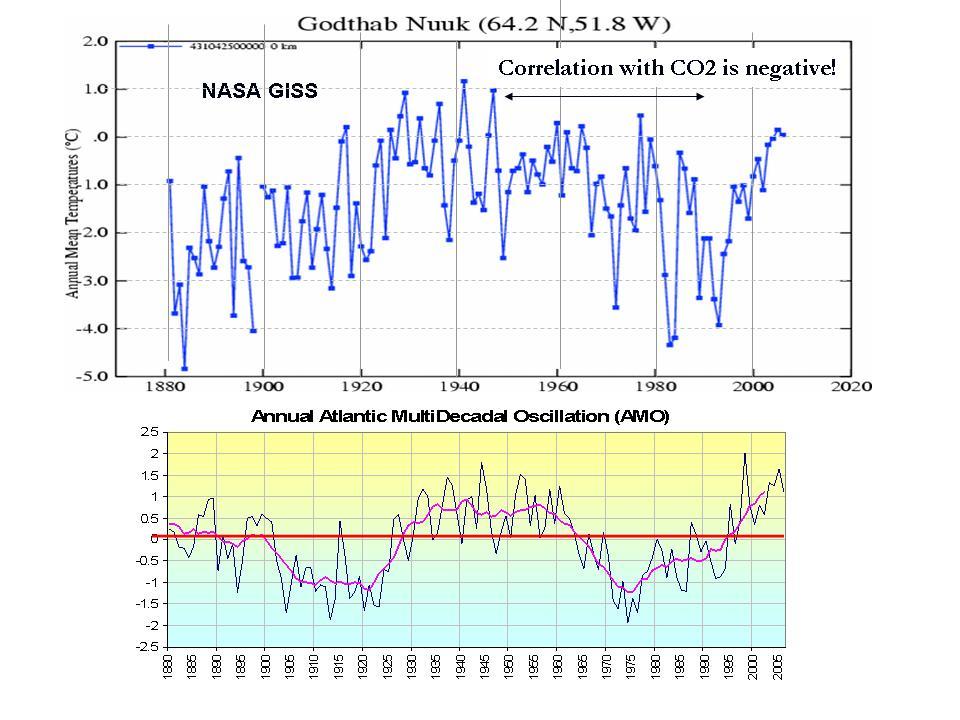
At the edge of the arctic Greenland behaves in the same way – with warming and cooling tied to the AMO.

Enlarged here.
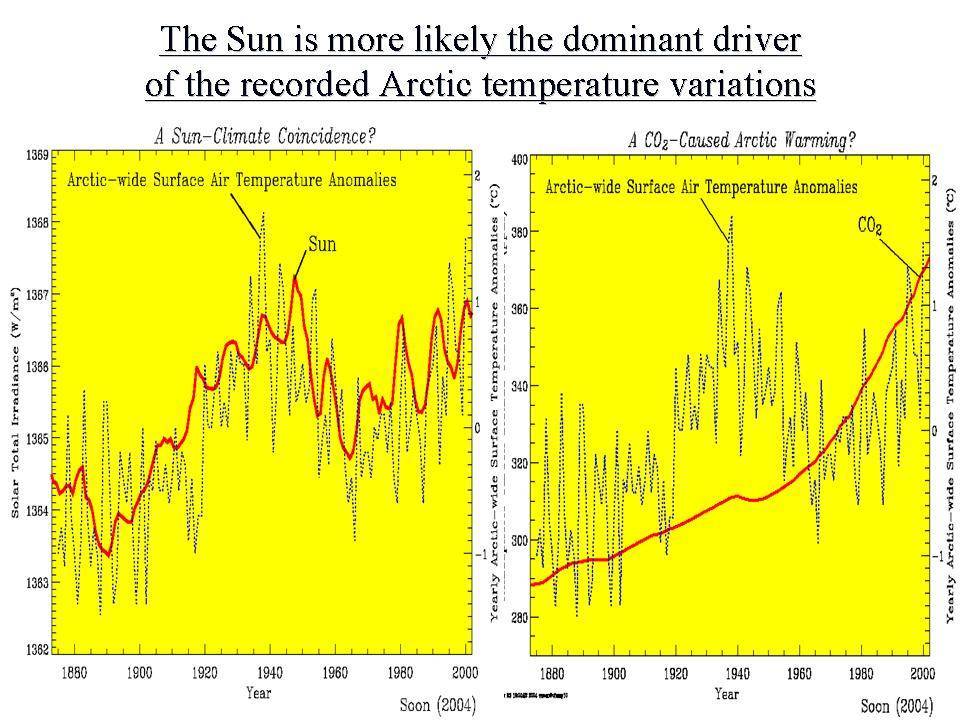
Dr. Willie Soon has shown how the arctic temperatures match the solar Total Solar Irradiance (Hoyt/Schatten/Willson) well. Correlation is poor with CO2.

Enlarged here.
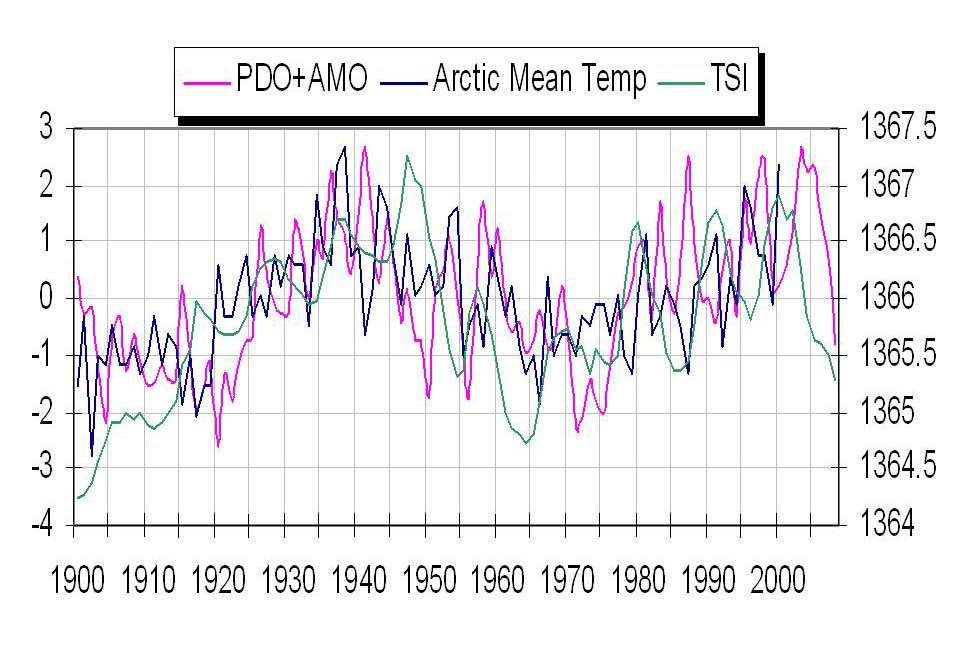
We see here how the annual TSI and annual PDO+AMO track together with arctic temperatures.

Enlarged here.
Though the current spike in the Atlantic temperatures and more high latitude blocking may cause another spike of melting in the next few winters as warm water from the AMO pop the last year works its way into the arctic, longer term you can expect arctic temperatures to decline and ice to rebound as the Pacific stays cold and the Atlantic cools and the sun stays in its 213 year Eddy minimum.
That doesn’t preclude some very cold and snowy winters short term. In 2008 glaciologist Bruce Molnia reported a bitterly cold Alaskan summer of 2008 following a La Nina winter with extreme cold and heavy snows resulted in area glaciers to expand, rather than shrink for the FIRST TIME IN RECORDED HISTORY. Summer temperatures, which were some 3 degrees below average, allowed record levels of winter snow to remain much longer, leading to the increase in glacial mass for the first time in at least 250 years.
See PDF here. See Verity Jones recent post on the arctic data here. See more on glaciers and icecaps here.
Stephen Wilde wrote: “To rebut what I say it needs to be shown that the jets can move equatorward when the stratosphere is cooling and the temperature differential between surface and stratosphere increasing.”
Actually, it’s your burden to prove you’re right, not ours to prove you’re wrong. You always seem to miss that point.
Will Crump says:
November 1, 2010 at 1:02 pm
The claim of correlation of TSI and arctic temperatures and global temperatures is suspect.
Actually Will the global temperatures, especially GISS are suspect. We have clearly invalid UHI adjustments that adjust rural historic records to look like urban records, homogenization of missing temperatures from 1500 km away, the march of the thermometers to lower latitudes and altitudes, and major siting and equipment change issues that impart positive biases. If the global average temperature is estimated only from raw data, and from stations with long records, most of the 1975 to 2000 warming disappears, and we have a cooling trend for more than 10 years now. For the USA raw rural data shows warming of .16 degrees C /century, vs raw urban warming of .79 degrees C per century. An area weighted average of the two gives USA warming of less than 0.2 degrees C per century, and virtually all of the rural/urban divergence is since 1965. See http://scienceandpublicpolicy.org/images/stories/papers/originals/Rate_of_Temp_Change_Raw_and_Adjusted_NCDC_Data.pdf
Will Crump says:
November 1, 2010 at 1:02 pm
“The claim of correlation of TSI and arctic temperatures and global temperatures is suspect.”
Just look at the difference in temperature from one winter to another, tiny changes in TSI are not responsible for that. Monthly/weekly changes in the solar wind velocity correlate extremely well to shorter term surface temperature deviations. A quick eyeball at the lack of coronal holes, and low solar wind speeds last winter, precisely during the coldest weeks, talks volumes; http://www.solen.info/solar/coronal_holes.html
Conversely, look for example, how high the velocity was in July/August 2003.
User defined plots can be found here; http://omniweb.gsfc.nasa.gov/form/dx1.html
The red arrows on the Arctic map could be misleading. Inflow from the Pacific through Bering strait is about 1Sv, while the inflow from the Atlantic is much larger at around 9Sv (1 Sverdrup = 10^6 cubic meters /sec).
Arctic temperature is closely correlated to average of the polar magnetic field in the Beaufort gyre area:
http://www.vukcevic.talktalk.net/NFC1.htm
This may be just a coincidence but unlikely, the AMO also follows closely, while PDO is in different phase. Atlantic and the Arctic are in close symbiosis, while Arctic and Pacific are barely on ‘speaking terms’ as far as the ocean currents are concerned.
R. Gates says: November 1, 2010 at 11:25 am
1) GCM’s take these cyclical influences into account AND the 40% increase in CO2 since the 1700′s and can factor out these other influences.
You know it and many other CO2ites know it, that is a pure codswalap, and this shows why:
http://www.vukcevic.talktalk.net/CO2-Arc.htm
Man put your money where your mouth is: sell your car buy a horse, throw away your pc get few clay tablets.
@R.Gates
Which GCM’s factor in the PDO/AMO cycles? Not any of the ones that went into the last IPCC report. Because if they did factor those ocean cycles into their analysis, there is no way they could have come out with a 3C per doubling climate sensitivity for CO2.
This I know the answer. Nothing.
It will not solve the search for solutions enthalpy.
The solution of the problem is entropic.
For example, the same amount of water vapor. I can have infinite (or finite) clouds.
abraços
Murray, I so agree with your comment. It’s the basis of all of my comments over the last few months. That 0.2 degrees C keeps popping up in a number of data plots, some of Dr. Spencer’s work, but I still can’t understand why the oceans show a bit more than that and they of course trump the air temperatures. Hate to question ARGO but they are the next stop to question. But, your right, it’s but a very small fraction of one degree over the 20th century, no doubt about it and GISS has screwed it up! Their UHI adjustments are all wrong and UHI has nearly zero effect on the global temperature, just on the local thermometers, usually at the airports. Many scientists have already proved that the amount of heat energy coming from mankind within cities is so small it can be ignored globally but not locally, that’s the catch.
I find it odd that in all the reporting about cycles the obvious is ignored. Namely, oceans are three dimensional, water flows, and Earth rotates. Rotation would seem to influence any flows on Earth, air or water. Maybe if one wants to know about the currents in the Atlantic Ocean then studying how those currents respond to the size, shape, latitude, Coriolis force, density, temperature, and irregularities of the ocean floor (mid-Atlantic Ridge being one) should be considered. Physical processes take time. For example the Antarctic Circumpolar Wave takes about 8 or 9 years to make a full circle with its large irregular alternating pools of warm and cool water.
http://www.ecosmagazine.com/?act=view_file&file_id=EC97p22.pdf
Explanations of these things called ocean cycles, such as the PDO or AMO, require understanding the physical processes at work in each of the oceans and any interconnectedness. What is the North Pacific Ocean doing as it goes from a warm PDO to a cool PDO? What is flowing? Where? Amounts? Forces? Bathymetric influences? Physical description, please?
Can I make a judgment as to CO2’s influence, or Jupiter’s, or cosmic rays without that physical description?
It is this Pacific current that first exposed the climate fraud and its dishonest reporting by the press to me in 2005. For 5 minutes a BBC news reporter described how the Pacific current melted the ice in the arctic. The melting was accelerated by the low albedo of the water which absorbs 15 times the solar energy of the reflective ice. ( An unstable positive feedback system).
Alas, I thought, someone who has the intelligence to do more than repeat the CO2 mantra.
Does this reporter conclude that we should be looking at more than CO2? My jaw dropped as she concluded that this is the reason we should support efforts to outlaw CO2.
After examining the Cambridge University Report of Nov 2004 on which I believe the news report was based and another US arctic report I realized that the reports cited by the warmists didn’t even support the warmists claims if you read beyond the biased executive summaries.
The effect of the pacific currents and the albedo changes on Arctic ice melts needs to be told as it is the arctic ice and the poor polar bears that is getting the publicity and the legal backing to effect change.
Someone also ought to take Cambridge University to task for their biased report.
http://www.skepticalscience.com/ocean-and-global-warming-intermediate.htm
Oceans are warming across the globe. In fact, globally oceans are accumulating energy at a rate of 4 x 10*21 Joules per year – equivalent to 127,000 nuclear plants (which have an average output of 1 gigawatt) pouring their energy directly into the world’s oceans. This tells us the planet is in energy imbalance – more energy is coming in than radiating back out to space.
The notion that the ocean is causing global warming is ruled out by the observation that the ocean is warming (Levitus 2005). Internal climate changes such as El Nino and thermohaline variability stem from transfers of heat such as from the ocean to the atmosphere. If the ocean was feeding atmospheric warming, the oceans would be cooling.
#############################################################
There are measurements of different ocean area showing warming overall reinforcing AGW theory.
#############################################################
Other studies
In fact, ocean observations confirm both global warming and its cause. Barnett 2007 compares observations of ocean temperatures to results from the Parallel Climate Model (PCM) and finds “model-produced signals are indistinguishable from the observations”. This suggests “the observed ocean heat-content changes are consistent with those expected from anthropogenic forcing, which broadens the basis for claims that an anthropogenic signal has been detected in the global climate system.”
#############################################################
In response to raw vs adjusted temperature data. Here is a lengthy explanation from Nasa of what they are doing.
http://www.ncdc.noaa.gov/oa/climate/research/ushcn/ushcn.html
The Jeff Green link does not work.
Thanks to all who have read the info.
paulhan says:
November 1, 2010 at 1:22 pm
How are you defining the “skeptics case” and how does it differ from a denialist case?
If you are defining the skeptics case as being that the science is so uncertain that no mitigation efforts should be undertaken, then I submit that this is the denialist case and not the skeptics case.
Many of the posts on this blog strike me as the posting of denialists posing as skeptics, rather than true skeptics. Based on the information I have gathered on Joe D’Aleo, CCM, he appears to be pushing a political and idealogical agenda in the guise of a skeptic rather than being a person who is acting as a skeptic in the interests of advancing the understanding of climate science.
I am certainly not interested in ” demolishing the economies of the western world” based on the lifestyle that I have grown accustomed to. I am troubled that you see the issue of human influences on climate in such extreme terms. There are less extreme measures that could be taken to mitigate or diminish negative aspects of human influences on climate and the environment. It is not practical to eliminate all negative aspects of human influences. The selection of mitigation measures will involve a balancing of benefits derived and costs avoided with the costs incurred to carry out the mitigation. Taking an approach of doing nothing and passing the cost on to future generations is not a responsible approach..
Wayne:
I have no problem with using the UAH version 5.3 temperature records which indicate warming of .138 degress centigrade per decade.
“Bob Tisdale says:
November 1, 2010 at 2:23 pm
Stephen Wilde wrote: “To rebut what I say it needs to be shown that the jets can move equatorward when the stratosphere is cooling and the temperature differential between surface and stratosphere increasing.”
Actually, it’s your burden to prove you’re right, not ours to prove you’re wrong. You always seem to miss that point.”
Actually I have discharged that burden by pointing out that it is physically impossible for the jets to move poleward when the stratosphere is warming or equatorward when the stratosphere is warming.
Furthermore all available observations so far show that to be true.
There are plenty of examples of so called sudden stratospheric warmings when the jets plunge equatorward in response. The stratosphere cooled as the jets went poleward in the late 20th century and are now more equatorward with a slightly warmer stratosphere.
@green
“oceans are warming across the globe”
Oh really?
http://climexp.knmi.nl/data/ihadsst2gl_1998:2011a.png
“the observed ocean heat-content changes are consistent with those expected from anthropogenic forcing, which broadens the basis for claims that an anthropogenic signal has been detected in the global climate system”
Oh really?
http://climexp.knmi.nl/data/iheat700_global_2004:2011a.png
Number of effects show similar trend to the Arctic temperature, but none as close as the geomagnetic field.
http://www.vukcevic.talktalk.net/AGSN.htm
@Will Crump.
You yourself said that there are many factors that go into making the climate what it is. All I’m asking is that we quantify properly what role CO2 plays, and whether it is net positive or negative.
Have you any insights that will advance that, or are you just grandstanding? Labelling and calling people names doesn’t cut it here. So far as I can see, CO2’s role has been a net positive.
warming in the arctic early 1920`s is marked in this article
http://www.climate4you.com/Text/1922%20SvalbardWarming%20MONTHLY%20WEATHER%20REVIEW%20.pdf
“equatorward when the stratosphere is warming.”
in my post of 11.49 pm
should read:
“equatorward when the stratosphere is cooling.
Stephen Wilde and Bob Tisdale
Another view: North hemisphere’s jet-streams are controlled by the polar jet-stream.
http://www.srh.noaa.gov/jetstream//global/images/jetstream3.jpg
Polar jet stream is moved by the heat released (rise of warm air) from the North Atlantic drift current around 60 degrees north, mainly in the area of Labrador Sea.
http://weather.unisys.com/surface/sst_anom.gif
the L. Sea temperature anomaly is changing on daily basis since there is no fixed pattern of currents strength in the area. Labrador Sea currents govern the strength of the subpolar gyre’s circulation, which is the engine of the heat transport across the North Atlantic Ocean.
How far north or south polar jet stream is diverted by these events it depends on the strength of the cold East Greenland current relative to the warm North Atlantic current, which together form subpolar gyre.
Stephen Wilde replied, “Actually I have discharged that burden by pointing out that it is physically impossible for the jets to move poleward when the stratosphere is warming or equatorward when the stratosphere is warming.”
I must have missed that. Please show the calculations and data that prove your conjecture.
paulhan says: November 2, 2010 at 1:55 am
All I’m asking is that we quantify properly what role CO2 plays, and whether it is net positive or negative.
Paul Han you make a very important point, worth considering in more detail:
Let’s look at CO2 release and the Arctic temperature during the last 100 or so years:
http://www.vukcevic.talktalk.net/CO2-Arc.htm
Ignore the green line and concentrate on the blue (CO2) and red (Arctic temp).
1900 – 1950 CO2 rises slowly (low rate of rise) the temperature shoots up.
1950 -1980 CO2 suddenly takes off at the fastest rate ever, temperatures drop.
1980 -2000 CO2 rate slows down temperatures go up again.
Thus, CO2 is really crucial element in the Arctic temperature change, not the absolute level of CO2 but it is its rate of change that drives the temperature change, or put it in numerical terms:
d(CO2)/dt + dT/dt = const
Well that appears to be a new ‘incontinent truth’.
Hence, to prevent the rapid melting of the Arctic ice, we need to pump CO2 into atmosphere at an increased rate, i.e. doubling of CO2 emissions every 20 years, as it was case from 1950-80, when temperatures actually droped.
What do you (and R. Gates) say?
vukcevic says:
November 2, 2010 at 3:23 am
d(CO2)/dt + dT/dt = const
vukcevic,
Does your equation also apply to the annual cycle of CO2 gas concentration that brings lower CO2 values during the Arctic summer season?
Barrow 13CO2 Flask
“Bob Tisdale says:
November 2, 2010 at 3:02 am
Stephen Wilde replied, “Actually I have discharged that burden by pointing out that it is physically impossible for the jets to move poleward when the stratosphere is warming or equatorward when the stratosphere is warming.”
I must have missed that. Please show the calculations and data that prove your conjecture.”
That should read “equatorward when the stratosphere is cooling”. Also all other things being equal i.e. no concurrent change of temperature of the troposphere but I assumed that went without saying because I have always held that there are two processes at work simultaneously.
You might as well ask me to ‘prove’ that increasing the downward slope of a river bed speeds up the rate of flow rather than slowing it down. It is pretty much self evident from day to day observation and knowledge of basic physics.
In similar manner a cooling of the upper atmosphere ‘must’ increase the upward energy flux. That then raises the height of the tropopause and the jets move poleward. Exactly as per real world observations throughout the late 20th century warming period. Thus self evident from observations and basic physics.
Anyway, show me a time on multidecadal timescales that the stratosphere warmed and the jets moved poleward. All available data, though somewhat limited, shows that a cooler stratosphere draws the jets poleward and a warmer stratosphere sends them equatorward.
vukcevic says:
November 2, 2010 at 2:35 am
I accept the validity of those examples but my hypothesis subsumes them into the net global effects. It isn’t all about PDO and AMO but the net global oceanic contribution to energy transfer to the air.
I have often said that the top down solar effect is only half the story. The other half is the bottom up oceanic effect of which those phenomena form a part.