By Steve Goddard
Summer has come to a premature and frosty end at Santa’s workshop.
")
http://psc.apl.washington.edu/northpole/webphotos/noaa2.jpg
It has been the coldest summer on record north of 80N, and temperatures have dropped below freezing ahead of the average date.
")
The entire ice covered region is now below freezing.
")
http://www.esrl.noaa.gov/psd/map/images/fnl/sfctmp_01.fnl.gif
It also appears that the summer melt season will be the shortest on record. The maximum was reached very late in March, and it appears likely that we are headed for an early minimum.
")
Mark Serreze at NSIDC has stated :
As the climate warms, the summer melt season lengthens …”
He was also reported as saying :
Mark Serreze of the center forecast the ice decline this year (2010) would even break 2007’s record.
Another interesting fact is that we are almost certain to see a large increase in the amount of multi-year ice (MYI) next year. The reason being that almost all of the 1-2 year old ice (turquoise) in the NSIDC map below will become classified as MYI next spring.
")
We have seen a remarkably rapid recovery from the 2008 low volume.
PIOMAS continues to report record low volumes of ice, despite all evidence to the contrary. The image below shows in red how far off the mark their August 15 forecast was. Their modeling error will get much worse over the next two weeks – because they model much of the thick multi-year ice in the Beaufort Sea and Arctic Basin as only a few tens of centimetres thick.

With the cold temperatures, ice area loss has almost stopped.

http://arctic-roos.org/observations/satellite-data/sea-ice/observation_images/ssmi1_ice_area.png
However, ice extent continues to drop – because the Arctic Oscillation has turned negative and winds are compacting the ice towards the pole. This bodes well for continued growth of ice in 2011.
")
http://www.ijis.iarc.uaf.edu/seaice/extent/AMSRE_Sea_Ice_Extent.png
PIPS shows average ice thickness increasing, due to the compression of the ice.
")
There has not been a lot of ice loss during August. The modified NSIDC image below shows in red, areas that have lost ice since August 1. Note that the Greenland Sea appears to have lost ice. This is due to the fact that there has been very little transport out of the Arctic Basin through the Fram Strait, which again bodes well for ice gain in 2011.

The modified NSIDC image below shows ice gain since 2007.

NSIDC maps continue to show more gain (16%) than their graphs (10%.) I have not been able to get a satisfactory explanation from them about the cause of that discrepancy. DMI shows a 25% gain in 30% concentration ice over 2007.
My forecast (dashed line below) minimum of 5.5 million (JAXA) continues to look conservative. It all comes down to what the winds do over the next few weeks. If the winds keep compressing the ice, the minimum may go a little below 5.5. If the winds quiesce, the minimum may come in a little above 5.5 – which is looking like a pretty good number right now. Some people at NSIDC started out with a 5.5 forecast this year, but seem to have backed away from it since.

Academic theories about the Northwest Passage becoming a commercial shipping opportunity appear pretty clueless.
“The plans that you make can change completely,” he says. This uncertainty, delay, liability, increased insurance and other costs of using the Northwest Passage are likely to deter commercial shipping here. A ship with a reinforced hull could possibly make it intact through the passage. But if it got stuck, it would cost thousands of dollars for an icebreaker like the Amundsen to come to the rescue. So even if the Northwest Passage is less ice-choked than before, the route may not become a shipping short-cut in the near future, as some have predicted.
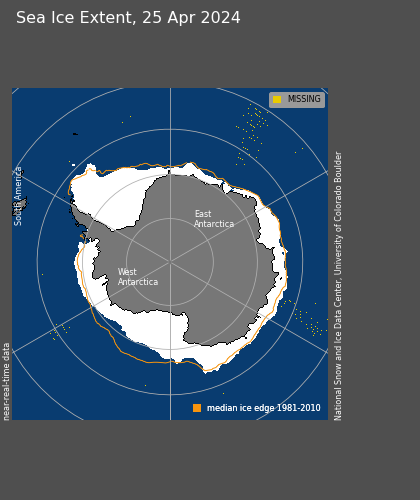
The South Pole will almost certainly set a record for most sea ice this season. It is almost there, and there are still several months of growth remaining.
")
http://www.iup.uni-bremen.de:8084/amsr/ice_ext_s.png

http://nsidc.org/data/seaice_index/images/daily_images/S_daily_extent.png
As seen below, the symmetry between the North and South Pole is impressive through the satellite record. They always seem to move opposite each other and produce an approximately constant amount of sea ice. It would be nice if the experts focused on solving this relationship rather than making up forced explanations like the “Ozone Hole” – which has just started forming for the year and will be gone before Christmas.

UIUC North/south anomalies overlaid on top of each other.
http://arctic.atmos.uiuc.edu/cryosphere/IMAGES/seaice.anomaly.arctic.png
http://arctic.atmos.uiuc.edu/cryosphere/IMAGES/seaice.anomaly.antarctic.png
(Note to posters and ice experts. Before you embarrass yourself making comments about how seasons are out phase at opposite poles, remember that this is normalised data and the period is in excess of 30 years.)
Conclusions:
The “long term trend” (30 years) in Arctic ice continues to be downwards, and would be even if the ice minimum was a record high this summer. But the three year trend shows strong growth of extent, thickness and age. Meanwhile, Antarctic ice is blowing away the record books. Yet the press continues to spread massive disinformation about the state of ice at both poles. Who could possibly be responsible for that?
Sponsored IT training links:
Get COG-112 materials along with 352-001 dumps to practice and pass 000-977 exam in timely and cost saving manners.
Discover more from Watts Up With That?
Subscribe to get the latest posts sent to your email.
David Gould says:
August 15, 2010 at 7:00 pm
This is the list of averages…
Those type of averages haven’t been working this year. This year is changing the averages. Averages smooth-over things sometimes.
Amino Acids in Meteorites,
We’ll all be in withdrawal. Counselling, perhaps? 😉
David W says:
August 15, 2010 at 7:21 pm
You have to remember that ice drifting out of the basin into warmer waters contributes to ice loss (as R Gates pointed out in an earlier post).
That was pointed out by Steven Goddard and others here at WUWT long before R. Gates did.
Just The Facts,
I don’t know what time frame or smoothing method should be used. I know I can look at the graph and see a relation:
http://img685.imageshack.us/img685/9959/uiucnorthsouth.jpg
The graph only goes back to 1979. I wish satellite data went back 2000 years.
Global warming says both Poles are supposed to be warming and losing ice. The graph shows the earth has a balance. Global warming is supposed to have taken the world out of balance—and I do have video evidence that it is supposed to have done that, not just written-in-a-news-report evidence. Video is mightier than the pen:
David Gould says:
August 15, 2010 at 7:27 pm
We’ll all be in withdrawal. Counselling, perhaps? 😉
lol!
Maybe we can switch over to trying to guess how low into negative anomaly temperature will go from La Nina.
Walt Meier says:
August 15, 2010 at 5:43 pm
The intent of the SEARCH Sea Ice Outlook effort is not to issue predictions,
AND
Scientifically, prognostications about the upcoming summer minimum are not particularly important (the long-term trend is), but if they’re a fun parlor game.
AND
We do occasionally use “forecast” in an informal sense, though I can understand that some people may take it literally. I apologize if people take it the wrong way.
Some recent Mark Serreze parlor game predictions
“Could we break another record this year? I think it’s quite possible,”
“We are going to lose the summer sea-ice cover. We can’t go back.”
“the decline is likely to speed up even more in June and July.”
“the ice decline this year would even break 2007’s record.”
“the upcoming 2010 sea ice minimum will set a new record.”
“We still expect to see ice-free summers sometime in the next few decades.”
Walt thanks for coming to WUWT and commenting. The problem I have is that the MSM tends to feed off Mark Serreze’s informal parlor games and takes them seriously. To put this all in the proper perspective shouldn’t he, on behalf of the NSIDC, formally advise the MSM that his forecasts are only a bit of light hearted fun.
It’s normal for author’s names to be centered. In Europe, it’s standard for them to be all-caps (including in references). And WUWT threads aren’t “dry technical articles,” so their standards needn’t be ours. In popular magazines, author’s names are often either enlarged or boldfaced.
Furthermore, in any blogware system where the name of the “poster” (Anthony) is automatically inserted beneath the title, the potential for confusion exists. I’ve seen at least a half-dozen comments this year where readers have made a mistake about authorship as a result.
Amino Acids in Meteorites says:
August 15, 2010 at 7:44 pm
Maybe we can switch over to trying to guess how low into negative anomaly temperature will go from La Nina.
That’s a capital idea. Looking over the temp drop with the sun still up, I dare say come Sept. 21st, when the Arctic Sun goes down, the white stuff will hit the fan.
Frank, yes the Telegraph article you read is in error. It’s not the first time the media has linked NSIDC to a quote that never came from NSIDC. We try to correct these when they occur. If you have a link to the article I can follow up with The Telegraph.
thanks, Julienne
Whilst I wouldn’t normally pay any heed to a single days loss, I couldnt help but mention the data is now out for 15th August on the JAXA site and its 40,256 sq km.
This struck me as kind of a coincidence considering we’ve discussed whether we might not follow the same pattern as 2006 for the remainder of the season which incidentally had an ice loss of 40,625 sq km on the 15th August 2006.
Before any of you warmers out there shout me down, I know a single day doesn’t really mean anything but if this year does end up following 2006’s path it would strike me as one of life’s little ironies.
rbateman says:
August 15, 2010 at 8:00 pm
Maybe we can switch over to trying to guess how low into negative anomaly temperature will go from La Nina.
That’s a capital idea. Looking over the temp drop with the sun still up, I dare say come Sept. 21st, when the Arctic Sun goes down, the white stuff will hit the fan.
Actually I meant after minimum is reached we won’t have these Arctic ice threads. So to occupy the months after minimum we could start guessing how far negative anomaly will go from the La Nina happening now. But readers couldn’t know that’s what I meant since they can’t read my mind. I wasn’t clear enough.
mecago says:
August 15, 2010 at 2:31 pm
[QUOTES JIMBO]
Jimbo says:
August 15, 2010 at 12:32 pm
Am I correct in stating that an Arctic sea ice extent recovery over the next 3 years would put the theory of positive feedback at the Arctic in serious trouble?
Then there’s this:
“The predicted substantial decrease in Arctic summer sea ice concentrations during the twenty-first century may favor cloud formation, which should diminish or even cancel the ice-albedo feedback by shielding the surface.”
XXXXXXXXXXXXXXXXXXXXXXXXXXXXXXXXXXXXXXXXXXXXXX
[MECAGO THEN RESPONDS TO JIMBO]
No, you’re not correct in making long term predictions based on (alleged) short term fluctuations. Remember that 10 years from now.
It’s also nice to see that you are focused on the reversal of a one dimensional factor such as albedo while ignoring the multi-dimensional consequences of altered weather systems and its effects on crops.
[WAYNE THEN MAKES A PARTIAL QUOTE FROM MECAGO]
wayne says:
August 15, 2010 at 3:15 pm
mecago says:
August 15, 2010 at 2:31 pm
“…altered weather systems and its effects on crops”
____
You must mean the projected bumper crops across the board this year. All of that snow was great for the crops this year, wasn’t it.
XXXXXXXXXXXXXXXXXXXXXXXXXXXXXXXXXXXXXXXXXXXXXXX
MECAGO NOW RESPONDS TO WAYNE:
You obviously don’t keep up with simple chronological order. Jimbo was originally speaking about the Arctic ice cap opening up and then producing cloud cover that would substitute for the ice albedo effect.
I then responded by bringing up the other changes that WILL OCCUR when that happens. WILL OCCUR is future tense. I hinted at when it may occur by telling him to keep note of his short term prediction of Arctic ice recovery ten years from now.
Ten to twenty years is the estimated time for the Arctic to be ice free (initially for days, then weeks and months) with the beginning of changing weather patterns for the entire Northern Hemisphere possibly beginning before it is even totally ice free.
What now is the relevancy of our CURRENT bumper crops with the probability that they will be adversely effected within THE NEXT ONE OR TWO DECADES?
What will we do after minimum is reached?
I think we should concentrate on warning citizens about preparing themselves for bad-to-the-bone winter cold .
The disasters in S. America are fresh in memory. No one need be caught looking.
Julienne
I see provocative and easy to misinterpret quotes from Mark Serreze all the time.
Two years ago he declared the Arctic to be an “ice island” to the press, and got an strong negative response from NIC. Then there was the ice free pole bet, and the “breathtakingly ignorant” WUWT. Not to mention the “death spiral.”
Sounds more like politics than science to me.
Amino Acids in Meteorites says:
August 15, 2010 at 8:25 pm
We need a N. Hemisphere Winter thread, or something similar.
A place for people to check the offical forecasts vs what’s going down on the ground.
Not that I don’t trust our climate institutions, it’s just that I don’t trust our climate institutions track record of the past 3 years.
After the minimum extent is done for the year we can start taking bets on where we might head for a maximum extent particularly if the minimum is reached early.
Roger, you’re actually serious about this!
Are you the one that came up with “the beverage you are about to enjoy is hot”?
You took note of the tiny, faded print saying who posted it, but failed to see the author’s name, printed so much larger and more prominently.
Okay, maybe you’re just springing to the defence of the foolish or careless, but there is just one Idiot and he’s onto it now, I think.
I’m assuming that when you wrote “author’s names”, you meant “authors’ names”.
It is the convention in Europe to do it thus.
Julienne says:
August 15, 2010 at 8:18 pm
Frank, yes the Telegraph article you read is in error. It’s not the first time the media has linked NSIDC to a quote that never came from NSIDC. We try to correct these when they occur. If you have a link to the article I can follow up with The Telegraph.
thanks, Julienne
—
Here it is, Julienne (it was embedded in my original post)…note that it is from 2008.
http://www.telegraph.co.uk/earth/earthnews/3345666/North-Pole-ice-may-disappear-by-September.html
Walt and Julienne
Further to my point about proselytizing, this report offers a good example:
http://www.arcus.org/search/seaiceoutlook/2008_outlook/downloads/monthly-reports/summary-report/12-meier-summary_report.pdf
Everything seems factual and reasonable until the last sentence:
“Regardless, with a growing radiative forcing, an eventual transition to ice-free summers seems inevitable.”
Why was this sentence included? It seems highly speculative and no supporting evidence is provided.
Frank K. says:
August 15, 2010 at 5:35 pm
mecago says:
August 15, 2010 at 2:00 pm
“Frankly” speaking mecago, it’s too bad that the alarmist news headlines don’t state those probabilities “frankly” but instead produce the hype headlines that I noted above.
XXXXXXXXXXXXXXXXXXXXXXXXXXXXXXXXXXXXXXXXXXXXXXXXX
In case you did not carefully read the article that you quoted; it was supposed to be “scientists”, unspecified of course, that made the 50/50 prediction. Who else would it be? So why are you saying that “ALARMISTS!” (Danger! Will Robinson) don’t state those possibilities?
And who produces those HYPE headlines if not the Media rag you quoted above? Not that one can trust anything the Telegraph says (Ever heard of Primary Sources?).
Furthermore, if one is going to be honest about quoting the other side of any issue, they should note THE RANGE or spectrum of different opinions instead of cherry picking ideas or dates of individuals that may be at one extreme or the other.
For example, 2020-2030 is the time range predicted for an ice free Arctic, in the
Summer (For a few days initially and excluding the Canadian Arctic Islands initially.). That was down considerably from 2040+ due to Earth’s own Reality Check.
Nevertheless, one can predict that, you chillists will claim that we were predicting 2013. This based on one individual by the name of Maslowski who stated that there was, if I recall correctly, a 70% chance of ice free summertime Arctic by 2013-2015.
I’ve even seen fools, on this very site, insist that it had to be 2013 because WE were responsible for the Media’s representation of us. Yeah right.
Quite the display of Wishful Thinking:
http://climateinsiders.files.wordpress.com/2010/08/myforecastverificationaugust15_2010.jpg
We’ll soon know if Santa brings you what you wished for.
This is what sea ice melt looks like (8/15/10 in the Beaufort Sea):
http://rapidfire.sci.gsfc.nasa.gov/subsets/?subset=Arctic_r05c02.2010227.aqua.250m
Those swirly lines show when sea ice becomes sea water – when the melting sea ice “runs out of thickness”. Look closely over the next 5 weeks – after that, melt season is pretty much over.
I may have a bit too much spare time on my hands, but I just noticed something interesting about the *DATES* of arctic ice extent minima, as per IARC JAXA. The dates of the minima average 8.5 days earlier in even numbered years versus odd-numbered years…
2002 => Sep 9
2004 => Sep 11
2006 => Sep 14
2008 => Sep 9
Mean day is Sep 10.75, with std dev 2.363
2003 => Sep 18
2005 => Sep 22
2007 => Sep 24
2009 => Sep 13
Mean day is Sep 19.25, with std dev 4.856
Note also that
2004 is 7 days earlier than 2003
2006 is 8 days earlier than 2005
2008 is 15 days earlier than 2007
I’m willing to throw out 2007 as an exception. It was a “double-dip” minimum, with the previous one being aboutt 8 or 9 days earlier. This would bring 2007-2008 in line with the previous 2 transitions. One week before Sept 13 (2009’s minimum) is September 6th. So if the pattern holds, we should see the minimum on or about Labour Day. An early minimum in 2010 looks distinctly possible, given the below-normal temps north of 80 this year, as reported by DMI.
I am not into numerology, so I’d prefer a scientific explanation. Would QBO (Quasi-Biennial Oscillation), and its effects on winds, be a candidate?
Amino Acids in Meteorites says:
August 15, 2010 at 7:42 pm
Just The Facts,
I don’t know what time frame or smoothing method should be used. I know I can look at the graph and see a relation:
http://img685.imageshack.us/img685/9959/uiucnorthsouth.jpg
The graph only goes back to 1979. I wish satellite data went back 2000 years.
Global warming says both Poles are supposed to be warming and losing ice. The graph shows the earth has a balance. Global warming is supposed to have taken the world out of balance—and I do have video evidence that it is supposed to have done that, not just written-in-a-news-report evidence.
—…—…—…—
And no NSIDC nor GISS nor IPCC commentator has given a reason why, if their Mann-made CAGW theory is correct, daily DMI Arctic summer temperatures at 80 north have not only decreased since 1958, but have begun decreasing much faster in recent years than when CO2 levels were higher (1962 – 1980). Worse, summer Arctic temperatures are decreasing at a rate that will shortly (10-15 years) mean that Arctic summer temperature never even get above freezing.
Amino Acids in Meteorites said:
August 15, 2010 at 7:10 pm
“Temps are already below freezing above 80N. .. But it all comes down to the winds……”
Temps are not below freezing above 80N, Alert was at +3.5C max yesterday. So it’s not just all wind either at this time of year either, although some people would like to paint it that way.
Andy
Pamela Gray said
August 15, 2010 at 3:40 pm
“Gunther, what do you see in your links that says the passage will be clear? I’m seeing just the opposite. Clouds will prevent any further significant solar melting. The winds are forecasted to be not very strong and will diminish. Is your forecast mixed with hope?”
————————-
Weather forecast for Arctic Bay and Resolute shows sunshine and some cloud
http://www.weatheroffice.gc.ca/city/pages/nu-27_metric_e.html
http://www.weatheroffice.gc.ca/city/pages/nu-10_metric_e.html
Andy