By Joseph D’Aleo, CCM ICECAP.US
El Nino is still hanging on but likely not for very long. Warmer than normal water can still be seen along the equator in the tropical Pacific. It is even warmer in the sub-tropical North Atlantic because of the suppressed winter jet stream and subtropical high which meant lighter than normal winds and less clouds.

Signs of the demise of the El Nino are numerous. It is likely given the flip of the PDO which favors shorter El Ninos and stronger, more frequent and lengthy La Ninas that a moderate to strong La Nina is next in the cards this year and next.

Notice in the temperature anomaly plot for NINO region 34 (region shown on the CDC map below)

How we are somewhere between 1998’s super El Nino and a cluster of more moderate ones and how they declined quickly by the summer on the graph that follows (enlarged here). Values are given in STD of NINO 34 SSTA.
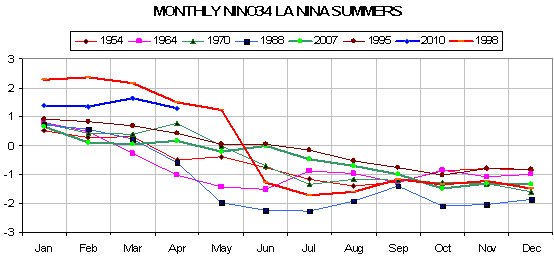

ENSO models, both dynamical (coupled air and ocean models) and statistical suggest a rapid cooling with all models dropping below threshold El Nino levels by summer (JJA – June-July-August) and perhaps half reaching La Nina values by summer or fall.
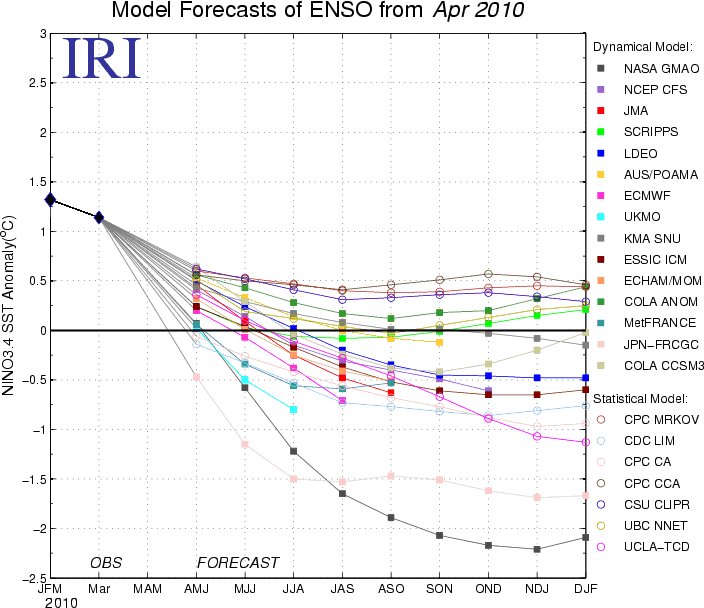

In the depth cross section across the entire tropical Pacific that is built from the TAO-Triton buoy data, we can see the warm water in the eastern top water which was 5C above normal has diminished as the water mixes with cooler surface water and the thermocline is lifted. Notice the developing strong cold pool not unlike that in 1998 at 100 meters across most of the Pacific. Notice the amazing cool down of NINO34 in 1998 from May to June in the multiyear graph above.
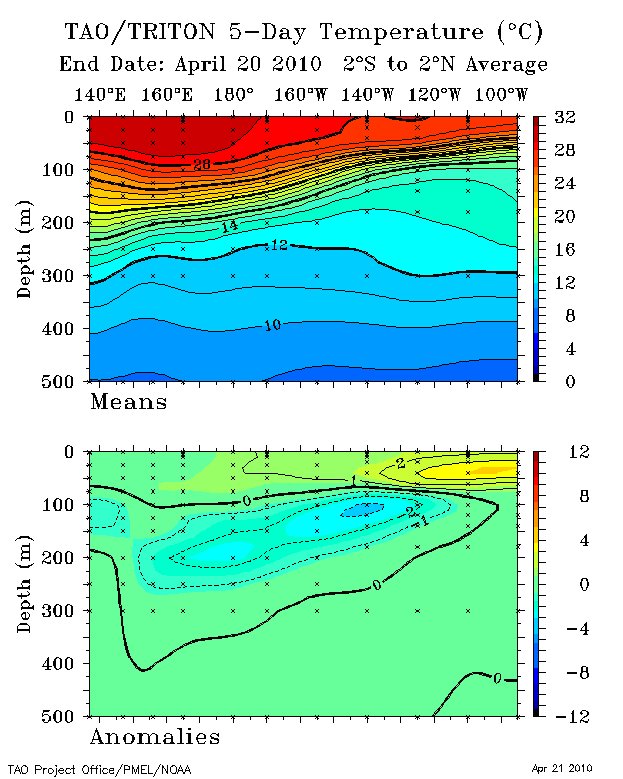

The El Nino followed two years of La Nina with below normal temperatures in NINO34 and in much of the Pacific leading to below normal ocean heat content in the tropical eastern half of the Pacific. A strong La Nina in 2007/08 was followed by a summer rebound then another dip in January.
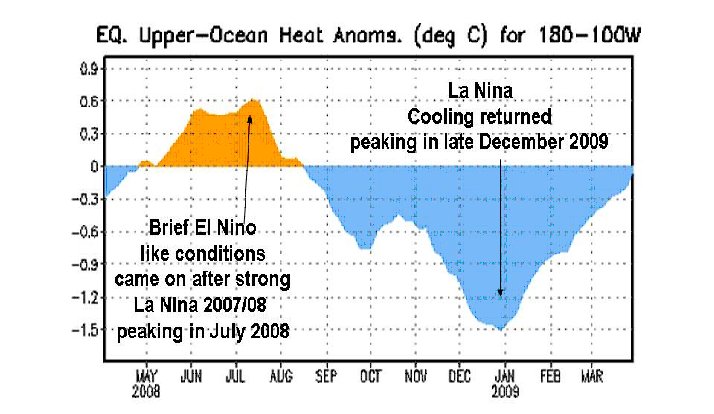

We can see in the heat content the last year, a peak last summer a fall decline and then a multi peak winter warming fed by westerly wind bursts this past winter, notice the decline as we started April.
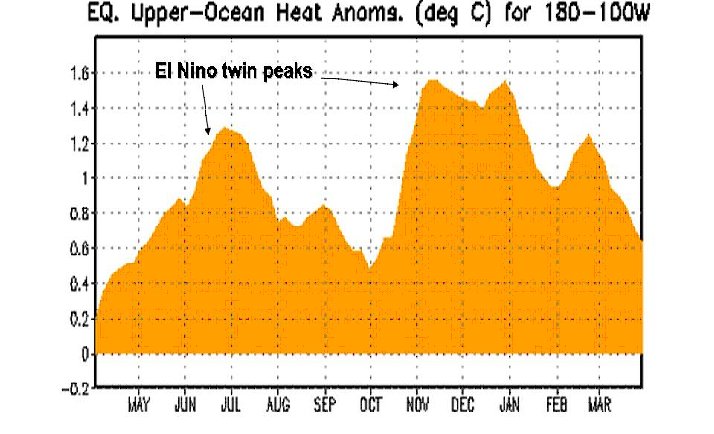

The Southern Oscillation Index which was in positive La Nina territory in 2007/08 and 2008/09 dropped into negative El Nino territory reaching an incredible 8 STS in early 2010. It has rebounded to positive and usually leads the change of ENSO state by a few months given credence to a return of La Nina.
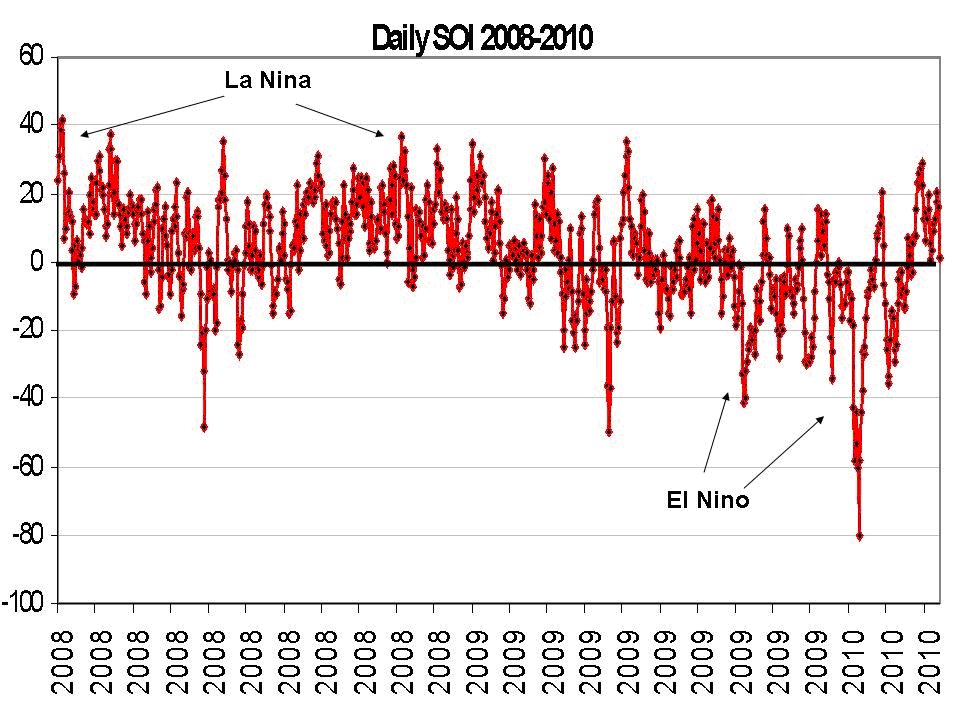

See much more on the possible implications for the summer and following winter (with recognition of the possible influence of the solar and volcano wildcards) here.
Paul Vaughan (17:35:14)
Big volcanoes on El Nino and La Nina:
http://www.volcano.si.edu/world/largeeruptions.cfm
http://www.cpc.ncep.noaa.gov/products/analysis_monitoring/ensostuff/ensoyears.shtml
Volcanoes do correspond to monthly temperature uplifts, but not ENSO phase.
Re: Bob Tisdale (14:17:21)
Bob, thanks for drawing our attention to this:
“Is The Difference Between NINO3.4 SST Anomalies And The PDO A Function Of Sea Level Pressure?”
http://bobtisdale.blogspot.com/2010/04/is-difference-between-nino34-sst.html
The Upper Ocean Temperature Anomalies in the Pacific say that a La Nina is coming soon.
http://www.ecmwf.int/products/forecasts/d/charts/ocean/real_time/xzmaps/
http://www.cpc.ncep.noaa.gov/products/analysis_monitoring/ocean/anim/wkxzteq_anm.gif
For the other indicators, the SOI is predicting La Nina while the Trade Winds and Atmospheric Angular Momentum are neutral.
——–
I agree with Bob Tisdale about the PDO just being an extension of the ENSO. The actual PDO index is not as cyclical as some of the charts on the Internet show.
phlog
“Looking good for a hottest on record 2010.” The wording is wrong, it should say looking good for a hottest summer temperature on record in the UK. Which will get you 10/1 at the local bookie.
Dr. Roy Spencer will be interviewed tonight (Mon.) on Coast-to-Coast from 10pm to 2am Pacific time.
Bill Illis (18:58:56) :
The Upper Ocean Temperature Anomalies in the Pacific say that a La Nina is coming soon.
I hope that would mean a cooler July to October here in Northern California. That’s the hottest part of the year. Mild summer is nice.
So, the 30 billion dollar question: what does this mean for corn and soybean yields this year? What will this do to the futures market?
I always like to see real data presented like Joseph D’Aleo, Bill Illis, Roy Spencer, Steven Goddard, Willis Eschenbach, Bob Tisdale, Jeff Id, Anthony, and others do.
I just wish they’d present the data on video. Seems to be a more productive way to learn. These posts would probably fit in a 10 to 20 minute video. And it would not be good for the regulars here but it would be a nice way to show friends what the real data is showing.
With video being so easy to do on the internet it seems like it would be good all the way around—especially for those guests doing the posts since people could hear their tone of voice as they presented their work—to have it on video.
typo
And it would not be good for the regulars here but it would be a nice way to show friends what the real data is showing.
should be
And it would not be good —not just for—for the regulars here but it would be a nice way to show friends what the real data is showing.
Ulric Lyons (18:51:37) “Volcanoes do correspond to monthly temperature uplifts, but not ENSO phase.”
It is becoming apparent that the graphs I’ve posted are being misread. (Word-explanations of graphs are generally clutter, but when I have funding I might reorganize for other audience segments.)
As for the work by Mann & others: They missed a whole dimension to the relationships.
Looking forward to hearing back from you on HMF3.2a…
Bill Illis (18:58:56) “I agree with Bob Tisdale about the PDO just being an extension of the ENSO.”
Is that really what Bob is saying in his recent post?
I took the main point to be about a difference between N3.4 & PDO being related to SLP.
Friendly note, the following sentence could be worded better, it crossed my eyes for a moment:
How we are somewhere between 1998’s super El Nino and a cluster of more moderate ones and how they declined quickly by the summer on the graph that follows (enlarged here).
What the heck is that persistent hot spot off South America (Uruguay/Paraguay) ?
Also check out Joe d’Aleo’s second half of the article:
http://icecap.us/index.php/go/joes-blog/the_transition_between_solar_sunspot_cycles_23_and_24_sun_back_in_mini_slum/
“Between November, 2008, and September, 2009, the AP index returned persistent readings of 4’s and 5’s, sinking to 3’s in October and November, and finally to 1 in December – which is the lowest reading in the 165 years of observations since 1844”
Since 1844, wow!
“cooling of up to 2.20 C may occur during Cycle 24”
This on top of the PDO cycle swing. Chilly.
IVI = Ice-core Volcanic Index & decadal ENSO
More phase-concordance:
http://www.sfu.ca/~plv/IVI2_SOI.png
This hints of insights into the role of north-south terrestrial asymmetry in the 20th century climate record. 90, 60, 30, & 20 year harmonics of the lunisolar harmonic spectrum may not be manifest in a spatially uniform fashion. (See the works of Russian scientist Yu.V. Barkin.)
–
Also, humor:
Burst out laughing when I read this:
“Monthly and Spatially Dependent Stratospheric Loading from Volcanic Eruptions, 501-2000 A.D.”
“Column 1: Time of loading […] Column 2-775: Sulfate aerosol loading from 9 km to 30 km at 0.5 km resolution for each 10-degree latitude belt (from 90 degrees south to 90 degrees north) for the corresponding month.”
Take a minute to think about that resolution.
http://climate.envsci.rutgers.edu/IVI2/
kadaka (KD Knoebel) (14:19:07)
Thanks for the advice on hardware. Sadly I have to lug round a heavy conventional laptop since I need it for training and demos with 3D analysis software which makes big demands on video graphics, disc, memory etc. But what you suggest might be a nice idea for our daughters.
rbateman
Looks ominous, but it has nothing to do with the tropospheric hot spot that the warmists failed to find. Nevertheless, looking at the end of the Eemian I think we should be a little concerned.
Writing in Quaternary International, scientists from the Helmholtz Centre for Environmental Research (UFZ), the Saxon Academy of Sciences (SAW) in Leipzig and the Russian Academy of Sciences say that a short warming event at the very end of the last interglacial period marked the final transition to the ice age.
Been there, done that.
Andrew30 (15:43:00) :
“That is simple enough to be right. Iff:
The small amounts of iron in the oceans are drawn to the magnetic poles, they are small but they are many….”
There is an additional factor: saline sea water current is a conductor moving within the Earth’s magnetic field. Depending on the sea current direction (clock- or anticlock-wise) and the N or S magnetic hemisphere, current circulation may be fractionally increased or reduced due to counter emf induction.
There are number of coincidences or should that be ‘coincidences’ in the geomagnetic trends and global temperature trends. I have in past pointed to some:
http://www.vukcevic.talktalk.net/LFC8.htm
http://www.vukcevic.talktalk.net/LFC16.htm
http://www.vukcevic.talktalk.net/LFC19.htm
http://www.vukcevic.talktalk.net/LFC21.htm
This is the best news I have heard in ages. For a small piece of the planet that suffers negatively under the Boy Child, the return of a prolonged Girl Child is great news. All of my best astronomy has been done during strong La Nina peiods. When I first started out in astronomy during 1974-75, our first great astrophotography period 1988-89, and the time that I did most of the observations for my part of “THe Night Sky Observer’s Guide Vol III, The Southern Sky,” late 1999 to late 2001, were all strong La Nina periods.
Down here on the west coast of the Lower North Island, New Zealand, a strong La Nina means a reversal from the predominately normal westerly flow that brings cloud, but not always rain. The only drawback for La Nina here is an increased likelihood of tropical cyclones dropping down our way between November & May. Other than that it is all good.
Swings and roundabouts folks!
Cheers
Coops
rbateman (22:09:40) :
“What the heck is that persistent hot spot off South America (Uruguay/Paraguay) ?”
Hi Robert
Since doc Svalgaard isn’t around, I would hazard to say: Cosmic rays energetic particles (low SS count) found weak spot in the Earth’s magnetic field, the South Atlantic Magnetic Anomaly where the Earth’s magnetic field is weakest. This of course could be anomalous recording by satellite rather than actual temperature.
http://www.vukcevic.talktalk.net/LFC19.htm
From the wicked Wikipedia:
The South Atlantic Anomaly is of great significance to astronomical satellites and other spacecraft that orbit the Earth at several hundred kilometers altitude; these orbits take satellites through the anomaly periodically, exposing them to several minutes of strong radiation, caused by the trapped protons in the inner Van Allen belt, each time. The International Space Station, orbiting with an inclination of 51.6°, requires extra shielding to deal with this problem. The Hubble Space Telescope does not take observations while passing through the SAA.[3] Astronauts are also affected by this region which is said to be the cause of peculiar ‘shooting stars’ seen in the visual field of astronauts.[4]
I’d like to see a resolution of the terminology problem as regards PDO and ENSO.
Bob Tisdale is right that PDO is simply a statistical artifact of ENSO but there is a common usage of ‘PDO’ to mean the underling ocean shifts that occur periodically.
Joe employs the term in that common usage sense in his post.
Perhaps one should use a different term for the oceanic phase shifts themselves but I fear that by now the common usage has gone too far and there is little point picking up on it.
Most readers will by now associate PDO with the phase shifts themselves and not the statistical index.
rbateman (22:09:40) :
What the heck is that persistent hot spot off South America (Uruguay/Paraguay) ?
http://www.cpc.ncep.noaa.gov/products/analysis_monitoring/enso_update/gsstanim.shtml
It was stronger early Feb, then eased off, and then returned recently, similar pattern around Tasmania.
Steve Schaper (20:10:28) :
So, the 30 billion dollar question: what does this mean for corn and soybean yields this year? What will this do to the futures market?
IMHO; average to below average yield for corn, average to above average yield for soybean, resulting in little tradable movement in either.
What is really interesting is the warm spot at 40s 50w off of South America. Very rarely do you ever find a negative anomaly in that area. I just randomly picked archived maps from all years and there is almost always a warm spot in that area. Underwater volcano or something?
Brian D : Perhaps this has something to do with it:
http://www.vukcevic.talktalk.net/LFC19.htm