First, we pointed this out quite some time ago. See: Winds are Dominant Cause of Greenland and West Antarctic Ice Sheet Losses and also NASA Sees Arctic Ocean Circulation Do an About-Face
Second I’m pleased to see the Guardian finally catching on.You can watch wind patterns in this time lapse animation:

From the Guardian:
Wind contributing to Arctic sea ice loss, study finds
New research does not question climate change is also melting ice in the Arctic, but finds wind patterns explain steep decline.
Much of the record breaking loss of ice in the Arctic ocean in recent years is down to the region’s swirling winds and is not a direct result of global warming, a new study reveals.
Ice blown out of the region by Arctic winds can explain around one-third of the steep downward trend in sea ice extent in the region since 1979, the scientists say.
The study does not question that global warming is also melting ice in the Arctic, but it could raise doubts about high-profile claims that the region has passed a climate “tipping point” that could see ice loss sharply accelerate in coming years.
The new findings also help to explain the massive loss of Arctic ice seen in the summers of 2007-08, which prompted suggestions that the summertime Arctic Ocean could be ice-free withing a decade. About half of the variation in maximum ice loss each September is down to changes in wind patterns, the study says.
Masayo Ogi, a scientist with the Japan Agency for Marine-Earth Science and Technology in Yokohama, and her colleagues, looked at records of how winds have behaved across the Arctic since satellite measurements of ice extent there began in 1979.
They found that changes in wind patterns, such as summertime winds that blow clockwise around the Beaufort Sea, seemed to coincide with years where sea ice loss was highest.
Writing in a paper to be published in the journal Geophysical Research Letters, the scientists suggest these winds have blown large amounts of Arctic ice south through the Fram Strait, which passes between Greenland and the Norwegian islands of Svalbard, and leads to the warmer waters of the north Atlantic. These winds have increased recently, which could help explain the apparent acceleration in ice loss.
…
read the complete story at the Guardian
Discover more from Watts Up With That?
Subscribe to get the latest posts sent to your email.
Philhippos (12:43:37) : “If CO2 had a colour would we be able to see its presence in the air at its present or predicted concentrations? If, as I suspect not, then making this clear would help to convince many more people that it cannot be relevant.”
Not really. CO2 has a couple of spectral bands where it’s opaque. Humans don’t have receptors in those bands, so we can’t see any “color.” You need to do more homework if you’re going to post OT speculation. Google carbon dioxide, spectral absorption.
Bill Marsh (12:47:39) :
Well of course it doesn’t question ‘Climate Change’, bet it doesn’t question the grassy knoll theory or alien bodies at Area 51 either.
They moved the alien bodies to Hangar 12 at Wright-Patterson in the ’60s.
I thought *everybody* knew that…
Vuk etc. (12:25:52) :
Correction:
that should be 1170km/h,
VeryTallGuy (12:15:38) :
Hello, anyone read the article ?
“Arctic winds can explain around one-third of the steep downward trend in sea ice extent”
ie the other two thirds is due to warming.
Even at the most simplistic reading this is yet another study backing up the consensus on warming. Why commenters here think it challenges that is genuinely bemusing.
To relieve your bemusement I would suggest you reference this paper
http://iabp.apl.washington.edu/research_seaiceageextent.html
and this animation that the authors created to illustrate their point
http://iabp.apl.washington.edu/animations/Rigor&Wallace2004_AgeOfIce1979to2007.mpg
Here is their description of that animation
This animation of the age of sea ice shows:
1.) A large Beaufort Gyre which covers most of the Arctic Ocean during the 1980s, and a transpolar drift stream shifted towards the Eurasian Arctic. Older, thicker sea ice (white ice) covers about 80% of the Arctic Ocean up to 1988. The date is shown in the upper left corner.
2.) With the step to high-AO conditions in 1989, the Beaufort Gyre shrinks and is confined to the corner between Alaska and Canada. The Transpolar Drift Stream now sweeps across most of the Arctic Ocean, carrying most of the older, thicker sea ice out of the Arctic Ocean through Fram Strait (lower right). By 1990, only about 30% of the Arctic Ocean is covered by older thicker sea ice.
3.) During the high-AO years that follow (1991 and on), this younger thinner sea ice is shown to recirculated back to the Alaskan coast where extensive open water has been observed during summer.
The age of sea ice drifting towards the coast explains over 50% of the variance in summer sea ice extent (compared to less than 15% of the variance explained by the seasonal redistribution of sea ice, and advection of heat by summer winds).
You may want to take note of that last sentence. You may also note that these folks are employed at the University of Washington, not exactly a hotbed of CAGW skepticism.
“”” Philhippos (12:43:37) :
Not directly relevant to this item but I can’t get into Notes & Tips so I ask it here.
My question is: If CO2 had a colour would we be able to see its presence in the air at its present or predicted concentrations? If, as I suspect not, then making this clear would help to convince many more people that it cannot be relevant. “””
Well in order to have a color it would need to be reflective (or emissive) somewhere in the visible spectrum, since color is a special property of the human eye. We have no idea what “visible radiation” looks like to any other species.
We don’t seem to be able to see any other component of the earth atmosphere either; including water vapor, which is far more prevalent and energy absorptive than CO2, so I would say the answer is no.
But then I don’t expect we can see Hydrogen Cyanide either; whcih doesn’t mean it won’t do anything bad.
But CO2 is one moleculae out of 2577 in the atmosphere (at present) while Boron or Phosphorous atoms are between one in ten million and one in 50,000 in the silicon chips in your computer; so would you think they are irrelevent to the proper operation of your computer ?
Not a good argument to try and make.
The Arctic is comprised of many topographical climate zones. It is best to see it, and study it, not as one entity but as several. Issues relevant to the discussion would be fresh water sources, land proximity, weather shadows, currents coincident with wind patterns, seabed topography, degree of axial tilt in each climate zone GPS address, and pressure systems such as those that affect not only the AO, but local weather variability that determines local wind direction/speed, etc. The Arctic isn’t melting, only pieces of it are. And only pieces re-build. The goodies are in which pieces. These individual areas correlate with local seasonal weather pattern variability and larger oscillations quite well.
Cassandra King.
Here in Scotland today a pre pre election blurb running to six pages with a number of policy headings and views propounded by David Cameron, National Conservative leader, together with the Scottish Conservative Leader and my constituency MP, avoided any reference, direct or oblique, to AGW, CC, or any other of it’s continually changing names.
For the time being, at least until the election is over, neither oposition nor Gov dare speak it’s name!
“”” Enneagram (13:03:11) :
George E. Smith (12:02:59) : The Linus Pauling cost me $21; the modern supertext a whopping $157.
That shows that a genius like Linus Pauling needed less words, “spinned” knowledge is more confusing and expensive. BTW You paid $7.50 more than the Amazon’s price. “””
Yeah but at Amazon.com, they don’t let me sit on the floor for two hours reading their books to see if there is anything in them I want. I never would have located either book at Amazon.
Yes I could have looked at them at Stanford; and then ordered them on line; would even have saved California’s punitive 10% sales tax; but then I would have to lie to the Cal tax man on my next year’s tax return; the Stanford book store would close down; and I wouldn’t know what to order from Amazon. Otherwise it is a great idea.
PS, I’m not registered for anything at Stanford; so it is their generosity as a Private Institution to even let me on their campus.
Bill Tuttle (13:23:20) :
They moved the alien bodies to Hangar 12 at Wright-Patterson in the ’60s
Among these a peculiar specimen which they named “Al Gore”. I thought everybody knew that…
“”” Enneagram (13:03:11) :
George E. Smith (12:02:59) : The Linus Pauling cost me $21; the modern supertext a whopping $157.
That shows that a genius like Linus Pauling needed less words, “spinned” knowledge is more confusing and expensive. BTW You paid $7.50 more than the Amazon’s price. “””
Well luckily, the Linus Pauling was a paperback; and was in the main floor science section; along with “Quantum Chromodynamics for dummies”. Interestingly half the books on the main floor were 50% off. Also the Political Science section had 100 books for each title in the Physics section including the Colelge text section. Which probably proves that Political Science is hardly a science at all; merely opinion.
The “Women’s Studies” section had ten times the Physics or Chemistry sections. Mostly about male violence.
You mean the winds are changing along with the temps, sounds like climate change to me. As far as CO2, green house gases are only 2% of the atmosphere BUT greenhouse gases account for 60% of the heat trapping gases.
Of course it was the wind…
AND the heat…
AND the currents.
Here’s some closing lyrics from a nice little song called “Nothing But the Wind”:
There is so much between heaven and earth
How can you declare that it has no worth
The tyrant within you is your only hint
He makes you believe that it’s all nothing but the wind
Full song can be found at:
http://www.lyricsmode.com/lyrics/g/golden_dawn/nothing_but_the_wind.html
____
True Believers on both sides of the AGW issue, “warmists” and “skeptics” alike, in as much as they are 100% certain of their position, that certainty is the tyrant within.
Another AGW fallacy bites the dust.
Badly. They keep getting blown out to sea and into the Atlantic. Shipping is on alert to watch for hungry bears that might climb aboard looking for a meal.
VeryTallGuy (12:15:38) :
Hello, anyone read the article ?
“Arctic winds can explain around one-third of the steep downward trend in sea ice extent”
ie the other two thirds is due to warming.
Even at the most simplistic reading this is yet another study backing up the consensus on warming. Why commenters here think it challenges that is genuinely bemusing.
Hello, anyone read the graph:
http://arctic-roos.org/observations/satellite-data/sea-ice/ice-area-and-extent-in-arctic
Eyeballing, The Arctic is about 100,000 km from normal and still rising. Does that challenge your consensus? You must be very tall because it’s obvious your head is in the clouds.
The unbeatable logic of Joe Bastard!
I have my own “channel.” Today’s interesting video shows how the warmth that the GISS data shows doesn’t jive with the global sea ice. If it’s so darn warm, how is it there is so much ice? In fact, Southern Hemisphere sea ice, in spite of Goddard showing it warm down there, had the least ice melt in their summer than I have seen on the whole graph on the cryosphere today. And as warm as the arctic was, how is sea ice so close to normal?
The answers are simple. We have only been using satellite data since the late 1970s, they have readjusted temps they use down since they are showing a mean all the way back to 1950. If it’s this warm, then why is ice so high? Well the only way it can be so warm… against the 60-year means, is it had to be colder before. But if that is the case, why is there so much ice?
You see folks, you can’t change the way you measure things and say it’s the same thing. It’s the reason tree ring proxies aren’t the real deal.
In any case, something does not jive, so take a look at that.
http://www.accuweather.com/video.asp?channel=vblog_bastardi
It is interesting. I saw a presentation at CU where Inuit elders said it was the wind. I guess that wasn’t very press-worthy though.
In re my comment above Dave Wendt (13:23:36) : the sea ice drift maps at DMI
http://ocean.dmi.dk/arctic/icedrift/index.uk.php
suggest, to my eye at least, that the Beaufort Gyre may be returning to a status similar to the pattern from the 80s when old ice dominated the western Arctic, perhaps in response to changes in the AO. It’s really too early to tell if this shift is real, but if it should develop and persist, it would suggest a stronger recovery of the Arctic ice going forward, regardless of any trends in Arctic temps.
http://climexp.knmi.nl/data/icrutem3_hadsst2_0-360E_70-90N_na.png
When shall we see THIS Arctic temperature record in newspapers, scientific studies or any other stupid press releases?
But of course the Guardian can’t bring themselves to start the who article out by saying”New research does not question climate change is also melting ice in the Arctic…..”.
They still cling to their AGW cross.
Tim,
Actually, I was thinking the arctic might possibly rise above it’s 6 year mark of not being in a positive anomaly state this spring…it actually about 200,000 sq. km below normal right now for this time of year, but it still could push over into the positive range…depends on how fast the spring melt kicks in. I really believed that the deep solar minimum and the negative AO index of the winter would push the arctic sea ice into the positive range…we’ll see.
Even if it does slip into the positive range, I still think we’ll have a strong melt season this year, as the the water near Greenland is very warm, and the ice will melt fast on that side of the arctic. I don’t see anything changing the longer term trend of the arctic being in a long slow spiral toward lower and lower year-to-year sea ice, and I still believe that AGW is likely correct and the arctic will be ice free in the summer this century, perhaps as early as 2030.
VeryTallGuy (12:15:38) :
“Hello, anyone read the article ?
“Arctic winds can explain around one-third of the steep downward trend in sea ice extent”
ie the other two thirds is due to warming.”
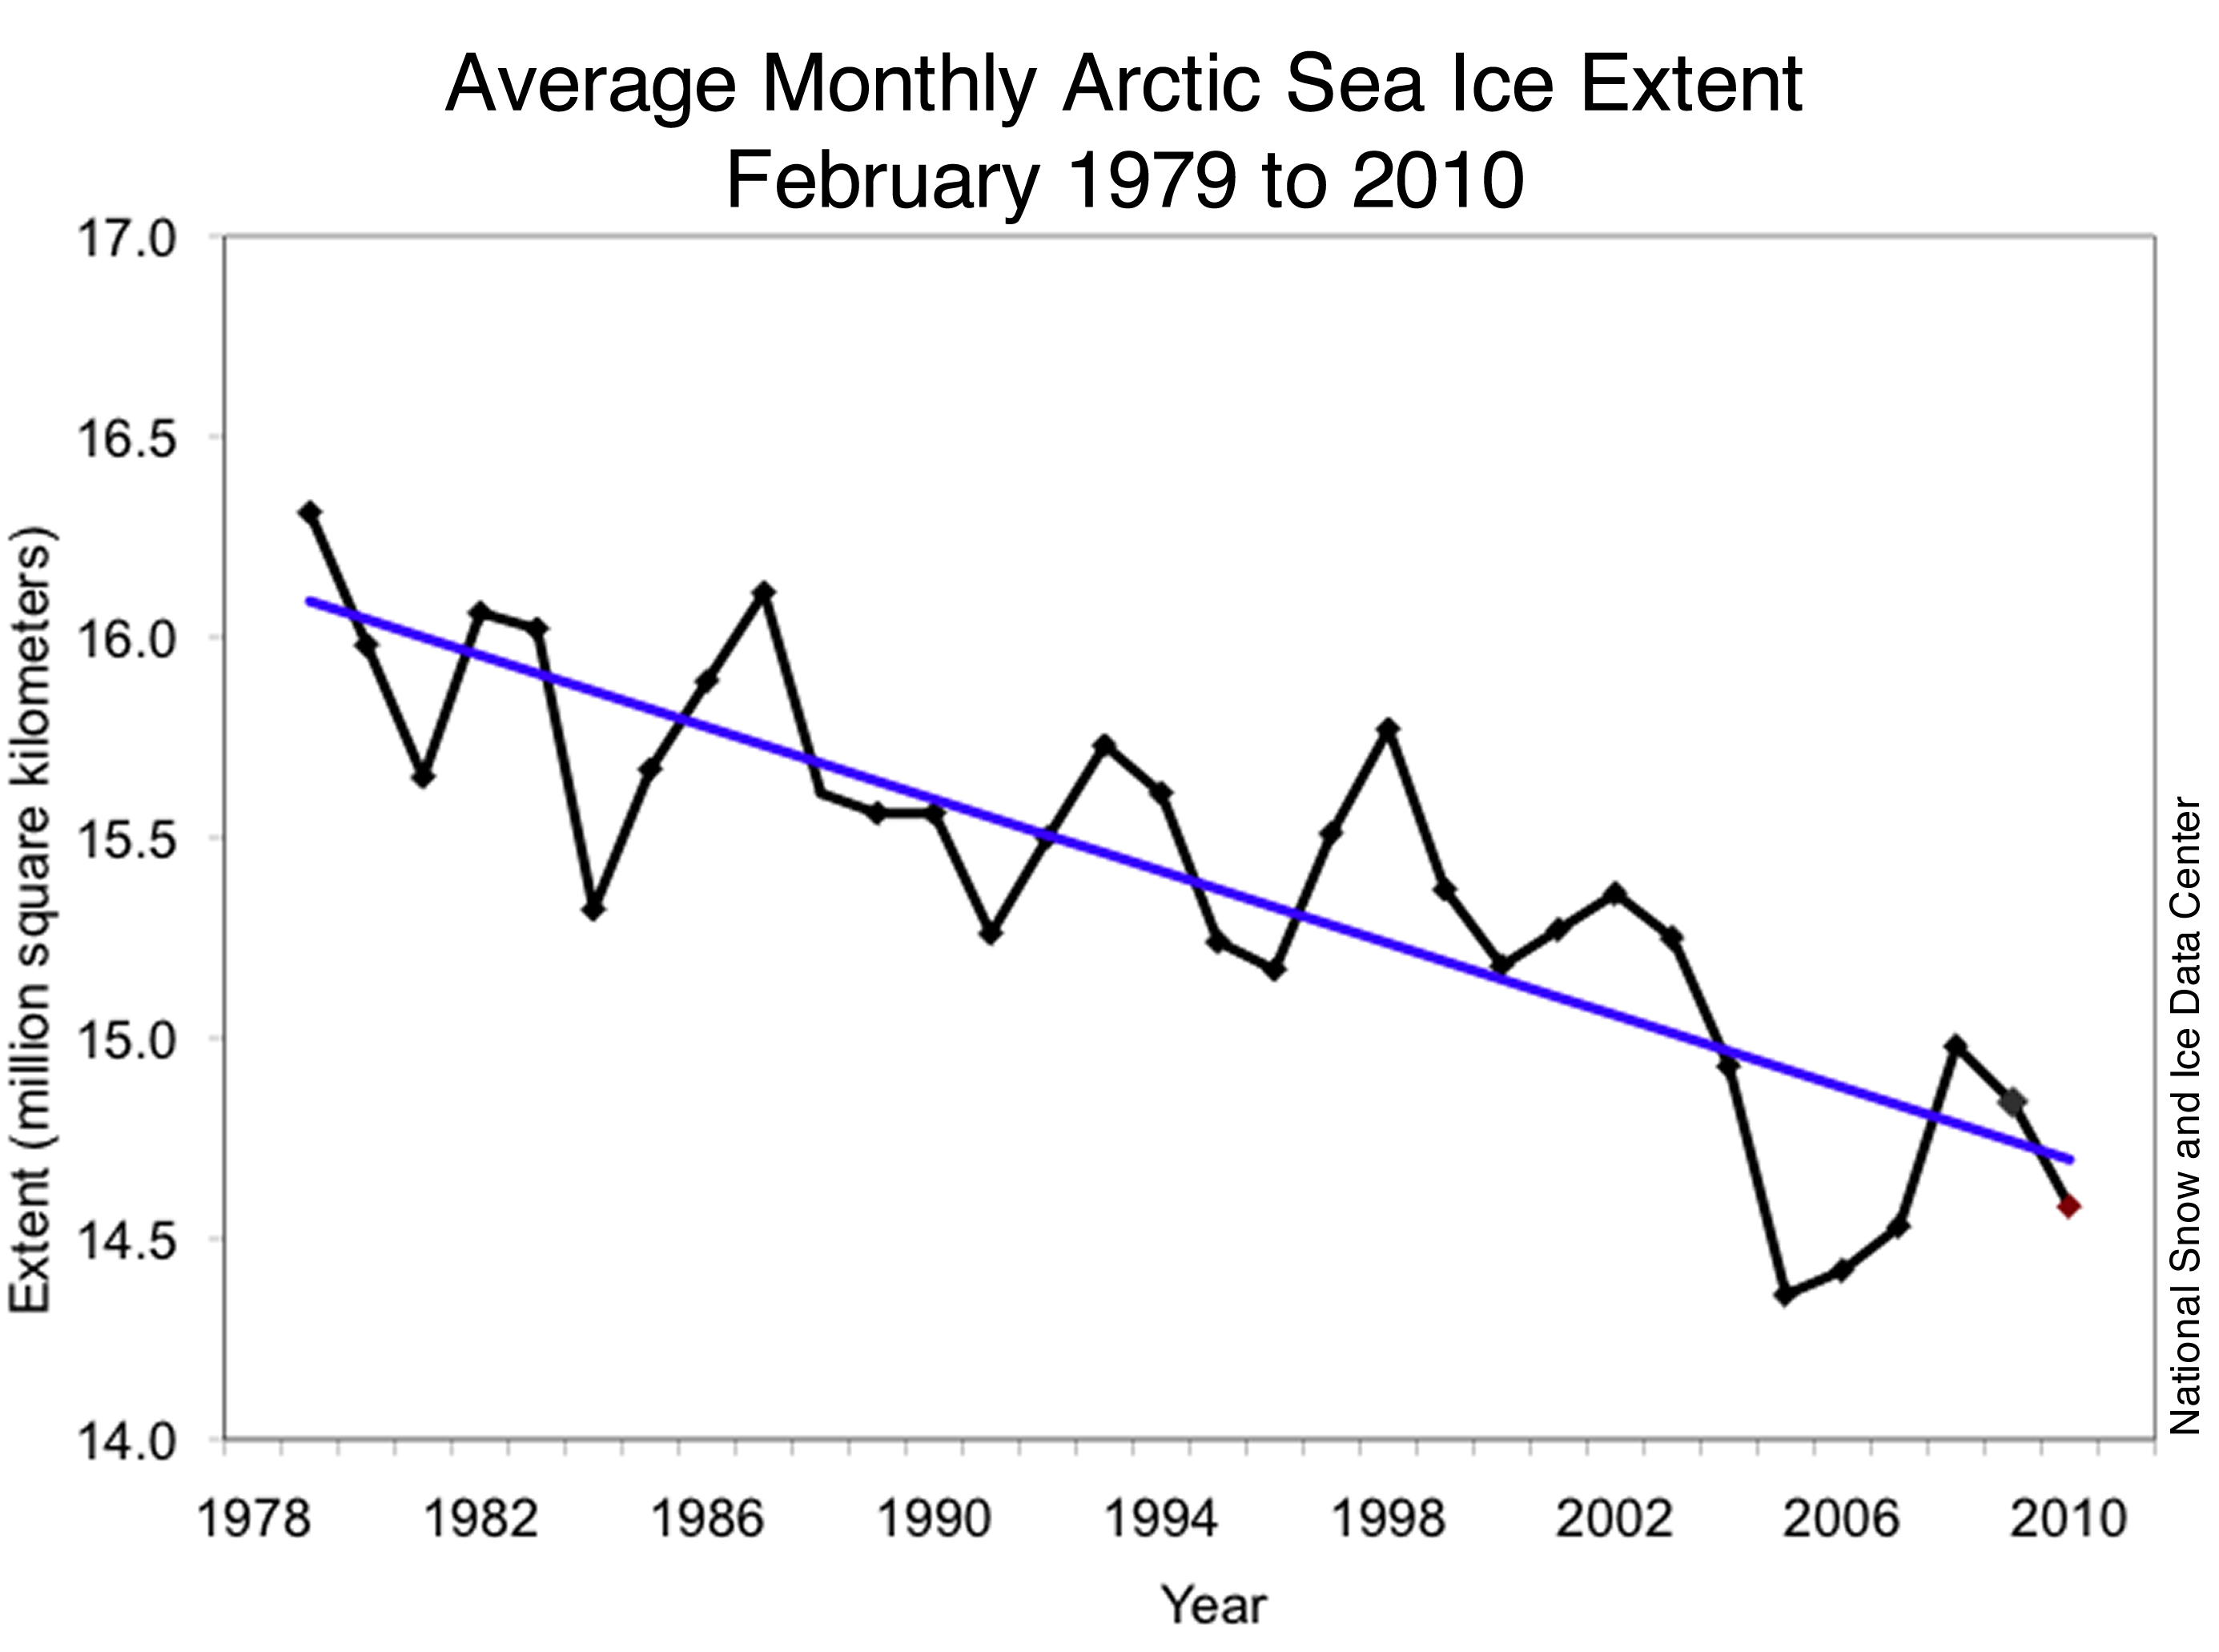
http://nsidc.org/arcticseaicenews/
“Arctic sea ice extent averaged for February 2010 was 14.58 million square kilometers (5.63 million square miles). This was 1.06 million square kilometers (409,000 square miles) below the 1979 to 2000 average for February, but 220,000 square kilometers (85,000 square miles) above the record low for the month, which occurred in February 2005. ”
Artic sea ice appears to be growing at the moment, I suppose the AGW crowd could claim it’s due to warming.
R. Gates (13:45:16) wrote: “True Believers on both sides of the AGW issue, “warmists” and “skeptics” alike, in as much as they are 100% certain of their position, that certainty is the tyrant within.”
There is some truth to what you wrote.
And, as I recall from previous threads that you claim to be (if my memory serves me) 75% AGW “warmist” and 25% “skeptic”.
Problem with your claim: I never see comments where you entertain the skeptical side your intellect. So, I end up wondering if that is somekind of ruse so you can possibly be more persuasive for the AGW position.
Now, R Gates, you can alleviate my concern if you would provide some detail or give some insight to the 25% “skepic” part of your intellect.
Since, you have taken to commenting, here, on a skepical website (which is a good thing), I’m sure other readers would be also interested an explanation of how you figure on the 75% / 25% split of your intellect.
That header should have read “The undeniable logic of Joe Bastardi”
The Guardian environment team seem to be “challenged” when it comes to reading numbers.
They link to the source of their graph as http://nsidc.org/arcticseaicenews/ but manage not to read the caption of that graph.
Figure 3. Monthly February ice extent for 1979 to 2010 shows a decline of 2.9% per decade.
—Credit: National Snow and Ice Data Center
They manage to report this as 10% / decade !!
This confirms the idea someone posted above that The Guardian are responsible for climate change. About 2/3 of it in this case.
Last September a similar article managed to report a 18% reduction in arctic sea ice as only 18% remaining.
http://www.guardian.co.uk/environment/2009/sep/16/ocean-temperature-el-nino-noaa
“Sea ice covered an average of 6.3m sq kilometres (2.42m sq miles) during August, according to the national snow and ice data centre. That was 18.4% the 1979-2000 average”
No, sorry that was 18% LESS THAN the 1979-2000 average.
So if we plot a trend in The Guardian’s exaggeration of climate data we see a fall from a factor of 4 to factor of 3 in just 5 months ( 5% per month or 120% per decade ). This is a statistically significant change and suggests that they could achieve accurate reporting around before 2020.