In Debunking National Wildlife Federation Claims – Part 2 some commenters claimed that the snow data cited from WRI “was not good enough”. OK then, on to a bigger catchment. Steve Goddard replies in this brief essay.
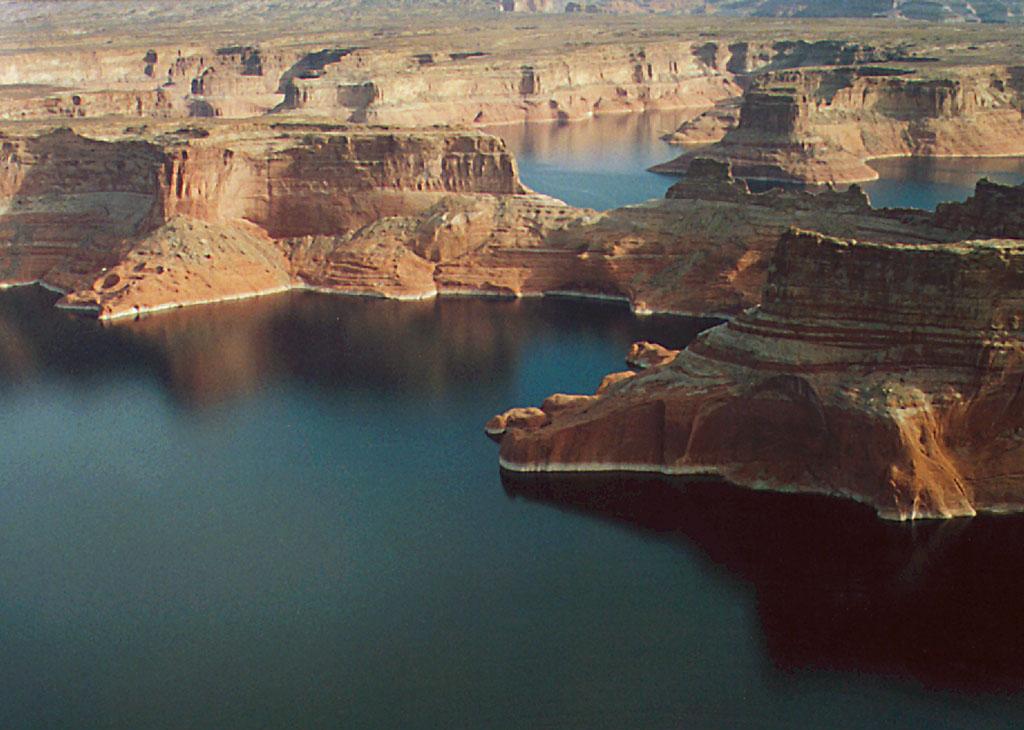
From Wikimedia: Lake Powell from above Wahweap Marina. July 2004, by Dave Jenkins
Lake Powell (Arizona and Utah) provides a good proxy for western slope snowfall, because much of the snow in Wyoming, Colorado, Utah and Northwestern New Mexico drains into the lake via the Colorado, Green and San Juan Rivers. The lake currently contains more than 4.5 trillion gallons of water and is 490 feet deep at the dam.
Between 2000 and 2005, drought conditions (combined with greatly increased water usage in Arizona, California, Nevada and Colorado) caused Lake Powell levels to drop nearly 120 feet. This prompted a considerable consensus of global warming hysteria.
Every scientific study confirms that global warming will cause the amount of water in the Colorado River to decline
But a strange thing happened in 2006 – the lake level stopped declining and instead started increasing rapidly. As you can see in the table below from lakepowell.water-data.com, since 2005 the lake elevation has increased by more than 60 feet above the 2005 low of 3562 ft. As of January 29, at 3622 ft. the lake is within three feet of the January 29 average of 3625 feet elevation. The volume of water in the lake has increased by 65% in the last five years to 4.5 trillion gallons. (At movie theater prices for bottled water, that could almost erase the US National Debt.)
The yearly change in volume is determined by the formula :
delta H = inflow – outflow – evaporation – seepage
Evaporation is relatively constant from year to year as is seepage, so the formula can be written as:
delta H = inflow – outflow – K
Outflow (water usage) has greatly increased over the last few decades due to massive population increases in Phoenix, Las Vegas and Southern California – not to mention the large and ever increasing amount of water being used by the biofuels industry. (It has been estimated by the University of Twente in The Netherlands that the manufacture of one liter of biodiesel requires 14,000 liters of water).
The point being that despite large increases in outflow, the lake level has been rapidly recovering. This could be due to only one explanation – lots and lots of snow in the Rocky Mountains during the last five years.
And an extra bonus from the “weather is not climate” department – January 29, 2010 at 39.9 degrees was ten degrees below normal and the second coldest on record.
Lake Powell (Arizonaand Utah) providesa good proxy for westernslope snowfall,because much of the snow in Wyoming,Colorado,Utah and NorthwesternNew Mexicodrainsinto the lake via the Colorado,Green and San Juan Rivers. The lake currentlycontainsmore than 4.5 trilliongallonsof water and is 490 feet deep at the dam.
Phil M,
The article mentions “lots and lots” of snow since 2005, and it also mentions a drought prior to that. Nevertheless, the long term trend in the Colorado Rockies has been towards increasing or at least steady snow over the last 100 years (with a very large year over year variability.)
Sharpshooter
February 2, 2010 1:36 am
Maybe I’m missing something, but the Plate and the Colorado are on opposite sides of the Continental divide. ??!
In the mountains northeast of Phoenix, the Salt River Project had to open the floodgates to prevent overflow of the various reservoirs that serve as the Central Arizona water sources.
One other interesting point is that for a few years (2002-2006 or so) it was often interesting that after torrential rains, the reported rainfall was something like a half inch. I know it’s anecdotal, but my wife and daughter got stuck at a drug store for four hours (August, 2003) taking cover from a rain storm that was purportedly 0.63 inches. Sky Harbor airport had to shut down for two hours due to the monsoon like rain.
Yeah, 0.63 inches my wet behind.
Symon
February 2, 2010 3:28 am
Mr Goddard,
1) Are you going to respond to the post from Randy (06:43:21)?
2) You say “Outflow (water usage) has greatly increased over the last few decades”. Have you downloaded the data from http://lakepowell.water-data.com/ to confirm this? Unlike reservoir level, which is more or less the integral of the inflow minus the outflow, picking a single day of the year back through the record is not sufficient to meaningfully chart outflow trends. Where is the data to back your increased outflow claim?
3) I gather you are the guy who wrote about CO2 condensation at the South Pole on this website without understanding a phase diagram, and apparently, from your comments, still believe in this phenomenon despite the experimental evidence presented in a subsequent article on this website. I wonder, are you the same Steven Goddard as the one that wrote this article? http://www.theregister.co.uk/2008/08/15/goddard_arctic_ice_mystery/
The article where ice area was equated to unweighted pixels on a satellite image.
The article where Dr. Walt Meier said:-
“Besides this significant error, the rest of the article consists almost entirely of misleading, irrelevant, or erroneous information about Arctic sea ice that add nothing to the understanding of the significant long-term decline that is being observed.”
Roger Knights
February 2, 2010 4:07 am
Gail Combs (11:13:36) :
Kum Dollison (22:02:57) :
“Steve, you made reference to Biodiesel. Biodiesel, in the U.S., is made from waste veg grease, or Soybeans, Not Corn…”
You are incorrect because your information is old. Straight from the USDA:
“USDA closely monitors markets for many commodities, including corn and soybeans—important feedstocks for ethanol and biodiesel, respectively.
But the word “respectively” matches soybeans with biodiesel, supporting Kum rather than disproving her. (Excuse me if this dispute has been resolved and I didn’t notice.)
Steve Goddard (22:04:29) :
“The article mentions “lots and lots” of snow since 2005, and it also mentions a drought prior to that. Nevertheless, the long term trend in the Colorado Rockies has been towards increasing or at least steady snow over the last 100 years (with a very large year over year variability.)”
Again, in comparison to other studies, you present a minimal amount of evidence to support your claim. I kindly refer you to the follow peer-reviewed article. Ignore the sections inclusive of climate models if you wish, there are three graphs showing trends that dispute your claims. They present 50 years worth of SWE and temperature data for ~40 stations in the central Rockies, as well flow measurements for the Colorado River. http://www.matr.net/files/Science-20Western20Water1.pdf
“Water, water, everywhere,
And all the boards did shrink;
Water, water, everywhere,
Nor any drop to drink.”
– The Rime of the Ancient Mariner
Steve Goddard
February 2, 2010 6:28 am
Sharpshooter,
What you are missing is the tunnels which transfer huge amounts of water from west to east across the Continental Divide.
Steve Goddard
February 2, 2010 7:06 am
Symon,
It appears that Randy’s post bolsters my argument. What is it that you want me to respond to?
It would also appear that you are the person who doesn’t understand a phase diagram. Vostok at -89C is in the solid phase. http://www2.warwick.ac.uk/fac/sci/eng/cmd/research/civil/supercritical/phase_changes_of_co2.png
BTW – I must have missed it when the North Pole melted as forecast by the NSIDC director in 2008. Please remind me about that. And Walt Meier has apologized to me for his comments in The Register.
Hope this helps.
Just a fun web site: Lake Mead Water Level http://www.arachnoid.com/NaturalResources/
If the water level falls below 1050′, Las Vegas will be forced to close 1 of its 2 water intakes.
Bill Parsons
February 2, 2010 8:08 pm
rbroberg:
Your graph indicates that Lake Mead has never been more full than it was in 2000.
This 2003 NASA site also shows the lake’s drop using a roll-over comparator of the lake (2000 / 2003) http://earthobservatory.nasa.gov/Features/LakeMead/
Take a look at this Google satellite shot showing the Lake Mead in 2009. Compare it to the NASA view of 2000 The water level is clearly higher than it was in 2000. http://maps.google.com/maps?hl=en&tab=wl
Your point about water shortages in the West should be looked at carefully. You can’t sustain growing populations of people living in deserts like that on a fixed (and indeed diminishing) source of water like the Colorado River.
Bill Parsons
February 2, 2010 8:43 pm
Take a look at this Google satellite shot showing the Lake Mead in 2009.
Oops, the link doesn’t hold to scale. Just open Google Maps and zoom in to an approximate equal scale as NASA’s 2000 image. It’s pretty comparable, but you can see that the present level is more full by looking at the side canyons on the east side of the reservoir.
As I stated above, the dam can’t grow any bigger, and hydroelectric power is also finite. Its turbines were upgraded during the early ’90’s, but the total gross power rating for the plant, so Wiki tells us, is about 2080 megawatts.
Maybe you can find some population growth figures for that part of the U. S. Seems to me it’s been growing (Las Angeles, Las Vegas, Phoenix, etc.
Bill, I don’t see the dates for the images at any particular scale on the google map.
Take a look at Grand Wash Bay at this scale: http://tinyurl.com/yfo7mzq
Now move out a bit … like magic, the lake fills up.
The data on the chart I linked comes from here (as is explained on the web page) http://www.usbr.gov/lc/region/g4000/hourly/mead-elv.html
I see no reason to doubt it — unless you think that the US Bureau of Reclamation is up to shennigans! 😉
Looking past the colorful graphics at the top, I noticed:
National Drought Summary — January 26, 2010
…Early in the period, a series of Pacific storm systems pounded the Southwest with severe weather and near- to record amounts of precipitation, providing ample moisture for easing drought conditions but also triggering flash flooding and mudslides. A widespread 2 or more inches of precipitation fell on nearly all of California and most of Arizona, including the desert Southwest, with locally over 10 inches in northern California, the mountains of southern California, and in central Arizona. As the week ended, another Pacific system was dropping additional precipitation on California…
and much more wrt snowpack, reservoirs, and other measures of current levels of precipitation.
I’m sure you can find other indicators of drought, which seems to be your thesis. But hey, it’s the West, Ron. These states are subject to droughts periodically, and they may or may not last.
No question that the drought is easing some.
Will we recover out of drought conditions soon?
Will there be a ‘double dip’ without a solid recovery?
I dunno.
But it’s too soon to call this one over and done with.
Bill Parsons
February 4, 2010 8:39 am
Ron Broberg (00:30:52) :
Bill, I don’t see the dates for the images at any particular scale on the google map.
That’s my mistake. I made the assumption that the copyright date at the bottom of every Google Maps satellite image are the same as the date the photo was taken. I’m learning. These apparently are updated periodically, but not so often as I thought. Zooming in on my own house I noticed it was a nice fall day with the maple and aspen that I planted 15 years ago branched out as the would have appeared last year. Don’t know if / how often these satellite photos are updated.
Apparently Google Earth photos are dated, but no more current, so the most recent image of Lake Mead was 2005.
Leonard Weinstein
February 5, 2010 4:04 pm
Steve,
Whenever more molecules leave a surface than arrive, there will be NO net accumulation. There are always some molecules of any gas present that will hit a surface, and depending on the vapor pressure and partial pressure, this point of net accumulation or lack of one is decided. The magic values of -109 or -128 or any other than -220 are only going to result in accumulation if far higher partial pressures than 0.3 torr of CO2 are present. Please look in a handbook of Physics or Chemistry and read the definitions of partial pressure.
Leonard Weinstein
February 5, 2010 4:15 pm
Steve,
I see the later point you were trying to make. You are just arguing about the sublimation effect (gas to solid). However, CO2 becomes a solid at -72 degrees F, and there is nothing unusual from there on down. At all temperatures below -72, the exchange is gas to solid. However, if the partial pressure (0.3 torr) is considered, there will be NO solid present until -220 degrees F, as the molecules would leave at a faster rate than they can accumulate. The transition would be gas to solid, but for -128, nothing accumulates. Thus the very cold values anywhere on Earth cannot cause any frozen CO2 accumulation.
Steve Goddard
February 5, 2010 9:25 pm
Leonard,
Your assertion that there will be no solid present is incorrect. There is a continuous flux of molecules moving back and forth between the solid and gaseous state below the freezing point. Partial pressure is simply a function of the quantity of CO2 molecules in the air. If the partial pressure of CO2 is low, the probability of molecules moving to a solid state is reduced. Above the “dew point” of -220 degrees the number of molecules sublimating is as great as the number of molecules freezing so there is no accumulation. However, if you had an electron microscope you would see molecules continuously freezing and sublimating on the ground surface.
To an individual molecule, the concept of partial pressure is completely meaningless. It is just a statistical measure which affects the net movement/accumulation.
I went through a graduate program in geochemistry and worked for several years in a high temperature and pressure petrology lab where we studied solid/liquid/vapor transitions of many compounds extensively.
At any given time, there will be a certain number of frozen CO2 molecules present in the system. You are looking at this from a statistical point of view. I am looking at it from the micro-physical point of view.
Below the freezing point, things freeze. Don’t confuse the freezing point -(108F) with the “dew point” -220F , which is indeed the temperature where the dry ice accumulates.
jkalafus
February 8, 2010 5:17 am
Although the water level in Lake Powell has risen, this has been at the cost of the level in Lake Mead dropping. The result is that the total amount of water stored in the system has increased merely about 250K acre feet. It is this total that may reasonably be considered an approximate proxy for the winter snow pack. To make it more accurate you also need to include any changes to the total outflow from the system.
esin
February 8, 2010 7:42 am
He he, the CO2 tweets were entertaining, if but intuitively obvious ; ) fun nevertheless. Any questions on the subject matter? he, he, he!~
jkalafus,
well that clears that up, doesn’t it 🙂


Phil M,
The article mentions “lots and lots” of snow since 2005, and it also mentions a drought prior to that. Nevertheless, the long term trend in the Colorado Rockies has been towards increasing or at least steady snow over the last 100 years (with a very large year over year variability.)
Maybe I’m missing something, but the Plate and the Colorado are on opposite sides of the Continental divide. ??!
In the mountains northeast of Phoenix, the Salt River Project had to open the floodgates to prevent overflow of the various reservoirs that serve as the Central Arizona water sources.
One other interesting point is that for a few years (2002-2006 or so) it was often interesting that after torrential rains, the reported rainfall was something like a half inch. I know it’s anecdotal, but my wife and daughter got stuck at a drug store for four hours (August, 2003) taking cover from a rain storm that was purportedly 0.63 inches. Sky Harbor airport had to shut down for two hours due to the monsoon like rain.
Yeah, 0.63 inches my wet behind.
Mr Goddard,
1) Are you going to respond to the post from Randy (06:43:21)?
2) You say “Outflow (water usage) has greatly increased over the last few decades”. Have you downloaded the data from http://lakepowell.water-data.com/ to confirm this? Unlike reservoir level, which is more or less the integral of the inflow minus the outflow, picking a single day of the year back through the record is not sufficient to meaningfully chart outflow trends. Where is the data to back your increased outflow claim?
3) I gather you are the guy who wrote about CO2 condensation at the South Pole on this website without understanding a phase diagram, and apparently, from your comments, still believe in this phenomenon despite the experimental evidence presented in a subsequent article on this website. I wonder, are you the same Steven Goddard as the one that wrote this article?
http://www.theregister.co.uk/2008/08/15/goddard_arctic_ice_mystery/
The article where ice area was equated to unweighted pixels on a satellite image.
The article where Dr. Walt Meier said:-
“Besides this significant error, the rest of the article consists almost entirely of misleading, irrelevant, or erroneous information about Arctic sea ice that add nothing to the understanding of the significant long-term decline that is being observed.”
But the word “respectively” matches soybeans with biodiesel, supporting Kum rather than disproving her. (Excuse me if this dispute has been resolved and I didn’t notice.)
Sharpshooter,
Large amounts of water are transported from the western slope to the Front Range through several tunnels bored through the mountains.
http://www.ncwcd.org/project_features/cbt_main.asp
Steve Goddard (22:04:29) :
“The article mentions “lots and lots” of snow since 2005, and it also mentions a drought prior to that. Nevertheless, the long term trend in the Colorado Rockies has been towards increasing or at least steady snow over the last 100 years (with a very large year over year variability.)”
Again, in comparison to other studies, you present a minimal amount of evidence to support your claim. I kindly refer you to the follow peer-reviewed article. Ignore the sections inclusive of climate models if you wish, there are three graphs showing trends that dispute your claims. They present 50 years worth of SWE and temperature data for ~40 stations in the central Rockies, as well flow measurements for the Colorado River.
http://www.matr.net/files/Science-20Western20Water1.pdf
Steve Schaper,
I don’t think there is much question that growth of water usage in the west is unsustainable.
http://www.wired.com/science/planetearth/magazine/16-05/ff_peakwater?currentPage=all
Water is not destroyed, but …….
– The Rime of the Ancient Mariner
Sharpshooter,
What you are missing is the tunnels which transfer huge amounts of water from west to east across the Continental Divide.
Symon,
It appears that Randy’s post bolsters my argument. What is it that you want me to respond to?
It would also appear that you are the person who doesn’t understand a phase diagram. Vostok at -89C is in the solid phase.
http://www2.warwick.ac.uk/fac/sci/eng/cmd/research/civil/supercritical/phase_changes_of_co2.png
BTW – I must have missed it when the North Pole melted as forecast by the NSIDC director in 2008. Please remind me about that. And Walt Meier has apologized to me for his comments in The Register.
Hope this helps.
Just a fun web site: Lake Mead Water Level
http://www.arachnoid.com/NaturalResources/
If the water level falls below 1050′, Las Vegas will be forced to close 1 of its 2 water intakes.
rbroberg:
Your graph indicates that Lake Mead has never been more full than it was in 2000.
This 2003 NASA site also shows the lake’s drop using a roll-over comparator of the lake (2000 / 2003) http://earthobservatory.nasa.gov/Features/LakeMead/
Take a look at this Google satellite shot showing the Lake Mead in 2009. Compare it to the NASA view of 2000 The water level is clearly higher than it was in 2000.
http://maps.google.com/maps?hl=en&tab=wl
Your point about water shortages in the West should be looked at carefully. You can’t sustain growing populations of people living in deserts like that on a fixed (and indeed diminishing) source of water like the Colorado River.
Oops, the link doesn’t hold to scale. Just open Google Maps and zoom in to an approximate equal scale as NASA’s 2000 image. It’s pretty comparable, but you can see that the present level is more full by looking at the side canyons on the east side of the reservoir.
As I stated above, the dam can’t grow any bigger, and hydroelectric power is also finite. Its turbines were upgraded during the early ’90’s, but the total gross power rating for the plant, so Wiki tells us, is about 2080 megawatts.
Maybe you can find some population growth figures for that part of the U. S. Seems to me it’s been growing (Las Angeles, Las Vegas, Phoenix, etc.
Bill, I don’t see the dates for the images at any particular scale on the google map.
Take a look at Grand Wash Bay at this scale:
http://tinyurl.com/yfo7mzq
Now move out a bit … like magic, the lake fills up.
The data on the chart I linked comes from here (as is explained on the web page)
http://www.usbr.gov/lc/region/g4000/hourly/mead-elv.html
I see no reason to doubt it — unless you think that the US Bureau of Reclamation is up to shennigans! 😉
Oh. And I wasn’t posting Mead as a counter-point to Powell.
If you really want to get into what’s up in the Colorado River Basin, you have to read The Plan
http://www.usbr.gov/lc/region/programs/strategies.html
http://www.usbr.gov/lc/region/programs/strategies/documents.html
Here is the long term volume data at Powell.
http://www.usbr.gov/uc/crsp/DrawChart?c=1719&l=LAKE+POWELL&s=14-MAR-1963&e=2-FEB-2010&t=
You can get other upper river reservoirs here:
http://www.usbr.gov/uc/crsp/GetSiteInfo
and the lower colorado here under “historical data”
http://www.usbr.gov/lc/riverops.html
And the good ol’ US Drought Monitor
http://drought.unl.edu/dm/monitor.html
Didn’t have time to read all that you posted, but wrt:
Looking past the colorful graphics at the top, I noticed:
and much more wrt snowpack, reservoirs, and other measures of current levels of precipitation.
I’m sure you can find other indicators of drought, which seems to be your thesis. But hey, it’s the West, Ron. These states are subject to droughts periodically, and they may or may not last.
No question that the drought is easing some.
Will we recover out of drought conditions soon?
Will there be a ‘double dip’ without a solid recovery?
I dunno.
But it’s too soon to call this one over and done with.
That’s my mistake. I made the assumption that the copyright date at the bottom of every Google Maps satellite image are the same as the date the photo was taken. I’m learning. These apparently are updated periodically, but not so often as I thought. Zooming in on my own house I noticed it was a nice fall day with the maple and aspen that I planted 15 years ago branched out as the would have appeared last year. Don’t know if / how often these satellite photos are updated.
Apparently Google Earth photos are dated, but no more current, so the most recent image of Lake Mead was 2005.
Steve,
Whenever more molecules leave a surface than arrive, there will be NO net accumulation. There are always some molecules of any gas present that will hit a surface, and depending on the vapor pressure and partial pressure, this point of net accumulation or lack of one is decided. The magic values of -109 or -128 or any other than -220 are only going to result in accumulation if far higher partial pressures than 0.3 torr of CO2 are present. Please look in a handbook of Physics or Chemistry and read the definitions of partial pressure.
Steve,
I see the later point you were trying to make. You are just arguing about the sublimation effect (gas to solid). However, CO2 becomes a solid at -72 degrees F, and there is nothing unusual from there on down. At all temperatures below -72, the exchange is gas to solid. However, if the partial pressure (0.3 torr) is considered, there will be NO solid present until -220 degrees F, as the molecules would leave at a faster rate than they can accumulate. The transition would be gas to solid, but for -128, nothing accumulates. Thus the very cold values anywhere on Earth cannot cause any frozen CO2 accumulation.
Leonard,
Your assertion that there will be no solid present is incorrect. There is a continuous flux of molecules moving back and forth between the solid and gaseous state below the freezing point. Partial pressure is simply a function of the quantity of CO2 molecules in the air. If the partial pressure of CO2 is low, the probability of molecules moving to a solid state is reduced. Above the “dew point” of -220 degrees the number of molecules sublimating is as great as the number of molecules freezing so there is no accumulation. However, if you had an electron microscope you would see molecules continuously freezing and sublimating on the ground surface.
To an individual molecule, the concept of partial pressure is completely meaningless. It is just a statistical measure which affects the net movement/accumulation.
I went through a graduate program in geochemistry and worked for several years in a high temperature and pressure petrology lab where we studied solid/liquid/vapor transitions of many compounds extensively.
At any given time, there will be a certain number of frozen CO2 molecules present in the system. You are looking at this from a statistical point of view. I am looking at it from the micro-physical point of view.
Below the freezing point, things freeze. Don’t confuse the freezing point -(108F) with the “dew point” -220F , which is indeed the temperature where the dry ice accumulates.
Although the water level in Lake Powell has risen, this has been at the cost of the level in Lake Mead dropping. The result is that the total amount of water stored in the system has increased merely about 250K acre feet. It is this total that may reasonably be considered an approximate proxy for the winter snow pack. To make it more accurate you also need to include any changes to the total outflow from the system.
He he, the CO2 tweets were entertaining, if but intuitively obvious ; ) fun nevertheless. Any questions on the subject matter? he, he, he!~
jkalafus,
well that clears that up, doesn’t it 🙂