In Debunking National Wildlife Federation Claims – Part 2 some commenters claimed that the snow data cited from WRI “was not good enough”. OK then, on to a bigger catchment. Steve Goddard replies in this brief essay.
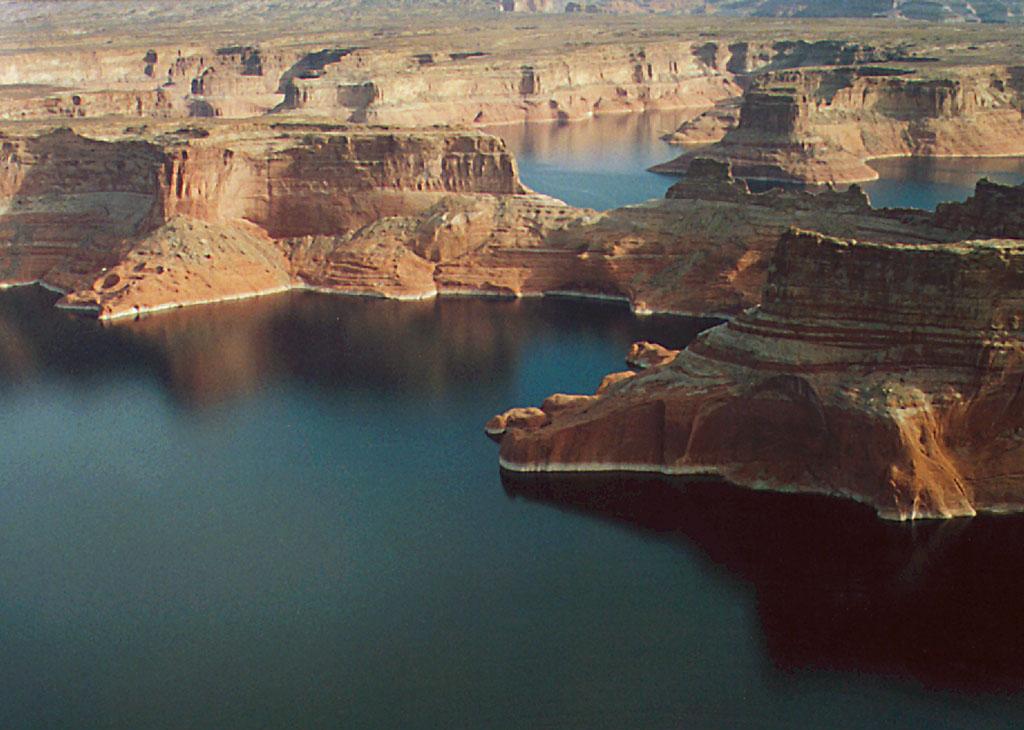
From Wikimedia: Lake Powell from above Wahweap Marina. July 2004, by Dave Jenkins
Lake Powell (Arizona and Utah) provides a good proxy for western slope snowfall, because much of the snow in Wyoming, Colorado, Utah and Northwestern New Mexico drains into the lake via the Colorado, Green and San Juan Rivers. The lake currently contains more than 4.5 trillion gallons of water and is 490 feet deep at the dam.
Between 2000 and 2005, drought conditions (combined with greatly increased water usage in Arizona, California, Nevada and Colorado) caused Lake Powell levels to drop nearly 120 feet. This prompted a considerable consensus of global warming hysteria.
Every scientific study confirms that global warming will cause the amount of water in the Colorado River to decline
But a strange thing happened in 2006 – the lake level stopped declining and instead started increasing rapidly. As you can see in the table below from lakepowell.water-data.com, since 2005 the lake elevation has increased by more than 60 feet above the 2005 low of 3562 ft. As of January 29, at 3622 ft. the lake is within three feet of the January 29 average of 3625 feet elevation. The volume of water in the lake has increased by 65% in the last five years to 4.5 trillion gallons. (At movie theater prices for bottled water, that could almost erase the US National Debt.)
The yearly change in volume is determined by the formula :
delta H = inflow – outflow – evaporation – seepage
Evaporation is relatively constant from year to year as is seepage, so the formula can be written as:
delta H = inflow – outflow – K
Outflow (water usage) has greatly increased over the last few decades due to massive population increases in Phoenix, Las Vegas and Southern California – not to mention the large and ever increasing amount of water being used by the biofuels industry. (It has been estimated by the University of Twente in The Netherlands that the manufacture of one liter of biodiesel requires 14,000 liters of water).
The point being that despite large increases in outflow, the lake level has been rapidly recovering. This could be due to only one explanation – lots and lots of snow in the Rocky Mountains during the last five years.
And an extra bonus from the “weather is not climate” department – January 29, 2010 at 39.9 degrees was ten degrees below normal and the second coldest on record.
Lake Powell (Arizonaand Utah) providesa good proxy for westernslope snowfall,because much of the snow in Wyoming,Colorado,Utah and NorthwesternNew Mexicodrainsinto the lake via the Colorado,Green and San Juan Rivers. The lake currentlycontainsmore than 4.5 trilliongallonsof water and is 490 feet deep at the dam.
Re Steve Goddard (05:42:02) :
Same with lots of corn in Calif, although I do think this is a major distraction from the main point of what you were writing.
randy
February 1, 2010 6:43 am
being more than familiar with the operation of lake powell (25 + years of forecasting inflow) there are things about the lake you have neglected. let us for a moment, consider the inflow as opposed to the outflow. above lake powell, there has been considerable developement as well. on the utah side, there are 485 diversions, ditches, canals and other water rights, many developed since the 1950’s. there are 2,220 lakes, ponds, impoundments. on the colorado side, there are approximately 33,000 diversions, 11,000 lakes, ponds and impoundments assoicated witha water right as well as 7,000 wells which take water eventually recharged by surface water. in the so called adjusted lake powell inflow data (observed usgs flow adjusted for upstream use – the data set most often used by researchers as the official lake powell inflow data) the data are adjusted for 18 major reservoirs and 16 major diversions. i suggest that the inflow over the past 50 years has significantly changed with much greater use above the reservoir. just look at 2 to 3 feet of evapporation off of these reservoirs and ponds – many of which were developed subsequent to lake powell. look at bank storage and the impact on the hydrograph. there are many more reasons why inflow to the reservoir has systematically declined: aspen to conifer conversion, a total of 2.5 million acres in colorado and utah. aspen lands have much greater water yield than conifers, in one study, aspens had 34% more snow and nearly 4.5 inches more soil moisture than conifers. what this means is by losing that amount of aspen land to conifer, average annual inflow to the lake would decrease by 2.5% to nearly 11%. now take grazing – in the late 1800’s, there were about 4 million cows and 5 million sheep in the western states – by 1900, there were nearly 20 million cows and 25 million sheep. the devastation was enormous until the 1930’s with the taylor grazing act. denuded watersheds had huge hydrologic changes – constant flooding, mud and debris flows – an increase in hydrologic response – we pre-loaded the hydrology in the early century by grazing. also by logging – we logged the heck out of the area to build railroads and settlements. fewer trees, more water, again preloading the early record. come the 1960’s and 70’s with the environmental movement, huge changes to watershed management. drastically curtailed logging, now we have as many as 200 trees per acre as opposed to maby 20 to 30 early on. more trees equals less water. see the bias here – for 100 years we did everything possible to increase water yield on western watersheds and then for the last 40, everything possible to decrease flows. lets not stop there – fire. early century, fires in the west would consume between 10 and 30 million acres. with smokey bear, now we have between 2 and 5 million acres annually. more tree=less water. on a huge scale. fraser watershed expirements in colorado, with a 40% tree harvest increased streamflow by nearly 50% as i recall (would have to look up exact figures) and the increase lasted 20 years before decline and was still evident after 30 to 40 years. pretty impressive. we are not done yet, irrigation practices have changed from flood to sprinkler on a large scale. with flood irrigation, water was put on the field, suplus water ran off and much percolated and provided subsurface return to the stream. with sprinklers, almost all is consumptively used, more accurate amounts, but virtually no return to stream.
people think they know what is going on at lake powell – i am convinced we dont have a clue what a true adjusted inflow to the lake really is, moreover, i am convinced that it is systematically lower that what we calculate due to many of the above referenced items and that the historical record is biased as well making meaningful comparisons impossible.
David
February 1, 2010 6:46 am
One thing I would have liked to see in the report is what level the lake would currently be if for example (pick a time period) the water drawn from 2005 – 2009 had been the same as from 1990 – 1994. How much effect has the increase in use had on lake levels?
David
February 1, 2010 6:51 am
Another study on how much more water would have been required from the lake, if we wanted to grow the same amount of agriculture, and we had only 280 PPM CO2 verses the 380PPM CO2 we now have. The extra 100 PPM CO2 saved a lot of water and land to get the same crop yield. Water was also saved in resedential lawns, golf courses etc. I wander of these savings were reflected in any IPCC reports?
feet2fire 2:59:03-“you all think I’m nuts…”
Nah..we know.Lol
Steve Goddard
February 1, 2010 7:40 am
Symon,
Do you have a theory which proposes that substances no longer freeze when below their freezing point? I’ll be interested to hear about it.
Steve Goddard
February 1, 2010 7:42 am
Ken,
A good indicator of Green River flooding is the Salt Cedar. During dry years it takes over the sand bars, but floods in wet years clear things out and produce new sand bars. Makes a huge difference when you are camping.
John Galt
February 1, 2010 8:13 am
Further down river, Lake Mead has a similar story.
Steve Keohane
February 1, 2010 8:32 am
Kum Dollison (22:02:57) : I’m assuming that the Co corn that is irrigated is irrigated from groundwater, not snow melt water.
Kum, where do you think the ground water in Colorado comes from? Answer is snow! Do you realize the rivers and streams here are often just surface symptoms of greater flow beneath the surface that comes from, snow? People don’t realize the whole Front Range, i.e. east of the Rockies, was sparse sagebrush, a few barrel and pear cactus, and cottonwood trees along rivers. It took damming the the flow on the eastern slope into reservoirs, piping water from the western slope where <3% of the state's population resides, to support the population and agriculture in the east. The western part of the state is much wetter than the east with many orchards and now wine grapes.
A C Osborn
February 1, 2010 8:43 am
Steve, do you know how much precipitation in that area is Rain and how much is Snow?
Steve Goddard
February 1, 2010 9:03 am
A C,
In the mountains the vast majority of precipitation is snow, because it is too cold to rain for 8-9 months a year. At lower elevations, precipitation is dominated by summer rains which have very little effect on reservoir storage. Mountain snow is the dominant control.
Russtovich
February 1, 2010 9:20 am
It wouldn’t surprise me for the “true believers” (as opposed to us “deniers” 🙂 ) to state that since the water level in the lake is rising it must be due to glaciers in the mountains melting, and hence… global warming! 🙂
Bill White
February 1, 2010 9:34 am
Steve G,
Your point about water recovery in the Lower Colorado is on target, but your added comment about biodiesel is incorrect, and your confounding of biodiesel and biofuels (a larger category dominated by ethanol) has added a lot of confusion.
As Kum attempted to point out, biodiesel in the U.S. is made almost exclusively from soybeans – the soybean growing areas of the U.S., mostly in the Mississippi watershed, are not experiencing water shortages. Furthermore, it takes almost no water to manufacture biodiesel – in fact, a small amount of water will kill the inter-esterification reaction.
As for the claim in the Dutch article, perhaps you might look into its accuracy and fairness before citing it in future essays. As an alternative, you could amend your initial post to use the word ‘biofuels’. There is no question that ethanol production uses a lot of water – for fermentation, steam generation, cooling, etc.
bikermailman
February 1, 2010 9:35 am
Ken S (06:11:38) :
Just speaking for myself, the land alone would be worth that price. Build some small levees, you’re good to go.
Randy, good comment. Good reminder that just as the global climate, things are far more complex than just a quick eyeballing can give you.
towgod
February 1, 2010 9:43 am
It seems to me that you guys have way too much time on your hands to be sitting in front of the computer and typing in all this bull! If you guys really want to do something about it you’d be going to the proper site provided by state parks in your area. Basically what I see is you guys talking to one another and not getting anything done! The problem is not going to get any better why, because more and more construction in Las Vegas Southern California and especially Phoenix will continue to go on, why will the problem has to do with immigration more and more immigrants across the border and guess what they need places to live and unfortunately they drink water, shower and all the parks that their kids go to have to have water to water the grass. The problem is never going to end there can be huge snowpack in the Rockies and this will fill the reservoirs and it will happen again the fact is there is nothing we can do about it and that’s a fact why have you ever heard the term lets cut off your leg to save your foot? This is what needs to be done. Immigration, our borders need to be closed and we can properly manage our water levels after all it’s our water we give Mexico enough water in fact we give them so much water that they have developed the new River and what do they use the new River for? They throw all their trash all their polluted runoff and septic tank waste into the river and on top of that they float down the river into our country! This new River flows into the Salton Sea and when these illegals use the river flow to cross into our country the border patrol can do nothing about it because the water is so polluted that can do nothing but watch as these people cross into our country well I guess I said enough let’s see some comments
Leonard Weinstein
February 1, 2010 10:35 am
Steve Goddard (5:37:15),
The freezing point of CO2 is -72 degrees F. However the vapor pressure, even over the solid CO2, is temperature dependent. If the vapor pressure of a layer of CO2 at the surrounding temperature was higher than the ambient PARTIAL PRESSURE of CO2, the CO2 would continually sublime. This would result in a continual loss of mass until it is all gone. Atmospheric pressure is 760 torr, so if this pressure were all due to CO2, the equilibrium temperature (where CO2 would stay in place) would be -109 degrees F as you stated. However, the actual CO2 partial pressure is only 0.3 torr. At this partial pressure, the equilibrium temperature would have to be about -220 degrees F. Since the coldest place on Earth is only -128 degrees F, the CO2 would not freeze out, and NONE would accumulate.
Leonard Weinstein:
Exactly…!
Which is why ice (from water) disappears on below-freezing days, and the very cold air continues to have some water vapor content. Even when that air is below 32 degrees F (0 deg C).
Gail Combs
February 1, 2010 11:13 am
Kum Dollison (22:02:57) : “Steve, you made reference to Biodiesel. Biodiesel, in the U.S., is made from waste veg grease, or Soybeans, Not Corn…”
You are incorrect because your information is old. Straight from the USDA: “USDA closely monitors markets for many commodities, including corn and soybeans—important feedstocks for ethanol and biodiesel, respectively. Below is a collection of data sources on production, consumption, prices, and trade in feedstocks, coproducts, and the biofuels themselves. Please note that, currently, cellulosic ethanol is not yet widely manufactured or commercially available in the United States. Therefore, only grain ethanol data are presented here….”http://www.ers.usda.gov/briefing/bioenergy/biofueldata.htm
This is why there were food riots in third world countries in 2008 and Monsanto and Cargill had record earnings. http://www.sourcewatch.org/index.php?title=Monsanto_and_the_World_Food_Crisis
Gail Combs
February 1, 2010 11:28 am
Kum Dollison (22:53:58) : “…..in 2009 we planted 86 million acres and produced 13.2 Billion bushels. An all-time record yield of 165 bu/acre. In spite of one of the most horrendous growing seasons on record.”
Again you leave out the most significant part. It was “poor quality” corn and not of use as feed or biofuel stock as I noted in another post. ” …A bumper crop of poor quality corn is not the mark of a reliable food system; nor is one that requires tremendous amounts of propane in order to become dry enough to store. In some areas farmers are adding $75-100/acre to their cost of production, just to dry down their corn. That’s simply not sustainable in terms of natural resources or individual farm economics. If we look at this season with a lens broader than sheer yield, the story is far more complex–and ultimately less rosy. “http://www.chewswise.com/chews/2009/11/turkey-on-the-combine.html
Poor quality corn is unsutible for biofuel because the bacteria and toxins intefere with the yeast in fermentation.
Duncan
February 1, 2010 11:31 am
“Evaporation is relatively constant from year to year”
I’m surprised to read that.
Lake Powell is funnel-shaped, so the surface area increases dramatically as the level of the lake rises. I was under the impression that evaporation was much lower back in 2005 because the surface area had shrunk so much.
I would have expected evaporation to increase significantly since then.
Kum Dollison
February 1, 2010 11:43 am
Gail, I don’t know from your link why you think I’m wrong, but I’m not. The only exceptions are a couple of ethanol refineries separate out the “crude” corn oil and sell it to biodiesel production. A very small amount, overall. Also, on the W. Coast they were “splash, and dashing” (buying palm oil from Asia, adding some diesel *for the Tax Credit* and shipping it to Europe.) I think the Euros have pretty much put the kibosh on that.
The food demonstrations had a lot of causes, but ethanol in the U.S. had absolutely NOTHING to do with any of them.
Steve, I still don’t know what agriculture on the S. Platte River has to do with snow melt on the Colorado.
Kum Dollison
February 1, 2010 11:51 am
Gail, that’s total nonsense. The USDA takes water content into consideration when rating a crop. Also, you might not be aware that ethanol refineries were taking corn up to 23% waterweight. That corn did not have to be dried.
As far as the quality of the crop it was just fine.
By the way, you may not be aware that, due to the amount of corn, and soybean meal the DDGS replace, even the most ardent ethanol critics now admit that you get back at least 60% of your livestock feeding ability in the DDGS.
This is evidenced by the fact that corn is selling for $3.58/bu (a touch over $0.06/lb) this morning on the CBOT.
Gail Combs
February 1, 2010 11:55 am
Symon (02:48:42) : “I think Kum has a valid point. You can’t talk about ‘biofuels’ and then quote a statistic about a biofuel which isn’t produced in the area under discussion.
As for advising someone to “research”, it’s a shame you didn’t do that with your infamous CO2-freezing-out-of-the-air-article. In that missive, it was a throwaway comment that created the rumpus, as it seems to be with this essay. Why not stay on subject, and avoid detracting attention from the point you are trying to make?”
I wish that was true. As I said I covered this issue in an earlier WUWT. The effects are not local. The bio-fuel use of corn and soybeans here in the USA caused farmers to plant more corn and soybeans, Monsanto to raise their prices for seed and Cargill, the grain trader, to raise theirs. Within the last couple years the cost of feed tripled in the USA and third world countries had food riots.
If a farmer can get more per acre planting corn than that is what he will plant. The veggies he might have planted and sold locally he does not and they get shipped in from elsewhere. One of the worse problems is corn is very hard on the land. It requires a lot of fertilizer and causes a lot of run off/soil erosion.
Also Texas and Colorado are two of the top 18 corn producing states in the USA. “Total unharvested corn production for the top 18 states is projected to be 630.4 million bushels, equaling 4.8% of USDA’s 2009 U.S. corn production projection of 13.151 billion bushels on January 12, 2010.”http://www.smallgrains.org/article.aspx?id=8778
Steve Goddard
February 1, 2010 12:17 pm
Leonard,
When the partial pressure of a gas equals atmospheric pressure, that is the boiling point, not the freezing point. http://en.wikipedia.org/wiki/Boiling_point
“The boiling point of an element or a substance is the temperature at which the vapor pressure of the liquid equals the environmental pressure surrounding the liquid.”
David Porter
February 1, 2010 12:53 pm
Symon (06:06:07) :
Nasty piece of work aren’t you Simon.


Re Steve Goddard (05:42:02) :
Same with lots of corn in Calif, although I do think this is a major distraction from the main point of what you were writing.
being more than familiar with the operation of lake powell (25 + years of forecasting inflow) there are things about the lake you have neglected. let us for a moment, consider the inflow as opposed to the outflow. above lake powell, there has been considerable developement as well. on the utah side, there are 485 diversions, ditches, canals and other water rights, many developed since the 1950’s. there are 2,220 lakes, ponds, impoundments. on the colorado side, there are approximately 33,000 diversions, 11,000 lakes, ponds and impoundments assoicated witha water right as well as 7,000 wells which take water eventually recharged by surface water. in the so called adjusted lake powell inflow data (observed usgs flow adjusted for upstream use – the data set most often used by researchers as the official lake powell inflow data) the data are adjusted for 18 major reservoirs and 16 major diversions. i suggest that the inflow over the past 50 years has significantly changed with much greater use above the reservoir. just look at 2 to 3 feet of evapporation off of these reservoirs and ponds – many of which were developed subsequent to lake powell. look at bank storage and the impact on the hydrograph. there are many more reasons why inflow to the reservoir has systematically declined: aspen to conifer conversion, a total of 2.5 million acres in colorado and utah. aspen lands have much greater water yield than conifers, in one study, aspens had 34% more snow and nearly 4.5 inches more soil moisture than conifers. what this means is by losing that amount of aspen land to conifer, average annual inflow to the lake would decrease by 2.5% to nearly 11%. now take grazing – in the late 1800’s, there were about 4 million cows and 5 million sheep in the western states – by 1900, there were nearly 20 million cows and 25 million sheep. the devastation was enormous until the 1930’s with the taylor grazing act. denuded watersheds had huge hydrologic changes – constant flooding, mud and debris flows – an increase in hydrologic response – we pre-loaded the hydrology in the early century by grazing. also by logging – we logged the heck out of the area to build railroads and settlements. fewer trees, more water, again preloading the early record. come the 1960’s and 70’s with the environmental movement, huge changes to watershed management. drastically curtailed logging, now we have as many as 200 trees per acre as opposed to maby 20 to 30 early on. more trees equals less water. see the bias here – for 100 years we did everything possible to increase water yield on western watersheds and then for the last 40, everything possible to decrease flows. lets not stop there – fire. early century, fires in the west would consume between 10 and 30 million acres. with smokey bear, now we have between 2 and 5 million acres annually. more tree=less water. on a huge scale. fraser watershed expirements in colorado, with a 40% tree harvest increased streamflow by nearly 50% as i recall (would have to look up exact figures) and the increase lasted 20 years before decline and was still evident after 30 to 40 years. pretty impressive. we are not done yet, irrigation practices have changed from flood to sprinkler on a large scale. with flood irrigation, water was put on the field, suplus water ran off and much percolated and provided subsurface return to the stream. with sprinklers, almost all is consumptively used, more accurate amounts, but virtually no return to stream.
people think they know what is going on at lake powell – i am convinced we dont have a clue what a true adjusted inflow to the lake really is, moreover, i am convinced that it is systematically lower that what we calculate due to many of the above referenced items and that the historical record is biased as well making meaningful comparisons impossible.
One thing I would have liked to see in the report is what level the lake would currently be if for example (pick a time period) the water drawn from 2005 – 2009 had been the same as from 1990 – 1994. How much effect has the increase in use had on lake levels?
Another study on how much more water would have been required from the lake, if we wanted to grow the same amount of agriculture, and we had only 280 PPM CO2 verses the 380PPM CO2 we now have. The extra 100 PPM CO2 saved a lot of water and land to get the same crop yield. Water was also saved in resedential lawns, golf courses etc. I wander of these savings were reflected in any IPCC reports?
feet2fire 2:59:03-“you all think I’m nuts…”
Nah..we know.Lol
Symon,
Do you have a theory which proposes that substances no longer freeze when below their freezing point? I’ll be interested to hear about it.
Ken,
A good indicator of Green River flooding is the Salt Cedar. During dry years it takes over the sand bars, but floods in wet years clear things out and produce new sand bars. Makes a huge difference when you are camping.
Further down river, Lake Mead has a similar story.
Kum Dollison (22:02:57) : I’m assuming that the Co corn that is irrigated is irrigated from groundwater, not snow melt water.
Kum, where do you think the ground water in Colorado comes from? Answer is snow! Do you realize the rivers and streams here are often just surface symptoms of greater flow beneath the surface that comes from, snow? People don’t realize the whole Front Range, i.e. east of the Rockies, was sparse sagebrush, a few barrel and pear cactus, and cottonwood trees along rivers. It took damming the the flow on the eastern slope into reservoirs, piping water from the western slope where <3% of the state's population resides, to support the population and agriculture in the east. The western part of the state is much wetter than the east with many orchards and now wine grapes.
Steve, do you know how much precipitation in that area is Rain and how much is Snow?
A C,
In the mountains the vast majority of precipitation is snow, because it is too cold to rain for 8-9 months a year. At lower elevations, precipitation is dominated by summer rains which have very little effect on reservoir storage. Mountain snow is the dominant control.
It wouldn’t surprise me for the “true believers” (as opposed to us “deniers” 🙂 ) to state that since the water level in the lake is rising it must be due to glaciers in the mountains melting, and hence… global warming! 🙂
Steve G,
Your point about water recovery in the Lower Colorado is on target, but your added comment about biodiesel is incorrect, and your confounding of biodiesel and biofuels (a larger category dominated by ethanol) has added a lot of confusion.
As Kum attempted to point out, biodiesel in the U.S. is made almost exclusively from soybeans – the soybean growing areas of the U.S., mostly in the Mississippi watershed, are not experiencing water shortages. Furthermore, it takes almost no water to manufacture biodiesel – in fact, a small amount of water will kill the inter-esterification reaction.
As for the claim in the Dutch article, perhaps you might look into its accuracy and fairness before citing it in future essays. As an alternative, you could amend your initial post to use the word ‘biofuels’. There is no question that ethanol production uses a lot of water – for fermentation, steam generation, cooling, etc.
Ken S (06:11:38) :
Just speaking for myself, the land alone would be worth that price. Build some small levees, you’re good to go.
Randy, good comment. Good reminder that just as the global climate, things are far more complex than just a quick eyeballing can give you.
It seems to me that you guys have way too much time on your hands to be sitting in front of the computer and typing in all this bull! If you guys really want to do something about it you’d be going to the proper site provided by state parks in your area. Basically what I see is you guys talking to one another and not getting anything done! The problem is not going to get any better why, because more and more construction in Las Vegas Southern California and especially Phoenix will continue to go on, why will the problem has to do with immigration more and more immigrants across the border and guess what they need places to live and unfortunately they drink water, shower and all the parks that their kids go to have to have water to water the grass. The problem is never going to end there can be huge snowpack in the Rockies and this will fill the reservoirs and it will happen again the fact is there is nothing we can do about it and that’s a fact why have you ever heard the term lets cut off your leg to save your foot? This is what needs to be done. Immigration, our borders need to be closed and we can properly manage our water levels after all it’s our water we give Mexico enough water in fact we give them so much water that they have developed the new River and what do they use the new River for? They throw all their trash all their polluted runoff and septic tank waste into the river and on top of that they float down the river into our country! This new River flows into the Salton Sea and when these illegals use the river flow to cross into our country the border patrol can do nothing about it because the water is so polluted that can do nothing but watch as these people cross into our country well I guess I said enough let’s see some comments
Steve Goddard (5:37:15),
The freezing point of CO2 is -72 degrees F. However the vapor pressure, even over the solid CO2, is temperature dependent. If the vapor pressure of a layer of CO2 at the surrounding temperature was higher than the ambient PARTIAL PRESSURE of CO2, the CO2 would continually sublime. This would result in a continual loss of mass until it is all gone. Atmospheric pressure is 760 torr, so if this pressure were all due to CO2, the equilibrium temperature (where CO2 would stay in place) would be -109 degrees F as you stated. However, the actual CO2 partial pressure is only 0.3 torr. At this partial pressure, the equilibrium temperature would have to be about -220 degrees F. Since the coldest place on Earth is only -128 degrees F, the CO2 would not freeze out, and NONE would accumulate.
Leonard Weinstein:
Exactly…!
Which is why ice (from water) disappears on below-freezing days, and the very cold air continues to have some water vapor content. Even when that air is below 32 degrees F (0 deg C).
Kum Dollison (22:02:57) :
“Steve, you made reference to Biodiesel. Biodiesel, in the U.S., is made from waste veg grease, or Soybeans, Not Corn…”
You are incorrect because your information is old. Straight from the USDA:
“USDA closely monitors markets for many commodities, including corn and soybeans—important feedstocks for ethanol and biodiesel, respectively. Below is a collection of data sources on production, consumption, prices, and trade in feedstocks, coproducts, and the biofuels themselves. Please note that, currently, cellulosic ethanol is not yet widely manufactured or commercially available in the United States. Therefore, only grain ethanol data are presented here….” http://www.ers.usda.gov/briefing/bioenergy/biofueldata.htm
This is why there were food riots in third world countries in 2008 and Monsanto and Cargill had record earnings. http://www.sourcewatch.org/index.php?title=Monsanto_and_the_World_Food_Crisis
Kum Dollison (22:53:58) :
“…..in 2009 we planted 86 million acres and produced 13.2 Billion bushels. An all-time record yield of 165 bu/acre. In spite of one of the most horrendous growing seasons on record.”
Again you leave out the most significant part. It was “poor quality” corn and not of use as feed or biofuel stock as I noted in another post.
” …A bumper crop of poor quality corn is not the mark of a reliable food system; nor is one that requires tremendous amounts of propane in order to become dry enough to store. In some areas farmers are adding $75-100/acre to their cost of production, just to dry down their corn. That’s simply not sustainable in terms of natural resources or individual farm economics. If we look at this season with a lens broader than sheer yield, the story is far more complex–and ultimately less rosy. “ http://www.chewswise.com/chews/2009/11/turkey-on-the-combine.html
Poor quality corn is unsutible for biofuel because the bacteria and toxins intefere with the yeast in fermentation.
“Evaporation is relatively constant from year to year”
I’m surprised to read that.
Lake Powell is funnel-shaped, so the surface area increases dramatically as the level of the lake rises. I was under the impression that evaporation was much lower back in 2005 because the surface area had shrunk so much.
I would have expected evaporation to increase significantly since then.
Gail, I don’t know from your link why you think I’m wrong, but I’m not. The only exceptions are a couple of ethanol refineries separate out the “crude” corn oil and sell it to biodiesel production. A very small amount, overall. Also, on the W. Coast they were “splash, and dashing” (buying palm oil from Asia, adding some diesel *for the Tax Credit* and shipping it to Europe.) I think the Euros have pretty much put the kibosh on that.
The food demonstrations had a lot of causes, but ethanol in the U.S. had absolutely NOTHING to do with any of them.
Steve, I still don’t know what agriculture on the S. Platte River has to do with snow melt on the Colorado.
Gail, that’s total nonsense. The USDA takes water content into consideration when rating a crop. Also, you might not be aware that ethanol refineries were taking corn up to 23% waterweight. That corn did not have to be dried.
As far as the quality of the crop it was just fine.
By the way, you may not be aware that, due to the amount of corn, and soybean meal the DDGS replace, even the most ardent ethanol critics now admit that you get back at least 60% of your livestock feeding ability in the DDGS.
This is evidenced by the fact that corn is selling for $3.58/bu (a touch over $0.06/lb) this morning on the CBOT.
Symon (02:48:42) :
“I think Kum has a valid point. You can’t talk about ‘biofuels’ and then quote a statistic about a biofuel which isn’t produced in the area under discussion.
As for advising someone to “research”, it’s a shame you didn’t do that with your infamous CO2-freezing-out-of-the-air-article. In that missive, it was a throwaway comment that created the rumpus, as it seems to be with this essay. Why not stay on subject, and avoid detracting attention from the point you are trying to make?”
I wish that was true. As I said I covered this issue in an earlier WUWT. The effects are not local. The bio-fuel use of corn and soybeans here in the USA caused farmers to plant more corn and soybeans, Monsanto to raise their prices for seed and Cargill, the grain trader, to raise theirs. Within the last couple years the cost of feed tripled in the USA and third world countries had food riots.
If a farmer can get more per acre planting corn than that is what he will plant. The veggies he might have planted and sold locally he does not and they get shipped in from elsewhere. One of the worse problems is corn is very hard on the land. It requires a lot of fertilizer and causes a lot of run off/soil erosion.
Also Texas and Colorado are two of the top 18 corn producing states in the USA. “Total unharvested corn production for the top 18 states is projected to be 630.4 million bushels, equaling 4.8% of USDA’s 2009 U.S. corn production projection of 13.151 billion bushels on January 12, 2010.” http://www.smallgrains.org/article.aspx?id=8778
Leonard,
When the partial pressure of a gas equals atmospheric pressure, that is the boiling point, not the freezing point.
http://en.wikipedia.org/wiki/Boiling_point
“The boiling point of an element or a substance is the temperature at which the vapor pressure of the liquid equals the environmental pressure surrounding the liquid.”
Symon (06:06:07) :
Nasty piece of work aren’t you Simon.