UPDATE: Easy come, easy go, the sharp decline has popped back up to near normal in the space of a couple days. See the end of the story for update.
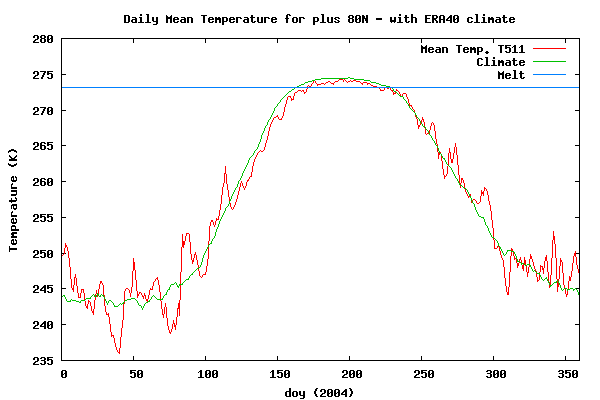
According to the Danish Meteorological Institute, Arctic temperatures are currently below 238K (-35.15 degrees Celsius or -31.27 degrees Fahrenheit)
That is more than five degrees below normal (the green line) and the lowest reading since 2004. The slope of decline has also recently been quite sharp, dropping from 252K on January 1, a drop of 14 degrees in 22 days.

Source: http://ocean.dmi.dk/arctic/plots/meanTarchive/meanT_2010.png
For an interactive view, showing historical data see:
http://ocean.dmi.dk/arctic/meant80n.uk.php
The last time temperatures were this low in the Arctic was in February, 2004, where the 80N temperature reached 236K.

Source: http://ocean.dmi.dk/arctic/plots/meanTarchive/meanT_2004.png
In other news, temperatures in both the Arctic and Antarctic are well below normal.

Source: http://www.esrl.noaa.gov/psd/map/ANIM/sfctmpmer_01a.fnl.30.gif
h/t to Steve Goddard
UPDATE: Quick rebound from the coldest temperature since 2004, will it oscillate back?

It’s weather; not climate. Move on. Nothing to see here 😉
Now we check Hansen’s maps for the real truth…
But what about the UAH satellite? Still way above 20 year record territory.
yes, this morning I was looking at this, however still few years, isn’t it?
1992-1994-2004, …
and moreover there are sharpest moments in previous years.
no conclusions by now, I think.
Seems like the cold we had in the middle lattitudes has retreated back to Arctic.
US, Siberia and southern Canada aren’t as cold as they were a couple a weeks ago.
Arctic ice coverage looks normal..
http://www.ijis.iarc.uaf.edu/en/home/seaice_extent.htm
The real test this year, will to be see what the summer ice minimum is !!
Remarkable indeed (along with the generally cold NH winter) in a year with perihelion on Jan 7.
Funnily enough I was looking at the last few years of these graphs just today. 2007 was the same as every other year in the decade. Doesn’t that kinda prove that it was nothing to do with any kind of warming?
Sorry O/T. Battery problem doesn’t stop declaration of proof of rapid melting in the arctic! http://www.telegraph.co.uk/earth/earthnews/7053637/Pen-Hadow-admits-battery-was-the-problem-on-Arctic-climate-change-expedition.html
Remember the “Watts effect”? You posted about this site last year (late spring?), when it had been hovering around 273 (freezing/melting) as the cause for arctic ice recovering almost to normal. Boom; within a day or two, the trace moved up to the green line, and ice melt resumed.
I wouldn’t get too worked up about a short up or down spike. It’s a global shell game (not meant to be derisive). If the colder air floods south and freezes Chicago and all the way down to Florida, plus Europe and China, then warmer air moves into the polar regions. When the cold air returns north, the polar area cools off, but the temperate zones warm up to normal levels.
Interesting that ice cover extent slowed down despite the cold. Probably the ice is being compacted by winds. This generates thick ice and open water, exposed to severe cold, will freeze very quickly as soon as winds stop. We are on a good way to see summer minimum above 2007, 2008 and 2009.
And the green, “normal” line is a 50 year average, from 1958 to 2008.
At the same time the European arctic has been very warm. The weather this winter has pushed cold air into much of Europe, while warm air has made it into the arctic. So far in January the temperature has been more than 10C warmer than usual at Svalbard airport (78N). The previous precipitation record for January for this arid place has been shattered. It was 36.1 mm and has of yesterday, more than a week remaining, it was 56.1 mm. The old daily record, 11.2 mm, was also shattered: 16.9 mm. Temperatures have reached +5.0C. This sometimes happens this far north in January, but it’s not that common. Much rainfall has frozen on the ground and has shut down the airport for days.
If we are to believe that the weather and climate have been dead stable since the last ice age, this is certainly alarming. Or perhaps this is simply ordinary weather that climate models fail to model.
Now it is low after having been several degrees over the reference for the last part of 2009. Don’t make the same blunder as the warmists. How about the sea ice extent for example?
” The slope of decline has also recently been quite sharp, dropping from 252K on January 1, a drop of 14 degrees in 22 days.”
Has anyone else noticed that the last daily temperature on the DMI graph for 2009 appears to be equal to the mean, 243K, yet the next day (Jan 1 2010) the temperature jumped to over 250k.
Jumping from 243K on 31 December 2009 to 252K 24 hours later, with the 1 January value suggesting that the day previous was 251K.
One of these graphs is wrong.
Remember this is modeled data! so beloved of AGW
If you check out the last few months of 2009 on the COI page it is notable that the modeled temps are way above average!!
Calculation of the Arctic Mean Temperature
The daily mean temperature of the Arctic area north of the 80th northern parallel is estimated from the average of the 00z and 12z analysis for all model grid points inside that area. The ERA40 reanalysis data set from ECMWF, has been applied to calculate daily mean temperatures for the period from 1958 to 2002, from 2002 to 2006 data from the global NWP model T511 is used and from 2006 to present the T799 model data are used.
Ice is supposed to have the black body constant. Where it is the long night plus ice, the globe is radiating and no watts/metersquare are coming in at all. How much is that? At 252K 225watts/met^2 are radiated from the ice to space, at 238K 182watts/m^2. No radiation is coming in, the only efficient way the temperature can go up in the long night is by convection.
My interpretation of the plot is that the wind has stopped and the ice is happily radiating away.
The arctic is “recharging.” Pretty soon this supply of fresh, cold air will head south, and the graph will spike back up at the pole, as folk further south shudder in the cold, and a bunch of new record cold temperatures are reported.
I’m interested in the up-spike of the UAH world-wide temps. How much of the very cold air is “missed,” as it is “underneath” the part of the lower tropasphere the satellite measures?
When world-temps jump up or plunge down by an entire half-degree, you can’t really blame CO2, which shows no similar jumps up and down. I think it will be interesting to hear theories about what causes such jumps.
Here is the graph for 2009. to put that in perspective.
Actually, if it remains cold in the arctic it might be a good test for GISS temperature measurements. On other threads we’ve been discussing possible reasons for the discrepancies between GISS and other metrics. A possible reason for the relatively higher GISS anomalies (over the past 6 years) is the arctic extrapolation used by GISS. If the arctic remains cold, a significant contributor to the GISS anomaly should be cooler. This should result in GISS monthly anomaly being relatively cooler than the others.
Unfortunately the arctic looks to have been quite warm in the early part of the month so the overall monthly anomaly might not be particularly unusual.
South Eastern Canada (and I don’t mean Florida) has had a mild Jnuary so far; perhaps this indicates impending cold in a couple of weeks?
I have just come across this NSF news article:
“Global Ice Age Climate Patterns Influenced by Bering Strait”
Dated: January 10, 2010
“In a vivid example of how a small geographic feature may have far-reaching impacts on climate, new research shows that water levels in the Bering Strait helped drive global climate patterns during ice age episodes dating back more than 100,000 years.”
http://www.nsf.gov/news/news_summ.jsp?cntn_id=116189&WT.mc_id=USNSF_51
It would be interesting to me to see a lot of thermometers in the water at the Bering straight. I have sailed for nearly 40 years and see currents effect surface temps and changes in weather. Even when the surface is frozen, currents underneath keep moving. The Met Office boasts of huge computors that calculate wind direction and speeds at many altitudes to optimise Comercial aviation. If we have the same at many depths for currents, we can get more inputs for the PDO.
In terms of weather, we are just beginning to learn what we do not know.