Here’s a look at what black carbon does to radiation flux according to GISS, so it appears they are aware, but maybe not using the right numbers
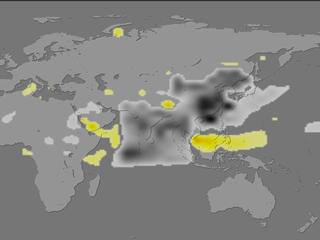
This is for Asia, I’d really like to see Russia. Also see below the “read more” for an interesting experiment that Mike Smith of WeatherData Inc. did last year to show the effect of carbon on snow. It is a simple experiment that you can do at home. I wonder how much of that soot from Asia finds it’s way to snow at high latitudes?
And here is the article that has been making the rounds this week, h/t to Leif Svalgaard
Click for larger image Grant Stone, QCCCE
(PhysOrg.com) — A detailed analysis of black carbon — the residue of burned organic matter — in computer climate models suggests that those models may be overestimating global warming predictions.
A new Cornell study, published online in Nature Geosciences, quantified the amount of black carbon in Australian soils and found that there was far more than expected, said Johannes Lehmann, the paper’s lead author and a Cornell professor of biogeochemistry. The survey was the largest of black carbon ever published.
As a result of global warming, soils are expected to release more carbon dioxide, the major greenhouse gas, into the atmosphere, which, in turn, creates more warming. Climate models try to incorporate these increases of carbon dioxide from soils as the planet warms, but results vary greatly when realistic estimates of black carbon in soils are included in the predictions, the study found.
Soils include many forms of carbon, including organic carbon from leaf litter and vegetation and black carbon from the burning of organic matter. It takes a few years for organic carbon to decompose, as microbes eat it and convert it to carbon dioxide. But black carbon can take 1,000-2,000 years, on average, to convert to carbon dioxide.
By entering realistic estimates of stocks of black carbon in soil from two Australian savannas into a computer model that calculates carbon dioxide release from soil, the researchers found that carbon dioxide emissions from soils were reduced by about 20 percent over 100 years, as compared with simulations that did not take black carbon’s long shelf life into account.
The findings are significant because soils are by far the world’s largest source of carbon dioxide, producing 10 times more carbon dioxide each year than all the carbon dioxide emissions from human activities combined. Small changes in how carbon emissions from soils are estimated, therefore, can have a large impact.
“We know from measurements that climate change today is worse than people have predicted,” said Lehmann. “But this particular aspect, black carbon’s stability in soil, if incorporated in climate models, would actually decrease climate predictions.”
The study quantified the amount of black carbon in 452 Australian soils across two savannas. Black carbon content varied widely, between zero and more than 80 percent, in soils across Australia.
“It’s a mistake to look at soil as one blob of carbon,” said Lehmann. “Rather, it has different chemical components with different characteristics. In this way, soil will interact differently to warming based on what’s in it.”
Provided by Cornell University
This from Brett Anderson’s AccuWeather Global Warming blog last year:
Here is a photo of fresh snow cover in my backyard over which I had tossed some eight month-old fireplace ash under a totally blue sky
Keeping in mind this demonstration is occurring just two days after the winter solstice (meaning the albedo effect is less than it would have been under clear skies in February or March), in just one hour, the greater melting in the ash-covered areas is already apparent:
After four hours, the ash-free area has a depth of 5.5 inches
At the same time, the ash-covered areas have a depth of about 2.5 inches. Multiple measurements were taken (note ruler hold about an inch in front of ruler) which yielded an average depth of 2.5 inches.
The areas without soot melt about 0.5 inches of snow during this 4-hour period while the soot-covered areas melt 3.5 inches.
For visual comparison purposes, note the ruler hole in the non-ash-covered snow above the shadow.
Even tiny amounts of soot pollution can induce high amounts of melting. There is little or no ash at upper right.. Small amounts of ash in the lower and left areas of the photo cause significant melting at the two-hour mark in the demonstration.
Any discussion pertaining to melting glaciers or icecaps must consider the accelerated melting caused by soot pollution in addition to any contribution from changing ambient temperatures.
Photos: Copyright 2007, Michael R. Smith
Mike Smith is CEO of WeatherData Services, Inc., An AccuWeather Company. Smith is a Fellow of the American Meteorological Society and a Certified Consulting Meteorologist.
But the science is settled, there is nothing else to be learned. We know everything there is to know and it is all correct. Why are they still doing studies?
Yet another problem for the climate models.
Even if the models did add the soil carbon factor, they still would not come up with anything worthwhile to say.
Today’s models are still terribly inadequate even for predicting conditions beyond a few months, let alone for formulating government policy for the next 100 years.
The resources should flow into better weather forecasting – beyond 7 days. I’ve been watching the 15 day forecasts and they are a long way from being accurate.
And therefore land-use/cover changes have an impact on emissions as well.
Does anyone have a link on hand that can describe or quantify the sum of all sources of CO2 that also includes “black carbon?” I’m interested in seeing as a percentage what black carbon actually produces.
“We know from measurements that climate change today is worse than people have predicted,” said Lehmann. Another Lehmann bust.
“We know from measurements that climate change today is worse than people have predicted,” said Lehmann. “But this particular aspect, black carbon’s stability in soil, if incorporated in climate models, would actually decrease climate predictions.”
The first part of this statement is peculiar and, I hope, taken out of context. What measurements, surface station temperatures? Worse than predicted? Not with doom prophesies abounding. At least the author and editors didn’t sweep “negative” results under the rug…
I’m suprised the climate community is just now figuring this out. The role and longevity of black carbon is well documented. Our own Tallgrass Prairie’s: http://iledi.org/ppa/docs/00/00/00/00/09/02/20061002190618_ISWSCR2003-02.pdf and the Terra Preta de Indio in the Brazilian Amazon: http://www.css.cornell.edu/faculty/lehmann/terra_preta/TerraPretahome.htm are well known for their black carbon content.
The planet is getting colder and it is the change in the sun cycle that is driving it.
The AGW brigade are now trying to protect their jobs, reputations and liefstyles, not to mention those of the politicians.
This is interesting stuff but the bottom line is yet again the “settled science” is in trouble as more revelations come to the fore.
One wonders how long the media will put up with it before realising they can have one of the biggest stories of all time and Governments and Scientific establishments will collapse.
It should have started to happen already.
This week is CNN’s “Climate Change Week”….on Tuesday a weathergirl showed us satellite maps of the Arctic.
She explained the purple areas were the sea ice and the deeper the colour the thicker the ice.
Lots of dark purple and the ice coverage up 30% on a year ago.
She added it may be something to do with the temperature!!!!!!!
Reported and debated?
Not even on CNN who promptly wert to the adverts.
I would like to see criminal charges brought against some people and organisations.
If soils release 10 times more CO2 than all human activities combined, perhaps we should just pave over more raw land. That would easily solve the CO2 problem. No-brainer.
This is profoundly and deeply disturbing, especially given what is going on with expansion of biofuel related agriculture via slash and burn in the tropics, world wide.
Yes we are ruining the planet but not in the way popularly depicted.
“Going Green” is ruining the planet and the result may be a dire little Ice Age if not the real McCoy.
Even ash, dirt and other dark particulates on ice and snow is a positive feedback loop – a positive feedback loop for COOLING! Highly disturbing.
A trick ski areas use to firm up spring snow on night where it does not get cold enought is to salt it. Forced melting of snow or ice via either salting or sooting is a ENDOTHERMIC reaction!
SteveSadlov,
Can you explain the mechanism by which dirt and other dark particulates on ice and snow is a positive feedback loop for cooling? I am having a hard time picturing it.
thanks
I grew up watching Mike Smith on TV in Wichita, KS. He’s one of the reasons I became so interested in weather. Nice to see he’s still teaching people about the weather.
The idea that this and all the other contributing factors to the climate can be modelled is clearly absurd.
How much work is going on which would even lead to the carbon cycle alone being described well enough to model? How much agreement is there between researchers? (If there is such a thing as a describable carbon cycle, maybe there are so many variables and feedbacks that it never goes round even once).
Notice he didn’t throw carbon black on the snow, he tossed in wood ash. I believe wood ash creates sodium hydroxide (lye) on contact with water. I would expect that to lower the melting point, just like tossing salt on the snow would do.
SteveSadlov – Slash & Burn was occurring long before the biofuel explosion and will continue long after biofuels fall from favor. If you haven’t noticed, the world is requiring more food each year, so there will always be a demand for more acres. Also, slash & burn ground is not sustainable, so the need to clear more ground is ever present.
This could become a new feature in Mad Magazine. Instead of “Spy vs Spy”, we have “Climate Model vs Climate Model”.
…and I would like to know what it would be like if there were no such things like man made pavements, roads or any kind of concrete, man made structures to cover the soil. What amount of CO2 might the now covered soil/woods have produced naturally compared to the otherwise produced amount of CO2 by man. Does anybody know of any figures that might be used for such a comparison? Please.
In general woods growing naturally in temperate zones contains from 0.2 to 0.9%. and almost always less than 0.5% ash, while wood from tropical areas.
can contain up to 5% ash.
The constituents include mainly minerals: potassium and calcium, which constitute up to 50% of cations in the ash wood; are also found magnesium, manganese, sodium, phosphorus and chlorine, and silica in the case of tropical forests.
The most common anions are carbonates, phosphates, silicates and sulfates.
I ask.
Some experiment was carried out with washed ash. To avoid any effect cryoscopic (of salts present).
FM
Maybe thats why the ice bounced back this year. All the soot in the “multi-year ice” sank into the ocean when the soot caused the ice to melt last year.
If you want to see how many fires are in progress worldwide, this is your fire mash-up site … http://firefly.geog.umd.edu/firemap/
Note how many appear to be man-made agricultural fires, instead of natural forest fires. MODIS usually has satellite pictures of a selection of worldwide fires daily http://modis.gsfc.nasa.gov/gallery/individual.php?db_date=2008-11-20
How is the ‘variability’ of this taken into account by those inaccurate, horribly flawed, climate models.
GISS textbook.
One nitpick, which also reveals the efficacy of AGW propaganda: “carbon dioxide, the major greenhouse gas”.
The claim that black carbon in soil “can take 1,000 to 2,000 years” to be converted to CO2 must be the understatement of the year. Elementary carbon (charcoal) is one of the most stable substances known. It can stay unchanged literally for millions of years, as is well known by archaeologists and paleontologists. Abundant fusain deposits (=soot from wildfires) are known from the Carboniferous (c. 300 million years ago).
Clay…
You made my day, thank you!
Best wishes,
Mike
As noted above:
If soils are the largest source of CO2 and produce 10 times more CO2 than all the CO2 emitted by mankind and,
If the climate has changed more than the models have predicted and,
If CO2’s stability in soil were to be adjusted in climate models leading to even lower predictions of warming in these models,
then
AGW proponents may doubtless claim that the models aren’t giving enough weight to mankind’s CO2 emissions. Therefore, from their point of view, the crisis is greater then ever and we have only ten years to act to save the planet from the perils it faces from mankind’s exploitation of its precious treasures.
{yuck — just saying that sort of spiel made my skin crawl}
Let’s try a dose of reality. If the models have not accurately predicted how the climate changes even while over-counting the effects of soil CO2 then how about tossing the models and accept that mankind’s effect on the changing climate is but a mere squiggle on a temperature graph {unless it’s a GISS-generated temperature graph, in which case the whole thing’s a squiggle}.
Hans Kelp (11:32:39) :
…and I would like to know what it would be like if there were no such things like man made pavements, roads or any kind of concrete, man made structures to cover the soil. What amount of CO2 might the now covered soil/woods have produced naturally compared to the otherwise produced amount of CO2 by man. Does anybody know of any figures that might be used for such a comparison? Please.
I can’t answer that, but:
Carbon Sequestration in Dryland Soils and Plant Residue as Influenced by
Tillage and Crop Rotation
By: U.M. Sainju, A. Lenssen, T. Caesar, and J. Waddell
Conventional tillage and wheat-fallow systems have resulted in a 30 to 50% loss of original soil organic carbon levels during the last 50 to 100 years in drylands of the Northern Great Plains.
Even more in mollisols (upper Midwest). Considering that estimates of original organic matter % (measured as a volume measurement in the top 6 inches of soil) is 5-8% , this loss results in 2% loss in soil organic matter (about 80% carbon, after degradation for one year), at least. Without doing the calculations, this equates to a sh&^load of CO2 already put into the atsmosphere.
The disturbing aspect of the northern Australian fires is that they all occur during the dry season and are all man made. In 2001 I drove from Karumba in the gulf across to Broome in WA and it was burning for 2,000 kilometers.
Farmers do it to get an additional flush of grass for their cattle, aboriginal communities do it because they say it’s their tradition.
CNN has a report on it.
http://edition.cnn.com/2008/TECH/science/11/20/black.carbon/index.html
Besides the forest fires there are underground coal fires.
In China these fires burn about 200 Mt of coal per year = 1/5 of total US coal consumption per year.
Fires are raging in Indonesia, Borneo, India, Africa, Germany, Poland, Australia and the USA. What I did not know is that there is also an underground coal fire in Svalgard.
Fires in China are burning for centuries.
http://www.coalfire.org
http://www.itc.nl
I am sure the surface wild fires are of a much bigger magnitude.
Many of the burning forests ignited by the green policies that promote the use of bio fuels like palm oil.
“Lye made from wood ash is potassium hydroxide, not sodium hydroxide — there’s 10 times as much potassium as sodium in wood ash.”
http://journeytoforever.org/biodiesel_ashlye.html
Once we find a major climate forcing that is either ignored or significantly mis-measured in current AGW computer models.
Yet the model promoters still claim their models are not only correct, but accurate.
This cannot be true.
It seems much more likely that the modelers have slated the mine- decided which data points their models need to show to be credible, and written the code to meet those points.
They are now resorting to either censoring the serious studies that show they are wrong- as is being done to Dr. Spencer, or they simply shouting louder and shriller about the coming apocalypse.
How long until people wake up and realize that AGW is simply a scam?
I“We know from measurements that climate change today is worse than people have predicted,” said Lehmann.
False, except of course for the Models’ inability to predict much of anything, while apparently being “consistent with” everything.
It’s just another totally propagandistic goto mantra which attempts to dictate reality solely by means of words, and having people repeat them, thus only ending up begging the question, and instead constituting the complete antithesis of doing science.
So what else is new about this exclusively manipulative religion?
This is one of many postings that should illustrate that the AGW movement, in the main, is not interested in scientific results. They have what they want. The case for them is settled. It’s time to move on to implementing the political policies that will move us into their ideal world: where the lives of people are circumscribed by policies dictated by beauracrats acting in the name of Government & Gaia. It’s no longer a case where there is an honest disagreement between two well-meaning parties. This is a conflict between two visions of the world, and only one will win out. In short, this is a war. In fact, it has been a war. Once the science was called ‘settled,’ war was declared on any who said it was not. The evidence of this is not in dispute. Of course, we must continue to treat all people regardless of their ideology with comportment and some modicum of respect. But it should be clear to all that the other side, particularly the leadership, is ONLY interested in scientific results insofar as it favors and furthers their ideological agenda – this includes politicians and scientists alike.
“The findings are significant because soils are by far the world’s largest source of carbon dioxide, producing 10 times more carbon dioxide each year than all the carbon dioxide emissions from human activities combined.”
Why did I think the oceans were the largest source of C02?
Bruce:
I was thinking the same thing
– multi-year ice will inevitably build up soot, causing it to melt quicker
– the new, one-year ice, should be clearer, and able to survive longer, until it too become sooted.
I think it could certainly be a factor in why the ice suddenly collapsed last year, then bounced back (so surprisingly)
– whether that’s the whole picture, remains to be seen….
“Carbon dioxide is an end product in organisms that obtain energy from breaking down sugars, fats and amino acids with oxygen as part of their metabolism, in a process known as cellular respiration. This includes all plants, animals, many fungi and some bacteria.”
“Carbon is essential to all known living systems, and without it life as we know it could not exist.”
The Supreme Court of the United States has decided that CO2 is to be classified as a pollutant. When will the court decide that carbon contributes to pollution by being a constituent of CO2 and therefore declare carbon a pollutant?
The next four years will be scientifically and politically interesting.
Tim Clark (12:07:18) :
“Conventional tillage and wheat-fallow systems have resulted in a 30 to 50% loss of original soil organic carbon levels during the last 50 to 100 years in drylands of the Northern Great Plains.
Even more in mollisols (upper Midwest). Considering that estimates of original organic matter % (measured as a volume measurement in the top 6 inches of soil) is 5-8% , this loss results in 2% loss in soil organic matter (about 80% carbon, after degradation for one year), at least. Without doing the calculations, this equates to a sh&^load of CO2 already put into the atsmosphere.”
Thank you for the answer, which I find very interesting. In case the “CO2 already put into the atsmosphere.” is meant to be the CO2 put into the atmosphere by man, then my take on this has to be that man is actually putting a “brake” on nature´s own production of CO2. Hadn´t man existed, the natural amount of CO2 in the atmosphere by now would have been much higher than it is today then. But this also means that as the amount of CO2 in the atmosphere by now is on a steady rise, man cannot be responsible for that. It just proves that nature´s own production of CO2 is so huge and powerful that man´s “brake” by no means can stop it. And also, in case man could stop all of its production of CO2, making it nil ppm today, tomorrow the CO2 would still be on the rise because man´s influence on that system is minuscule.
RE:
Old Coach (10:41:57) :
SteveSadlov,
Can you explain the mechanism by which dirt and other dark particulates on ice and snow is a positive feedback loop for cooling? I am having a hard time picturing it.
thanks
Any time you force snow or ice to melt “artificially” (i.e. without raising the ambient temperature) is it a highly endothermic reaction. Even “natural” melting is net endothermic.
The eco-socialists better hurry up and implement their changes lest they lose their cause…
“t can stay unchanged literally for millions of years, as is well known by archaeologists and paleontologists. Abundant fusain deposits (=soot from wildfires) are known from the Carboniferous (c. 300 million years ago).”
Yeah, I saw some this summer in Central Penna, from the Devonian era.
Red Rock at North Bend, PA.
Doug Rowe showed us some the fossils dug up in the area, and there was, basically, charcoal from a forest fire 230 million years ago.
Most bush fires in Australia are anthropogenic and have been for upward of 40,000 years. See ‘Burning Bush – A Fire History of Australia’ by Stephen J. Pyne. Other continents have experienced anthropogenic fire at a landscape scale for thousands of years, including the Americas, since at least the dawn of the Holocene. As much as a third of N. America was burned by human beings every year for millennia.
Those fires may or may not have shaped Holocene climates but they definitely shaped our vegetation, from prairies to old-growth forests. See ‘Forgotten Fires’ by Omer Stewart. Historical anthropogenic fires were frequent, regular, and seasonal, and were light-burning fires that oxidized annual growth.
In the absence of anthropogenic fire (over the last 150 years) major portions of N. and S. America, Australia, and Africa have experience large fuel build-ups in uncultivated grounds. Today wildfires in fuel-laden areas result in catastrophic combustion at high temperatures.
A recent study of the Biscuit Fire (2002) burned area revealed that soil carbon is also oxidized by catastrophic fire. The authors of ‘Intense forest wildfire sharply reduces mineral soil C and N: the first direct evidence’ by Bernard T. Bormann, Peter S. Homann, Robyn L. Darbyshire, and Brett A. Morrissette, Can. J. For. Res. 38: 2771–2783 (2008) found that more than 10 tons per acre of soil carbon and between 450 to 620 pounds per acre of soil nitrogen were vaporized by the fire. Some 60% of soil carbon and 57% of soil nitrogen losses came from mineral soil horizons (below the duff and humus top layers). In addition they found that 127 megagrams (127,000 kilograms) of soil per hectare disappeared, leaving a stony rubble. Much of the soil was probably blown away in the intense wind vortexes of the fire since post-fire erosion measurements failed to account for roughly half the missing tonnage.
By my own calculations forest fires were responsible half of all CO2 emissions in Oregon in 2007. In California in 2008 over 1.3 million acres have burned to date in wildfires, releasing an estimated 120 Tg (teragrams, 10^12 grams) of CO2, roughly the equivalent of 22 million cars driven all year.
Catastrophic wildfires in untended, fuel-laden landscapes not only emit CO2, they emit choking smoke, destroy vegetation and habitat, burn homes, farms, and ranches, foul rivers and streams, cause enormous public health and safety problems, alter entire ecosystems, cost $billions to fight, and inflict tens of $billions in lasting damage on- and off-site to resources and economies.
It’s the difference between black seats on your Impala convertible and white seats. They just completed a study called PACDEX….Pacific Dust Experiment…. that tracked soot from the Asian Brown Cloud to the Canandian Rockies in British Columbia. The cloud contained a melange of aerosol detritus including Gobi Desert sand. There’s a NASA Earth Observatory shot of the brown cloud over New Jersey heading out across the Atlantic. We are all downwind from that fragrant Chinese restaurant.
Having seen only 1 computer model (a java based galaxy collision that crashed a lot), I would like to comment on these fantastic climate models that I have never seen. They seem to be causing unending reams of grief. What would a model look like? What type of equations/theorems are driving the computations?
SteveSadlov (15:07:01) :
“Any time you force snow or ice to melt “artificially” (i.e. without raising the ambient temperature) is it a highly endothermic reaction. Even “natural” melting is net endothermic.”
I’m just testing myself here…
When water goes through a phase change from solid to liquid it only needs to change its temperature by a very, very. very small amount, but a relatively large amount of energy is needed to get the molecules to get out of their lower energy state “comfort” zone to the more frantic liquid state.
So, if the rest of the environment wasn’t introducing this energy, the melting has to suck the energy from around it (endothermic). The surrounding ice, snow and air would then cool.
Conversely, when water freezes, it warms its surroundings, (exothermic) or in practical terms, keeps the cold air above it from staying as a cold as it would have been if the liquid water wasn’t around to freeze and give up that phase change required energy. (I can’ remember what they call it “Heat of something…?”)
BTW can this explain some of the northern Siberia warming with all that Arctic sea ice formation releasing heat?
But “slash and char” is sustainable; that’s apparently what created the rich “terra preta” soils around Brazil. And as the article which spurred this topic suggests, regular burning traps more carbon in soil than either no burning or irregular burning. Others have pointed out studies of the high-carbon grasslands which Native Americans created by frequent burning across much of North America (for thousands of years).
Fire suppression became popular in North America in the early 20th century. So less carbon being stored in the soil means… more carbon dioxide has been released from North America during the 20th century than earlier because of less burning of land. Well, a man-made carbon dioxide increase on a continental scale. How much of an increase, I wonder.
Robert Bateman (19:35:15) :
fantastic climate models […] What would a model look like? What type of equations/theorems are driving the computations?
To give you a feeling for the sophistication of the models, look at these two pages from the 800-page book “Fundamentals of Atmospheric Modeling” by Mark Z. Jacobson, 2nd Ed. found here http://www.cambridge.org/catalogue/catalogue.asp?isbn=9780521548656
page 614: http://www.leif.org/research/Atm-models-1.png
page 615: http://www.leif.org/research/Atm-models-2.png
Yes, I see the complexity. My remaining question then would be:
Are the results from these equations weather patterns that are as finnicky as nature dishes out or ones that follow a normalized baseline with outliers? Or are these something else?
No doubt very taxing on computational power. Mother Nature makes it look so easy.
There have been cloud seeing experiments conducted here (CA) for many decades. For the one that I am aware of, some rather startling results have appeared.
Massive seeding in 1975 was conducted in Nevada County, so much snow was accumulated that local agencies screamed for it to come to a halt. They aquiesced. The next two years culminated with precipitation patterns in the drought 76-77 that featured what looked like a fist shoving the fronts approaching the Pacific Northwest to the north, and it was centered in Nevada County. It was equally persistent.
What it told me that there is a distinct possibility that moisture streams are closed loops that respond negatively to being prematurely tapped. A ‘memory’ if you will like a lender who is not terribly appreciative of your borrowing heavily in a spate and being late with payments.
In this case, the transport system remembers what was dumped last year and where it was dumped. You are getting what it has decided to give you and no more. Monkey with it at your own peril.
Does any of this give you any ideas?
SteveSadlov (15:07:01) :
“Any time you force snow or ice to melt “artificially” (i.e. without raising the ambient temperature) is it a highly endothermic reaction. Even “natural” melting is net endothermic.”
While true, I don’t think this implies that the melting in this case has any cooling effect on the air. The water must absorb energy in the phase change from liquid to solid, but the absorbed energy is coming from the reduced albedo due to the introduction of the black carbon on the snow/ice. It is the absorbed radiative energy that provides the required energy for the phase change (at least on the margin). I don’t see any reason why this would lead to addtional cooling of the air.
SteveSadlov (15:07:01) :
The experiment, if I understand it correctly, was intended to show how sunlight is absorbed and that heat melts the snow. The ambient temperature would not be raised ( at least not beyond freezing). No endothermic reaction, though I share the concern about the KOH forced melting, no exothermic reaction, just melting ice.
At my New Hampshire latitude, black road crud on snow piles in March melt in intersting fashions. The crud often sinks into the snowbank and melts voids. The meltwater can freeze on the reamining snow leaving a fragile structure that doesn’t stand up to feet or cars.
What if a certain power with an intense desire to operate in the Arctic were to deploy a blanket of soot during the dark months? This would be hidden by later snows but would have a profound effect on the summer melt season.
Speaking of complicated, I believe that this is a s complicated as any model and it actually accomplishes something:
http://www.break.com/index/best_rube_goldberg_ever.html
Has anyone stopped to observe cause/effect of cloud seeding, or am I alone in this regard?
Would you or would you not be upset if tomorrow morning you jumped in your car with precious little time to get to work only to find out that someone had siphoned your gas tank?
Now I learn that you burn a forest and black carbon accumulates in the soil, and takes forever to release its charge of CO2. But what gushes into the atmosphere during the burning process? Surely copious volumes of CO2?? And from the next fire that occurs next day?
Leif Svalgaard (20:22:51):
To give you a feeling for the sophistication of the models, look at these two pages from the 800-page book “Fundamentals of Atmospheric Modeling” by Mark Z. Jacobson, 2nd Ed. found here http://www.cambridge.org/catalogue/catalogue.asp?isbn=9780521548656
The scientist alluded to as a master modeler is Dr. Mark Jacobson, who is on the Stanford faculty, as a professor of Civil and Environmental Engineering and may well know Leif personally. He is a smart guy. On the other hand, this is what he has published with regard to the Sun in a textbook widely used in the study of the atmosphere at American universities:
A sunspot is a large magnetic solar storm that consists of a dark, cool central core (umbra) surrounded by a ring of dark fibrils (penumbra). Sunspots are hot and emit more energy than does the rest of the Sun.
Sunspot number and size peak every 11 years. Because the Sun’s magnetic field reverses itself every 11 years, a complete sunspot cycle is 22 years.
The difference in solar intensity at the top of the Earth’s atmosphere between times of sunspot maxima and minima is about 1.4 W/m2.
Because sunspot intensity varies relatively consistently from cycle to cycle, sunspots cannot be responsible for the rapid increase in recent temperatures.
The textbook is Atmospheric Pollution: History, Science and Regulation; Cambridge University Press (2002)
Besides the ignorance of the Sun itself, there is a straw man argument here. Those who argue in favor of a strong Sun-Earth climate connection do not maintain that sunspots are responsible for increased temperatures during the late 20th century. Jacobson is among those who deny the global nature of the Maunder Minimum, pointing to evidence of warming in Antarctica. But Svensmark, among others, has shown that the increased clouds associated with solar minima lower Antarctica’s albedo and have an anomalous warming effect on the southern continent.
Archibald’s work showing the effect of the length of solar cycles comes to mind. The length of Cycle 23 alone, never mind what may or may not be coming down the pike, means that further cooling in the short term is money in the bank.
Dr. Jacobson’s knowledge of particulate pollution, on the other hand, is widely admired, and rightly so. Perhaps the incipient cooling will prompt him to study the Sun more and draw the world’s attention to the kinds of real pollution that are degrading air and water throughout Asia — and in many other places around the globe.
Peat fires in Indonesia in 1997/1998
http://www.iht.com/articles/2002/12/13/fires.php
“The scientists from Indonesia and Europe who carried out the research reported that up to 2.6 million metric tons of carbon entered the atmosphere as a result of widespread fires in Indonesia in 1997, contributing as much as 40 percent to the biggest annual increase in carbon emissions since records began being kept in 1957.”
Bet there was lots of soot too.
Leif;
In his opinion:
We are in: equilibrium (last 300 years)
Quasistatic
or
metastable
So we know about the diamond lattice form of carbon, and we know about the graphite form of carbon, and then there’s the latest geek toy, the Bucky ball form of carbon, and its carbon nanotube spinoffs; but what the hell are black carbon and organic carbon.
I thought the fact that it has carbon in it made it organic.
Enquiring minds want to know the difference between organic carbon and black carbon.
Bruce,
Someone didn’t calculate right here, or they used a restricted comparison.
In reality, the upper limit of the wildfires is less than 1/1000th of the yearly global emissions of 9 GtC or 9,000 million tons by burning fossil fuels.
Moreover, most of the wildfires are from vegetation that has a limited age: from one year to a few decades. That doesn’t add much CO2 to the atmosphere, as that was sequestered a few years to a few decades before the release. The same for humans (and animals) exhaling CO2, which was sequestered a few months to a few years ago by plants, before eaten and digested by animals (or first by other animals)…
The more interesting point than CO2 emissions from burning vegetation is that aerosols are used in models to (indirectly) imply a huge impact for CO2. Without these cooling by (reflecting sulphate) aerosols, models are not capable to match the temperature trend in the period 1945-1975. But as I already suspected, the magnitude and even the sign of the total aerosol effect (white, brown, black) is not known to any accuracy. Thus the impact of CO2 on temperature is probably a lot lower that implemented…
“” Harold Ambler (11:35:33) :
>>deletions…
“A sunspot is a large magnetic solar storm that consists of a dark, cool central core (umbra) surrounded by a ring of dark fibrils (penumbra). Sunspots are hot and emit more energy than does the rest of the Sun.”
Oh yeah; I thought sunspots are the sun’s refrigerators; that’s how an optical pyrometer works; right ?: the “hotspots show up as dark patches against the colder brighter background” ?? is there something wrong with this picture ?
“Sunspot number and size peak every 11 years. Because the Sun’s magnetic field reverses itself every 11 years, a complete sunspot cycle is 22 years.”
No complaint there.
“The difference in solar intensity at the top of the Earth’s atmosphere between times of sunspot maxima and minima is about 1.4 W/m2.”
or here.
“Because sunspot intensity varies relatively consistently from cycle to cycle, sunspots cannot be responsible for the rapid increase in recent temperatures.”
Wow! where’s the data to support that claim. The sunspot peak of around1605 had about 120 sunspot number, and the 1740ish peak was around 110. Between those it never got over 80 and was less than 10 from about 1645 t0 1715 the Maunder minimum. Then it climbed to around 100-150 for the few cycles just before the Dalton minimum, and was about 60 for three cycles in the Dalton minimum; 1795-1823. The next four cycles were in the 100-140 rangeand then dived down to the 70 range for the 5 cycles from 1882 to 1930. The next two cycles went up to 120 then 150, leading to the placement of the IGY at the 1957/8 next sunspot peak.
Nobody could have foreseen that the IGY sunspot peak would be the highest peak ever in the entire history of sunspots, at about 190 spot number.
The recent peaks since IGY were about 110, 160, 160, and then the cycle 23 peak of the recent past (don’t have the number).
So sorry to report but since the IGY of 1957/58, the sunspot peak numbers have been the highest in sunspot history.
“Besides the ignorance of the Sun itself, there is a straw man argument here. Those who argue in favor of a strong Sun-Earth climate connection do not maintain that sunspots are responsible for increased temperatures during the late 20th century. Jacobson is among those who deny the global nature of the Maunder Minimum, pointing to evidence of warming in Antarctica. But Svensmark, among others, has shown that the increased clouds associated with solar minima lower Antarctica’s albedo and have an anomalous warming effect on the southern continent. ”
Well count me as one who DOES attribute the warming period basically following the IGY to those high sunspot peaks. No not to the 1.4 W/m^2 p-p change in the solar constant during a sunspot cycle, but to the magnetic field effect associated with sunspots, and the effect of that on cosmic rays, and solar charged particles arriving at earth.
It is the magnetic link that influences cloud formation that accounts for the late 20th century warming; and that most definitely was associated with the sunspots; and the lack of those spots now, and the resulting change in the magnetic environment, is what is giving us the new period of cooling.
Nobody seriously points to the 0.1% p-p solar constant cycle associated with sunspots as a reason for warming and cooling; but the associated magnetic field/cosmic ray/cloud linkage certainly can explain everything we have seen happen since IGY.
That’s my story and I’m sticking with it.
Ferdinand,
I guess my quote source sucked.
However: “In 2002, Rieley and his colleagues estimated that during 1997 and 1998 smouldering peat beneath the Borneo forests released between 0.8 and 2.6 billion tonnes of carbon into the atmosphere. That is equivalent to 13 to 40 per cent of all emissions from burning fossil fuels, and contributed to the CO2 peak in 1998.”
http://www.newscientist.com/article/dn6613
“”” SteveSadlov (15:07:01) :
“Any time you force snow or ice to melt “artificially” (i.e. without raising the ambient temperature) is it a highly endothermic reaction. Even “natural” melting is net endothermic.” “””
I’m having a hard time trying to decipher who actually said this from all the times it is posted above.
So the statement asks a question; “is it a highly endothermic reaction.” But no question mark, so is the question mark missing or was it really a statement; “IT IS a highly endothermic reaction. ” Anybody know?
The latent heat of freezing associated with the water/ice phase change is 80 calories per gram. When floating sea ice melts, it must absorb that 80 calories from the ocean water it is floating on, and that will cool a huge amount of sea water which will shrink, since water with more than 2.47% silinity has no maximum density before it freezes (unlike fresh water). So the sea level will go down when the floating sea ice melts. : see Physics today for Jan 2005 Letters section by George E. Smith. Prediction was confirmed by British Dutch team in mid 2006 who reported on ten years of arctic ocean observations using a European satellite. result was 2 mm per year drop, confirming that in fact the ice was melting during that ten years.
BUT, in order for water to freeze, that 80 calories per gram has to flow the other way; and sadly the system is not symmetrical. The second law of thermodynamics still insists that the flow must be from a warmer source to a colder sink, so the water will NOT freeze, unless the surroundings (air or water) are already colder than that water. The ocean sea water could be colder than zero since it has about 3.5% salinity; but nothing is going to freeze unless the surroundings are already colder than the freezing water; so nothing is going to warm up.
The most you can claim is that the surroundings which are removing the energy from the water, won’t get as cold as they otherwise be, in the absence of water to freeze.
Grape and citrus growers routinely spray their crops with water during a freeze. For one thing, pumped ground water is going to be in the 60 degree range, but so long as ice keeps forming on the crops, the temperature won”t drop below freezing so the fruit will not freeze (because of the dissolved sugars and such)
So it is misleading to claim that freezing water warms the surroundings; it isn’t going to freeze unless the surroundings are, and remain colder than the water.
We’re trying to study an open thermodynamic system. In this system. A decrease of entropy is possible. (Macromolecule, water>>>> ice, urban heat island).
Caution: this is not a cylinder. in a closed system.
FM
George E. Smith (17:26:50) :
“So it is misleading to claim that freezing water warms the surroundings; it isn’t going to freeze unless the surroundings are, and remain colder than the water.”
I don’t think it is technically misleading, but i do think that it is misleading if this statement is made to a non-technical reader.
Can you imagine a reporter being given this statement and makes a headline out of it; “Freezing Causes Warming of Atmosphere – Skeptics Say”. That would be it for the skeptics.
From Robert Bateman: No doubt very taxing on computational power. Mother Nature makes it look so easy.
end quote.
Remembering wayback… In the late 80s, early 90s I ran a supercomputer center. At the end when we were shutting down I got a call from a PhD student at Stanford asking if he could get some time for cloud modeling, but he couldn’t pay much (or at all was the impression). He was very surprised when I basically said “Sure, all you want; free”. I had the machine, my users were laid off, it was idle, why not?
The “bottom line”? To model a single small cloud forming event took several hour to days on a Cray YMP 2-32. While that would be about the same power as the Mac I’m using to type this today, it was a lot then. I suspect it is part of why they still don’t model clouds in the GCMs. If one cloud takes a fast processor for a few days, what would a few million clouds take…
FWIW, somewhere in the back of some doctorial thesis is a footnote thanking Apple for the machine time. I like to think of it as our Cray spending it’s last days dreaming of clouds in the sky…
Bruce,
Thanks for the link, that sounds better and indeed should be around 13 to 40 % of the human emissions of the years 1997-1998.
The only remaining question is in how much that effected the increase in reality: 1997 shows a relative low increase (below average), 1998 was a peak year, but also a strong El Niño year, where there is a strong (temporal) effect of temperature on CO2 increase speed.
Anthony, this is slightly off topic but not that much off because the automatic generator of news articles above links to this article:
http://money.aol.com/news/articles/_a/bbdp/nasas-carbon-sniffing-satellite-sleuth/246144
You have made big contributions to improving the instrumental record. Evidently scientists also want to improve the measurement of atmospheric carbon dioxide. I just came across this:
http://www.biokurs.de/treibhaus/180CO2/bayreuth/menuee.htm
Perhaps you have discussed this in the past. Dr. Beck is claiming atmospheric CO2 was higher early in the 20th century than it is now. He claims we have just stopped measuring it using the more precise methods. Is this accurate? Are we just relying on the one site in Mauna Loa these days?
REPLY: My position on those measurments cited by Beck is the following:
So, I don’t put much creedence in them. – Anthony
Anthony, thank you for the reply. You are correct that the measurements vary a great deal over short time spans, but it is unclear to me how that discredits the measurements. You seem to be assuming a global trend exists and has to be within a very narrow range, yet that is the very thing we are trying to determine.
You mention most of the measurements were taken in western cities, hotspots for CO2. Assuming you are correct that these cities are hotspots, they still show considerable variability. Some might take that to mean the carbon cycle is more active in certain regions or CO2 residence time is much less than estimated by the IPCC using the Bern Carbon Model. Willis E says there is no way to know which method for measuring residence time fits the data better.
http://www.climateaudit.org/?p=4370#comment-312489
Why would Mauna Loa measure global atmospheric CO2 when other methods measure local CO2?
I am still at a loss on this. If our data on atmospheric CO2 were really reliable, I don’t think we would be sending up a satellite to improve data quality.
REPLY: My position on those measurments cited by Beck is the following:
-The inherent variability of the chemical analysis methods used adds a significant error bar.
-The locations of the measurements were almost all in western cities, thus likely to be hotspots for CO2 just as they are today.
-The measurements vary so greatly over short time spans that they seem unlikely to be representative of any global trend given that we know CO2 variability has not been much more than a few PPM/yr in the last 50 years.
So, I don’t put much creedence in them. – Anthony
I just came accross this reference and would appreciate links for the criticisms.
I am so disillusioned about the temperature measurements and the purported accuracies of the anomaly plots, that I am suspicious of CO2 measurements which have not been scrutinized and where also corrections are applied as the spirit moves them. For example the recent NOA plots no longer have the upswing on the last averaged point. Go figure.
In addition, AIRS data, which become less clear as time goes on (one has to search for the color codes, I suspect there has been a lot of flak flying around) show that there is a 15ppm non uniformity in the CO2 due to season, latitude and longitude, and, I suspect, volcano outlets.
Mauna Loa is in a volcanic region and right on the hot stream of the north hemisphere, which most of the earth is not, nevertheless they claim that the sea data and the Mauna Loa data agree, within 2ppm.
Would the chemical data errors be worse than the 2ppm errors in the Mauna Loa/sea comparison?
Also your argument about cities: we have to agree, is CO2 homogeneous as the GCM claim, and then close to cities or not should not matter, or inhomogeneous , and then we have to think everything from the beginning.
in this link http://www.biokurs.de/treibhaus/180CO2/bayreuth/bayreuth2e.htm
many locations seem open enough and away from habitations ( slide 2).
From the AIRS data it also seems to me that the icecore records have to be re thought, since they may come from regions with depleted CO2 ( according to the above entry about black carbon also) by at least 15ppm . The whole CO2 field needs a lot of scrutiny.
re: ron cram
co2 measurements are still being made in Europe in the vicinity of cities and although they differ from mauna loa abit, they re not radically higher.
they used to be here:
http://cdiac.esd.ornl.gov/trends/co2/contents.htm
therefore the test has been done. current city co2 is not 30 percent higher than mauna loa and therefore the old data can be considered potentially accurate.
If any one has access to the proper links or even historical measures, I would appreciate it
Anthony, Anna, Ron: Regarding Beck:
I’m curious as to how wide that error bar is. (“The inherent variability of the chemical analysis methods used adds a significant error bar.”)
Were the measurment locations all in high CO² emission areas in the early 1800’s?
Anna: Supposedly, the Mauna Loa measurements take into account errors due to release of volcanic gases. I wonder exactly how they take their measurements. etc.
You know what? It seems like the AGW people want us to believe that measuring and recording CO2 levels is an ancient art passed down by Dr. Keeling to his acolytes. Hmmm… it appears that measuring CO2 is not really very mysterious or complicated after all. Maybe Mauna Loa and the other CO2 labs could be eliminated by devices like this one:
http://www.hhydro.com/cgi-bin/hhydro/XHH0036.html
Prior to 1920, natural fires in Oregon were allowed to burn themselves out, and fields were burned sometimes twice a year. Prior to 1850, the Indians routinely burned nearly the entire Willamette Valley every year. There must have been tons of carbon in the air. Much more than today.
I would agree that Beck can not be dismissed too easily. I have done a lot of research on his figures over the past month and many of them stand some scrutiny. The following is an attempt to put climate change-and becks work- into a broader historic context. As most sites have many non experts who are often confused by terminology it has been written in a straightforward manner, so apologies in advance to the experienced.
Background
Put simply, the official IPCC view is that current temperatures are ‘unprecedented’ and this has been caused by man made co2 emissions from burning fossil fuels adding to the existing levels of ‘natural’ emissions. This has disrupted atmospheric ‘equilibrium’ (whereby co2 has previously been absorbed into natural ‘sinks’ such as oceans) and subsequently created a dramatic rise in atmospheric co2 concentrations. These levels range from 280ppm (parts per million) before 1750- the start of the industrial age – as measured by ice core samples, a 1900 figure of 295ppm (according to the work of GS Callandar) through 315ppm in 1958 as measured by Charles Keeling at Mauna Loa, through to today’s reading of 380ppm, thereby ‘proving’ the relentless rise of warming man made co2.
The following graph compares known historic temperatures with known levels of human co2 emissions and consists of information from two separate data sets. Dr Mann has spent 15 years working on his ‘hockey sticks’ and the ‘spaghetti derivatives’ so readers should understand this is very much a first try!
Graph 1 (temperatures in red) is the one chosen as our base line-It shows Hadley CET (Central England Temperatures) dating from 1660 to current date (in degrees C) This is the longest temperature series in the world and covers much of what we know as the Little Ice age-approximately 1350 to 1880. The figures have been unadjusted or smoothed, so shows actual peaks and troughs very well. Whilst CET is pretty good, the four stations represented within it do change and we would estimate a UHI (Urban Heat Island) effect over the last fifty years of at least 0.5C. However the graph has NOT been adjusted for this probable bias as it makes it easier to spot potentially rogue temperatures from other series. Consequently we consider this to be our benchmark.
The blue line in the bottom right hand corner shows the actual CDIAC//IPCC total emissions of co2 by humans since 1750. Any man made emissions are said to go straight to the ‘bottom line’ as an increase in concentration. Because of this immediate cause and effect we have therefore translated these additional emissions directly to an equivalent ppm amount- a rather crude reference point. We had as a guideline however the known ppm from today, back to 1958 when Charles Keeling first took his measurements. N.B. Natural emissions are annually 20 times greater than mans.
The lower green line illustrates the actual levels of man made co2 still in the atmosphere in any year through the decomposition of co2 over a 50 year period
After plotting all the known fixed points (please refer to graph) it appeared to show that either;
1. Co2 has no relationship whatsoever to temperature-it can be equally as warm at the 280ppm pre industrial levels, as it can at today’s 380ppm levels.
2. Alternatively that the estimate of 280ppm taken from ice cores is false and that other co2 peaks and troughs need to be factored in to create any sort of co2/temperature relation
3. Alternatively co2 lags temp rise by up to 800 years (as suggested in ice cores) so the current rises in temperatures is a response to the Medieval warm period, not the modern warm period.
It can also be seen that temperature rises appear to predate co2 increases and there were various times even in the Little Ice age when temperatures were as warm as today. Hadley CET are said to be ‘indicative’ of the Northern Hemisphere.
http://cadenzapress.co.uk/download/mencken.xls
It seemed worth investigating proposition 2 further as the graph seems to cry out for additional co2 spikes to be inserted in order to provide some correlation with fluctuating temperatures.
Consequently the work of Beck was inspected in considerable detail (Beck believes there are many reliable co2 readings prior to 1958 and that these demonstrate much greater variability than the ice cores suggest.) Some of Beck’s historic measurements were factored in, and this appeared to show some interesting correlation. There has been much criticism of Beck, and his claims somewhat derided by warmists and sceptics alike. Consequently a detailed history of pre 1958 co2 measurements was also researched in the context of the wide spread taking of measurements from the period 1820 onwards. These were needed for scientific and practical reasons-for example within mines, hospitals and in workplaces. The British Factories Act of 1889 set a limit of 900ppm inside cotton factories.
From this research it is difficult to come to any conclusion other than very many high quality scientists-some Nobel winners- from Victorian times onwards, were perfectly capable of taking very accurate measurements which showed variations from around 280 to 400ppm or so ( capable and actually achieving it are two different things)
Of course, if this interpretation is accepted it means the ice core measurements are incorrect.
I subsequently relooked at Becks information as I wanted to insert some of the readings so I took the following jpeg from Becks paper http://www.biokurs.de/treibhaus/180CO2/Bad_Honnef/bhonnef1e.htm
and put it over my graph (Yellow dots are his readings). I think I have a much better accuracy of temperature than he does, as the fit is rather close.
http://cadenzapress.co.uk/download/beck_mencken_with_decomposition.xls
Especially note the rise in co2 at a very similar rate to the current levels during the period 1920 to 1950. Also note we do not have a measurement for each year so will be missing some peaks and troughs of co2 readings. We are also missing the lower co2 readings which I intend to insert shortly
Now it may be Beck cherry picked measurements BECAUSE he knew they correlated with various temperatures. However I am not sure this is so, as his jpeg would have reflected this relationship more closely than it does.
It is my intention to work on other graphs and readings to more accurately examine Becks findings.
In the meantime others should read Ferdinand Engelbeens excellent web site debunking Beck so they can see a technical critique of Becks claim-mine is purely looking at the historical and social context, in as much measurements were taken frequently for a variety of reasons. Some of the higher ones may have been to measure a known co2 hot spot in a factory with a view to prosecution.
TonyB
If soils release 10 times more CO2 than all human activities combined, perhaps we should just pave over more raw land. That would easily solve the CO2 problem. No-brainer.
Sure, soils emit all that CO2.
The problem arises that the soils absorb more than they emit. Including a share of what man emits.
Tony B
Your plots are not displaying since one cannot show plots here. You should give links.
Do you have a link for Ferdinand Engelbeens web page? Nothing came up as such when I searched with Yahoo.
Anna V
Here is the link to Ferdinand’s critique of Beck
http://www.ferdinand-engelbeen.be/klimaat/beck_data.html
I have just clicked on the links in my initial email and everything is coming up as it should and they are displaying correctly. Anyone else having problems?
TonyB
TonyB
I can see links that come paragraphs after you mention Graph 1 to which on should refer. Which link has Graph1?
thanks for the engelbeen link.
My main “point” is the total acceptance that ice core data are a good background estimate . quote:
“. But the averages measured over land in the period 1935-1950 (15 years) is about 100 ppmv higher than in the ice core. That proves that the land based measurements show positive biased values, which have no resemblance to the real historical background (which was already obvious in the previous chapter).”
In view of
a) the Airs data http://airs.jpl.nasa.gov/
b) this present post about “missing black carbon and resultant co2 emission”
I would find it not surprising for the background values over land in the northern hemisphere to be 100 ppm higher than the values in arctic regions.
And this, without checking into how all these values that are accepted as bible truth are calibrated.
Hi Anna
This is graph 1 which clearly showed ‘something’ seemed to be missing
http://cadenzapress.co.uk/download/mencken.xls
I took the material from Beck as per the link under;
http://www.biokurs.de/treibhaus/180CO2/Bad_Honnef/bhonnef1e.htm
and superimposed it over graph 1 to produce the link under; In addition I took into account the 50 year half life of co2 and put that in as a green line. (It needs to be plotted back to the 1750 line).
http://cadenzapress.co.uk/download/beck_mencken_with_decomposition.xls
The Beck plots are as yellow dots. It must be pointed out that Beck has stressed to me that not all the available data is reliable due to flaws in measurement methods, or too few readings were taken over a specified period etc.
I am satisfied the scientists of the era were perfectly capable of taking accurate measurements, but as in all walks of scientific life some would not stand close scrutiny. Consequently I am investigating in detail a small number of what are said to be the more reliable plots to determine the exact circumstances of the readings.
Three of the people I respect most in Climate work are Ferdinand E, Steve M and Anthony Watts. It is somewhat daunting therefore to say that I disagree with ALL of them and think there is more to Becks work than perhaps they think!!
I distrust nice smooth lines such as we have for the Keeling curve, and having investigated the history of how the measurements came about- around 1955- I think Keeling relied to much on Callendars work in setting the 1900 benchmark at 295ppm. If anyone is interested (and I appreciate this is a science blog) I can post some of the history of the matter that persuaded Keeling to accept 295ppm as his benchmark, and which helped persuade him there was a Keeling ‘curve’ rather than accept his work in 1958 was merely just another plot of 315ppm which fitted into natural Co2 variability.
I am afraid I am also rather sceptical about ice core readings and think previous atmospheric variability up to modern levels is a more rational explanation for the lack of correlation I perceive in the graph. Otherwise we are saying higher temperatures than the present are possible at 280ppm pre industrial levels back to 1660. Factor in the MWP and the Roman warm period and the Holocenes and in effect temperatures could be warmer at 280ppm than they are at 380ppm.
Chemical measurements would be accurate up to 3% ( or better) so would be close enough to clearly demonstrate previous levels
Perhaps the 100ppm we are said to have added since 1750 doesn’t matter as the climate doesn’t react to anything much over 300?
TonyB
SteveSadlov, while I agree that melting from black carbon is an endothermic action, I don’t think you’re seeing the big picture. The overall picture is that less sunlight is reflected back into space by the carbon compared to pristine snow, so more net energy is absorbed by the surface. Comparing the two cases, even at the same temp (say freezing), the black carbon situation has more liquid water than the pristine-snow case, and hence more total “heat”.
I always enjoy reading Ferdinand Englebeen’s skeptical comments here, and he makes some very good points regarding the Beck analysis. But I have a few quibbles. Englebeen states:
Why is there no mention of the fact that in 1943 the world was at war, which resulted in very rapid industrialization, along with the incineration of entire cities? Omitting that world event seems to have been a major oversight in the Beck critique, particularly since the critique assumes, as an unarguable fact, that human production of CO2 is the reason for its rise — even though it has been shown that rising CO2 levels follow centuries-earlier rises in temperature.
As the war wound down, CO2 levels of course diminished; daily bombing runs by multi-thousands of heavy aircraft stopped, fires were extinguished, factories were taken off 24/7/365 schedules, etc.
To unequivocally state that there is ‘simply no process’ that could possibly account for declining CO2 levels is to assume that all knowledge of CO2, including its persistence in the atmosphere, is currently known.
As Prof. Freeman Dyson has pointed out, we know little about the effect of topsoil in absorbing carbon dioxide. Microbes in the soil multiply rapidly, many times per day. Their growth could easily increase if sufficient food were available. CO2 is, of course, plant food.
Englebeen’s critique also ignores the much larger CO2 peak and subsequent decline in the very early 1800’s, when the industrial age was just beginning. That also appears to be a glaring omission.
Not all of Beck’s data was collected from cities. His site shows pictures of locations where CO2 data was collected. Many of those locations were very isolated places like the rural Scottish coast, and islands in the Baltic sea, with very little human habitation. Data was also collected from ships crossing the open ocean. To arbitrarily discard Beck’s entire data set simply because some locations probably had higher than normal levels of CO2 is almost as sloppy as reversing the critique’s CO2/year chart’s x and y axes.
Beck’s reconstruction has problems. But it also has value. It is one of the few historical CO2 data sources available. And as we know, the Vostok source has accuracy problems, too.
Finally, scientists of the day did not receive lucrative financial grants in return for peddling their case; they were people who were truly interested in the atmosphere, and they recorded data for their own knowledge. That in itself is quite different than the current state of affairs. The work of Einstein’s contemporaries had more integrity than what government entities produce today.
@Ferdinand Engelbeen [quoting]: “In reality, the upper limit of the wildfires is less than 1/1000th of the yearly global emissions of 9 GtC or 9,000 million tons by burning fossil fuels.”
Not sure how you determined this upper limit, but most studies indicate a number close to 2 Pg C / year for wildfires and anthropogenic fires combined. That is almost 1/4 instead of 1/1000. True, real “wild” wildfires are a relatively small fraction.
Good point about most of it being just “fast respiration” (CO2 emitted that was previously captured by photosynthesis). Still, the fraction associated with deforestation or an increase in fire activity is considerable. This is a net source.
Fires also play a role in explaining interannual variability in growth rates of CO2 and CH4, for example the large fires in Indonesia mentioned earlier in the thread in 1997/1998 explaining part of the high CO2 and CH4 growth rates that year.
What is being measured is the carbon which remains after burning. Plants take carbon from the air while they’re growing. Eventually they burn or rot, both releasing some carbon to the atmosphere. Frequent burning leaves a lot more carbon in the soil than trying to stop burning because a fire after 40 years is both more destructive and leaves less carbon in the soil (indeed, intense fire burns carbon out of the top layer). Much land used to be burned often, trapping large amounts of carbon. In the Americas this was reduced after 1492 and actively stopped in much of the world around 1900 for various reasons.
Re: The PhysOrg article and what it means for “overprediction” by climate models:
Reading the actual text of the article, for a 4.5 degrees C warming by 2100, the cumulative carbon emission overestimation from Australia for the century would be 135 Tg of carbon. Australia is about 5% of the world’s land mass, so let’s be generous and assume that this overestimation is both valid and globally applicable. 20*135Tg = 2.7GtC. That’s, um, less than half of this year’s total carbon emissions – spread out over 100 years!
Whoopee. That will reduce projections a whole heck of a lot.
And on the Beck argument: Listen to Anthony. Look at the scatter in the chemical measurements before the Mauna Loa record: you see jumps of 100+ ppm in a year or two. Is it just coincidence that scatter of this magnitude completely disappears when we develop a more reliable monitoring system? And there are stations in the southern hemisphere that show pretty much the same signal as Mauna Loa, just with an opposite, smaller seasonal pattern and a slightly lower CO2 concentration (which makes sense: smaller land mass = less vegetation doing the grow/die cycle, less industry and more ocean sink meaning slightly lower CO2 because it does take a couple years for the atmosphere to mix between hemispheres).
Regarding the original question: the reason for satellite monitoring of CO2 is not because we don’t know global mean CO2, or that the rise is anthropogenic, but rather because there are important details we still don’t have a good grasp of. The biggest of which are natural emissions and uptake: where is the ocean taking up carbon? Releasing it? Which forests are sucking carbon up? How much CO2 does land use change cause to be released? How much carbon does no-tillage agriculture sequester? We have a good bound on how much we emit from fossil fuels, because that is an easy calculation: just weigh the oil + coal + natural gas that you burn, and you know how much CO2 you produce. And yes, we can measure the atmosphere quite well at multiple sites around the globe. So we know what the sum of the ocean + ecosystem + land use change is pretty well, but we don’t know how to partition between them.
I think that all the “skeptics” who jump on the “CO2 rise isn’t anthropogenic” bandwagon and similar poorly-supported memes really don’t help the cause of those skeptics who actually understand the science.
I personally happen to believe that the mainstream climate science consensus is fairly good, but I also believe there is value in websites to keep the consensus honest by documenting poorly located weather stations etc. I’m looking forward to seeing the analysis on the top quality sites, and seeing how it matches the standard temperature records. Also I’m looking forward to seeing comparisons between the Climate Reference Network and USHCN when that is on line. But I think the noise level at these sites can get pretty high, and sometimes I wish the skeptic community could filter out the really junk stuff so we can argue about the stuff that is actually worthwhile…
Finally, on Steve Sadlov and the “cooling by melting” argument:
Think systems. If you have an ice cube in an insulated jar and the ice cube melts, yes, the air temperature in the jar will drop. But the total energy in the system stays the same. Which means you are just shifting energy around in the system. On Earth, that means you won’t get long term cooling just by throwing salt on all your ice and melting it. You’ll get short term cooling, but the next winter the ice will all refreeze and release all the heat right back out again.
Long term heating (or cooling) requires somehow changing the energy balance of the system. Black carbon does this by lowering the albedo, thereby absorbing more sunlight instead of reflecting it out to space. In this case, you probably won’t even get short-term cooling, because the heat of fusion is being supplied by the heat the the black carbon is capturing which wouldn’t have been in the system otherwise. And if enough snow melts to expose dark ground… well, there’s your positive feedback.
Marcus
Let us step back a bit.
Recorded temperatures back to 1660 show similar values to todays without added co2. The previous warm periods have risen to greater levels without added co2. So is man made CO2 the ‘guilty ingredient’ when the suspect was actually missing from the scene of the crime?
Co2 is a small part of overall greenhouse gases and man made emissions a small part of that. It is the notion of ‘Equilibrium’ that has decided that the increase in man made co2 levels has nothing to do with the greater natural amount being emitted annually-and is the tipping point .
Co2 is said to degrade with a half life of anything from 5 to 50 years-depending on who you believe- so much of what we have put into the air has gone into a sink.
If man has added 100 ppm over 250 years that equates to 10 parts per 100,000. In UK terms it means we have added half a part since we started industrialisation in 1750, much of which has subsequently gone into a sink.
Now co2 is stored in all sorts of places according to Eli Rabbetts concept of ‘boxes’. Do we really know exactly how big those ‘boxes’ are and the rate at which they release co2 back, according to the temperatures of say the ocean? Can we be certain we have identified all the boxes-let alone their size?
The thing about Becks work is that it does provide us with a historic record and the historic temperature spikes make no sense unless there are historically higher and lower co2 readings.
Even in Victorian times Co2 analysing methods could be perfectly accurate and measurements were commonly taken for medical and employment reasons-the cotton industry had particular problems with co2 because of ventilation concerns, and the first factories act set a limit of 900ppm in 1889. This had been debated by the British Parliament for twenty years prior to that and its success reviewed in Parliament 15 years after.
Levels aren’t set unless they can be enforced.
Levels were commonly taken- including by many higly experienced scientists including nobel winners. Those by Buchanan and Benedict seem particularly interesting. Not all measurements would be correct of course. Many that were correct may seem high to us but may have been taken in a known ‘polluted’ area precisely because it was polluted, and in order to see if co2 conformed to agreed limits.
We greatly underestimate the abilty of our forefathers scientific abilities-on which the modern age is founded- if we think that NONE of the hundreds of thousands of measurements from around 1820- when Saussure took readings around Geneva-can be accurate.
The modern level of 295ppm set by Callandar as the 1900 benchmark was an arbritary figure set to support his own theory that Man was responsible for causing the ‘greenhouse’ effect.
I am currently investigating some 15 readings which Beck believes can be termed ‘reliable’ in order to determine if they really are. Until then I would say his work is very interesting but needs to be fully proven.
TonyB
TonyB: Let’s see:
First: the CET temperature record does not come close to being a good representation for global temperatures. 1660 was _not_ at today’s temperatures globally.
Second: CO2 is _not_ the only factor involved in climate change. Everything from volcanoes to solar changes to ocean current changes to orbital changes to aerosols to methane to… well, the list goes on. You need to look at all the known forcings to decide what is responsible for what temperature change. (recently, CO2 has been the largest positive change in forcing, followed by methane and black carbon, with aerosols and the occasional volcano being large negative forcings)
Third: Man-made emissions are small compared to _gross_ natural emissions, but are large compared to _net_ natural emissions. Man is emitting, on average, twice as much CO2 as we see in terms of atmospheric increase, with the balance ending up in the ecosystem and oceans.
Fourth: CO2 does not degrade with a “5 to 50 year” half-life. It goes into three places: the atmosphere, the ocean, and the ecosystem (with a very small component being lost to the system through weathering and deep ocean sediment formation). In the whole system, additional carbon (from fossil fuel combustion) has a half-life due to the weathering component of thousands of years. If you care about the atmosphere, the half-life is complicated, because it will start out fast and then slow down as the various uptake (ocean + ecosystem) mechanisms approach equilibrium with the atmosphere. The common simplification is around 100 years, though again, a half-life is not a good measure.
And again, we know we have accurate measurements at various isolated places around the globe ( http://cdiac.ornl.gov/trends/co2/sio-keel-flask/sio-keel-flask.html ) which all match each other. In none of them do we see more than a few ppm seasonal variation year to year during a 5 decade steady rise. Compare this to Beck’s record, where CO2 jumps all over the place. And there is no theoretical explanation for Beck’s record… other than the obvious one, which is that there were a large number of bad measurements back then.
Marcus
Lets look again
Holocene warm periods at 280 ppm warmer than present
Roman warm periods at 280ppm warmer than present
MWP at 280ppm warmer than present
The middle of the LIA age (I did not say 1660 look at the other periods in the graph) around as warm as present
I think history is telling us something about;
Either
a) The overall importance of CO2 related to temperature
OR
b) Our knowledge of past CO2 readings is faulty
You cant have it both ways;.
In all previous warming instances CO2 wasnt even at the scene of the crime.
I do not agre with your ‘obvious one’. Have you actually studied the history of how and why measurements were taken and the credentials of the numerous scientists who took them. Do you really think our forefathers were that dumb that they couldnt take ANY accurate measurements?
I would be intereested in hearing from you how much and where all the CO2 is sequestered and the relative ‘half life of Man made and natural emissions and also why ‘OUR’ emissions- although smaller than natures- are the ones that distrub the equilibrium
You can also tell me the source of your 1660 ‘Global’ temperatures-the ones these days are a farce let alone any concocted back to 1660.
TonyB.
Marcus (16:01:52) :
And again, we know we have accurate measurements at various isolated places around the globe ( http://cdiac.ornl.gov/trends/co2/sio-keel-flask/sio-keel-flask.html ) which all match each other. In none of them do we see more than a few ppm seasonal variation year to year during a 5 decade steady rise.
In the AIRS data, http://airs.jpl.nasa.gov/ there are up to 15ppm variations of CO2 due to longitude and latidute at a given time, and these measurements are rather high up and not near surface.
I do not trust the measurements of CO2 going thorough the same channels that give us measurements of ground temperatures. If they have managed to make such a mess of such a simple reading as a temperature, I would triple audit any CO2 results.
Anna
I do not trust ice cores that tell us that pre industrial levels were 280ppm for the same reason I don’t trust global temperatures nor the Mann hockey stick-they are all there to give us their version of the narrative of global warming.
It is a fact we know temperatures can be as high or higher than todays at levels said to be 280ppm. If we find that co2 levels could be as high as today that destroys the ice core readings and the narrative. Until I check the 15 readings that Beck have given me I can’t comment as to their accuracy. However I can ceretainly state categorically that the idea that NONE of the thousands of readings taken prior to 1958 are accurate is fanciful in the extreme.
The figures produced by GS Callendar around 1955 were highly selective in order to support his own theory of AGW and Charles Keeling did not have the knowledge at the time to dispute them.
One thing in Becks favour is that he publishes all his references on line, unlike those who refuse to divulge their information and have caused a number of requests to be made under the Freedom of information Acts to try and dig the information out.
TonyB
TonyB
“I do not trust ice cores that tell us that pre industrial levels were 280ppm”
What I am trying to say referring continuously to the AIRS maps, is that maybe the ice core measurements were 280 because they were in regions where there was a dearth of CO2 a la AIRS maps. In addition I would expect that close to the ground/ ocean surface the latitude/longitude differences would be much greater, and considering that ice forms where the temperature is less than 0 centigrade I would expect a huge ocean sink next to that ice that was being formed to be later sampled and measured.
So the ice cores might be accurate, for the arctics.
Anna
Interesting thoughts. Have you ever come across any references to confirm your ideas?
Low co2 readings are recorded at times of historic lower temperatures so would we automatically expect ice cores to reflect that or are we talking two completely issues here?
Any links to articles will be read with interest
TonyB
TonyB
Low co2 readings are recorded at times of historic lower temperatures so would we automatically expect ice cores to reflect that or are we talking two completely issues here?
I think it is two different things, and it depends on whether CO2 is homogeneous over the globe and in the atmosphere. We know the temperatures are not. Up to the publication of the AIRS maps I have not read of anybody seriously challenging this. There have been challenges on the ice core method and whether it retains information from the past or is contaminated by the process of extraction.
When we look at the ice core temperature record do we accept that this is the temperature of the whole globe? Below 4 degrees C? It is the temperature of the region where the ice formed. The same holds for CO2, is all I am saying.
I think that the whole CO2 record is at the stage the temperature records were before the scrutiny of people like Anthony: people trusted the scientific expertise and integrity of the climate science community.
It needs auditing.
TonyB
there is a discussion on CO2 over at a Forum of Lucy
http://www.greenworldtrust.org.uk/Forum/phpBB2/viewforum.php?f=22 .
The format is easier than a blog because recent items come up on the list and it is easier to follow.