Joe D’Aleo, CCM, Fellow of the AMS
It was the eighth warmest June on record for the globe, the National Oceanic and Atmospheric Administration reported Wednesday in the 129 years since records began in 1880. And the first six months of the year were the ninth warmest since record keeping began in 1880, NOAA’s National Climatic Data Center reported. The planet’s average temperature for June was 60.8 degrees Fahrenheit, 0.9 degrees warmer than average for the month.
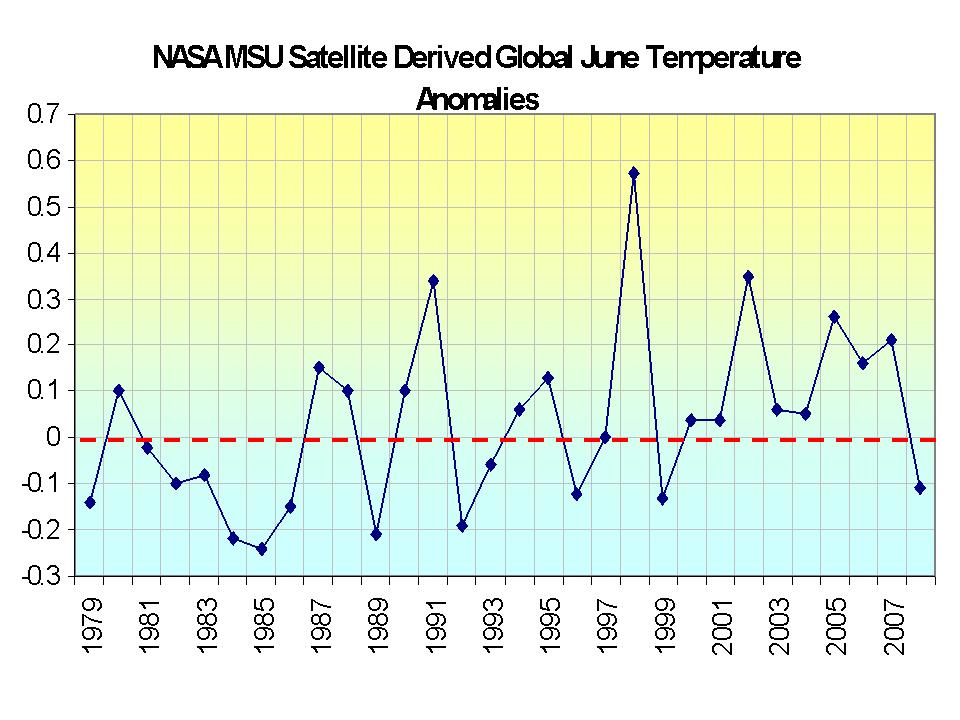
DON’T BELIEVE A WORD OF IT. Just a few days ago, the University of Alabama, Huntsville came out with their global assessment and they reported the 22nd warmest in the 30 years of records in their data base (in other words the 9th coldest). In fact, their global mean was actually below the average (base period 1979-1998 ) with a value of -0.11C (-0.19F). This is a full 1.1F degrees colder than the NOAA guesstimate. The other NASA satellite source, RSS had June as the 13th coldest out of the last 30 years.

NASA MSU June Temperatures since 1979. See larger version here.
The global data bases suffer from major station dropout after 1990 (number dropped from 6000 to less than 2000) and a ten fold increase in the number of missing months in the stations that report. There are serious problems with their algorithms for assessing whether a station is urban or rural and adjusting for local land use changes. There are major siting issues, many of which Anthony Watts, Steve McIntyre and Roger Pielke Sr. have shown have not been properly adjusted for. An old version of a document describing these issues can be found here. Please note the NERON networks plans of NOAA morphed into the Climate Reference Network, a relatively small number (110 if fully implemented) properly sited instrument locations that should provide a better tracking of at least US climate in the future but will not resolve the historical US and current global discrepancies.
Time has come for a major independent investigation of the data sets, compilation methodology and adjustment practices (and records) for the global data sets of NOAA, NASA and Hadley. Steve McIntyre and Anthony Watts are doing their best finding problems but Steve has run into many roadblocks suggesting folks may have something to hide. Meanwhile we will trust only the UAH and RSS.
Try this to see for yourself how bad the global station data is. Go to this site (GISS – virtually the same as NOAAs GHCN), scroll down to the map and click on any region. You will see stations listed – notice the highly variable reporting periods. Start clicking on stations. You will get plots. But before you move to other stations go to the bottom and click on “Download monthly data as text”. You will see for many/most stations numerous “999.9″s meaning missing data. How do you come up with an annual averages when one to multiple months are missing? That is like making beef stew but without the beef. I was told that in many cases the data is available (Environment Canada tells us they have their data we show as missing) but that NOAA and NASA is making no efforts to go out and get it.
Our cry should be after every NOAA press release “Where is the beef?”
So NOAA may similar but not the same as GISTemp.
GISS takes NOAA adjusted data. GISS uses this as its raw data and adjusts it further.
Wow thanks Ed… That was way over my head but I take it that Al’s idea ain’t that great, right?
Yup.
Algore is a divinity school dropout/flunk out. He learned no Science and knows ZERO about Science. He could tell you about how many angels can dance on the head of a pin though; he studied that. He also studied techniques for televangelist, demagoguery.
Did you know that the average nuclear plant requires up to the equivalent of of 8,000 windmills (including up time) to be built to replace a single one? The 100 or so existing nuclear plants equal 20% of our electricity. So the total US generation is about 500 hypothetical equivalent nuclear plants.
Where in God’s name would you put 500 times 8000 windmills, or 4,000,000 windmills? That means we have to construct and make operational ‘only’ 1100 windmills per day, each day, over the next ten years to get to Algore’s target!
Now preacher-man never heard of grid stability. A power grid of instantaneous varying output generators, plus a varying instantaneous demand would within a few seconds collapse, into a perpetual blackout. It would happen long before we got to the 4,000,000 windmills, too. Such sources are variable if the source varies unpredictably. Wind changes, gusts, and unpredictably varies or disappears. Solar varies as the clouds ‘cover ‘ the Sun, intermittently.
And could not be restarted as a grid. It might function as a separated collection of 4,000,000 endpoints not interconnected. Any time a smaller segment, acting as a small grid, had about 20% instantaneous variable generation, it would collapse into oscillation.
This isn’t theoretical. EEs have been taught to face these problems forever. But they had stable generators that could be planned for the rare intermittent operations. No longer, when the generators are all varying, or a significant portion are not stable. It has happened already in Denmark, Netherlands, and in T Boone Pickens chunk of the Texas grid, as well as near collapses in Britain.
The grid wide blackouts occur from grid resonances as power sloshes up and then down power lines, first out of, and then into generators. Circuit breakers trip to protect equipment from the sloshing power overloads, and the grid collapses.
So instantaneous generation can never be more than 20% of the grid. A wart for ‘variable’ generation like Solar and Windmills that was unrecognized by the political Knot-heads.
Incidentally, it is also the reason TB Pickens wants inter-connection to a larger grid, so he can stabilize his windmill portion with more stable generation, to prevent oscillation.
Paul Shanahan (10:46:27) :
If he gets his way and implements all these “Green” powerplants in place at the same time as the globe naturally cools, he is going to claim a victory and chalk it up to sucessfully fighting AGW, which means more political power to his own ends… I don’t like it!
Why else do you really think there is such ‘urgency’ that they insist on acting with, and that they’re getting more and more hysterical? I’m only amazed that they haven’t attributed all the smog in China to the recent cooling…
Earle,
Comparing surface temperatures to temperatures of broad sections of the atmosphere is misleading, don’t you think?
Yes, the surface is included in MSU measurements.
So, conclusions that the GISS or NOAA data are wrong or fraudulent or whatever the skeptics are saying today cannot be supported by the satellite data.
I hope this is clear enough for you.
He could tell you about how many angels can dance on the head of a pin though; he studied that.
That’s an easy one:
As many as God deems necessary (and not one less).
The may be something else to factor in.
This may be NOAA’s version of what the FBI often says minutes after a suspicious incident – “terrorism was not involved.” The FBI says this because they are under a directive to avoid inciting panic.
Similarly, once people connect the dots regarding any serious cooling, there is a panic potential. So instead, it’s “nothing to see here, move along.”
RE:
BerkshireBaz (02:44:10) :
Here in England we’ve just had our coolest June since 1991 (equalled 1999). I think we’re just about to have our coolest July since 1988.
Since you are right where the Gulf Stream is overridden by the Jet Stream, that is truly and deeply disturbing.
Boris:
“Comparing surface temperatures to temperatures of broad sections of the atmosphere is misleading, don’t you think?”
No Boris, as a general trend, I don’t believe that “broad sections of the atmosphere” will show no warming while the surface does warm.
“So, conclusions that the GISS or NOAA data are wrong or fraudulent or whatever the skeptics are saying today cannot be supported by the satellite data.”
It’s not only supported by sattelite data. GISS is diverging from HadCrut3 at a rate of about .13C per decade for the last decade. And it is diverging from the satellite data at the same rate. The satellite data and HadCrut3, on the other hand, are showing very little divergence.
AEGeneral says
“Sorry to keep rehashing this, but going after Mann for nondisclosure of his codes or calling for an independent investigation in a scenario like this are far more feasible alternatives than suing Al Gore. And instances of data manipulation are only going to increase as temperatures continue to drop.”
This boil your bonnett That same group that gave us the “Hockey Stick” has embarked on to “The PR CHALLENGE”. (see climate audit)
I sent the a letter to my senator
July 16, 2008
To:
Senator George Voinovich
524 Hart Senate Office Building
Washington, DC 20510
Dear Sir;
You may be aware of the PR Challenge or Paleoclimate Reconstruction Challenge. http://www.pages.unibe.ch/science/prchallenge/index.html Many scientists of this group are the same “scientists” which give us the famous “Hockey Stick” reconstruction of our past climate. I should not have to remind you of the boondoggle surrounding the hockey stick starting with “We have to get rid of the Medieval Warm Period to any input number resulted in the same graph being reconstructed.
Fool me once, shame on you. Fool me twice, shame on me.
I demand as a tax payer and citizen that:
A) An independent audit done to validate and verify all works from Paleoclimate Reconstruction Challenge before any government body and/or government employee can refer to and/or use in full and/or in part for any government function including the IPCC.
B) If any government funding is used in all and/or part of this reconstruction, the reconstruction shall be subjected to the principle of forecasting as described in Principles of Forecasting handbook.
C) If any government funding is used in all or part of this reconstruction, the reconstruction shall be subjected to the Data Quality Act.
D) If scientist and/or institution that does not comply with independent audit and/or principle of forecasting and/or Data Quality Act shall have his and/or hers and/or institution government funding suspended immediately.
Thank you,
Sincerely,
stas peterson (12:15:51) :
“Algore … could tell you about how many angels can dance on the head of a pin …..”
42. It’s the answer life, the universe, and everything.
“A power grid of instantaneous varying output generators, plus a varying instantaneous demand would within a few seconds collapse, into a perpetual blackout.”
Perhaps the solution there is to have TV broadcast satellites (or GPS satellites) provide a master 60 Hz oscillator and require that all generators that feed the grid sync with that oscillator.
stas peterson (12:15:51)
Excellent insight – we have the same issue with the math over here in the UK
See this from the Sunday Telegraph a leading British Newspaper.
http://www.telegraph.co.uk/news/newstopics/politics/1578171/Christopher-Booker%27s-Notebook.html
(nb – you need to scroll down to the heading – “The great wind scam’s profitability is equalled only by its futility ” – there’s also a piece on the ice coverage beneath it if of interest to anyone).
On a separate issue the debate on biofuels continues and I thought this article may interest others (from the same paper and journalist)
http://www.telegraph.co.uk/earth/main.jhtml?xml=/earth/2008/07/12/eabio112.xml
And boy is it cold in the UK at the moment for July! See it for yourself at the Open Golf Tournament on TV. I was also at the British Grand Prix 2 weeks ago and it was so cold I could see my breath in the air!
[…] wattsupwiththat.wordpress.com Tags: cold, global warming, NASA, NOAA, ocean Related Posts […]
“Perhaps the solution there is to have TV broadcast satellites (or GPS satellites) provide a master 60 Hz oscillator and require that all generators that feed the grid sync with that oscillator.”
As one brilliant Math-CompSci profs of mine once responded to my eager answer to his query of the class:
“That does not pertain.”
Paul H Clark (23:59:16) :
And boy is it cold in the UK at the moment for July! See it for yourself at the Open Golf Tournament on TV. I was also at the British Grand Prix 2 weeks ago and it was so cold I could see my breath in the air!
Tell me about it! It’s meant to be the middle of summer and I still have my winter douvet on the bed and I’m wearing wooly jumpers! I’ve never seen it go dark as early as it is at present for the time of year. It’s constant cloud cover both low and vey high (alternating) and we’ve hardly seen the sun for months.
Here’s another scary story about fuel prices (Apologies Anthony, I realise it’s off-topic)
http://news.bbc.co.uk/1/hi/business/7512971.stm
“No Boris, as a general trend, I don’t believe that “broad sections of the atmosphere” will show no warming while the surface does warm.”
I didn’t say that.
Boris,
You did say this:
“Yes, the surface is included in MSU measurements.”
Let me repeat that, just to make sure I read it right…
Boris: “Yes, the surface is included in MSU measurements.”
I absolutely adore how vigorously you engage in debate when you cannot get the most fundamental aspects correct. MSU does not measure surface temperatures. AVHRR does measure surface temperatures. MSU is incorporated into the RSS and UAH global temperature metrics. AVHRR sea surface temperature is incorporated into the HadCRU, GISS, and NOAA global temperature metrics.
You’ve demonstrated a complete misunderstanding of what measurements are taken and which dataset goes into which metric. Your rants regarding the relative merits of each are built upon this foundation, a crumbling edifice demonstrating an inability to locate and verify information that even a high school student should be able to find, read, and understand. Don’t be surprised then when your babbling is relegated to the junk drawer of cranks, hacks, and yes – deniers.
Moderator comment. Please try and tone down personal attacks~Charles the moderator
“The Advanced Microwave Sounding Unit, (AMSU-A), is a cross-track, line-scanning instrument designed to measure scene radiances in 15 discrete frequency channels which permit the calculation of the vertical temperature and moisture profile from about 3 millibars (~45 km) to the Earth’s surface.” (Emphasis mine.)
http://ghrc.msfc.nasa.gov/uso/readme/amsu-a.html
I think your post speaks for itself, Earle.
[…] Al better work fast, because his ’settled science’ is becoming unsettled, real fast. […]
Boris,
If you can point me to a global temperature metric that incorporates MSU surface measurements I will cede the point in your favor. In the meantime I will note that you now appear to be advocating the position that all satellite systems measure surface temperature. Well done, a complete reversal from your first post in this thread.
[…] to “save the planet”, except take a science course. The end result is a lot of politicking, shoddy science, more taxes, more proposed regulation, intrusiveness, calls for McCarthy-style witch hunts and […]
[…] to “save the planet”, except take a science course. The end result is a lot of politicking, shoddy science, more taxes, more proposed regulation, intrusiveness, calls for McCarthy-style witch hunts and show […]
[…] that have been experiencing record cold this summer. NOAA data is suspect anyway because of the use of surface stations – not just their placement, but even the decline in stations that are even […]