Joe D’Aleo, CCM, Fellow of the AMS
It was the eighth warmest June on record for the globe, the National Oceanic and Atmospheric Administration reported Wednesday in the 129 years since records began in 1880. And the first six months of the year were the ninth warmest since record keeping began in 1880, NOAA’s National Climatic Data Center reported. The planet’s average temperature for June was 60.8 degrees Fahrenheit, 0.9 degrees warmer than average for the month.
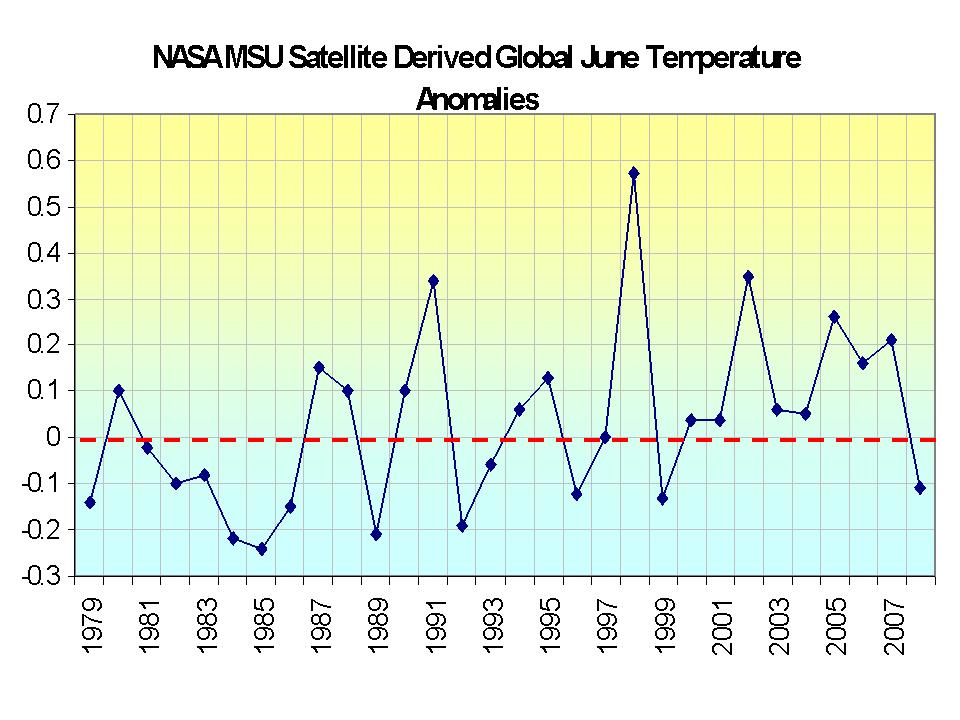
DON’T BELIEVE A WORD OF IT. Just a few days ago, the University of Alabama, Huntsville came out with their global assessment and they reported the 22nd warmest in the 30 years of records in their data base (in other words the 9th coldest). In fact, their global mean was actually below the average (base period 1979-1998 ) with a value of -0.11C (-0.19F). This is a full 1.1F degrees colder than the NOAA guesstimate. The other NASA satellite source, RSS had June as the 13th coldest out of the last 30 years.

NASA MSU June Temperatures since 1979. See larger version here.
The global data bases suffer from major station dropout after 1990 (number dropped from 6000 to less than 2000) and a ten fold increase in the number of missing months in the stations that report. There are serious problems with their algorithms for assessing whether a station is urban or rural and adjusting for local land use changes. There are major siting issues, many of which Anthony Watts, Steve McIntyre and Roger Pielke Sr. have shown have not been properly adjusted for. An old version of a document describing these issues can be found here. Please note the NERON networks plans of NOAA morphed into the Climate Reference Network, a relatively small number (110 if fully implemented) properly sited instrument locations that should provide a better tracking of at least US climate in the future but will not resolve the historical US and current global discrepancies.
Time has come for a major independent investigation of the data sets, compilation methodology and adjustment practices (and records) for the global data sets of NOAA, NASA and Hadley. Steve McIntyre and Anthony Watts are doing their best finding problems but Steve has run into many roadblocks suggesting folks may have something to hide. Meanwhile we will trust only the UAH and RSS.
Try this to see for yourself how bad the global station data is. Go to this site (GISS – virtually the same as NOAAs GHCN), scroll down to the map and click on any region. You will see stations listed – notice the highly variable reporting periods. Start clicking on stations. You will get plots. But before you move to other stations go to the bottom and click on “Download monthly data as text”. You will see for many/most stations numerous “999.9″s meaning missing data. How do you come up with an annual averages when one to multiple months are missing? That is like making beef stew but without the beef. I was told that in many cases the data is available (Environment Canada tells us they have their data we show as missing) but that NOAA and NASA is making no efforts to go out and get it.
Our cry should be after every NOAA press release “Where is the beef?”
Kevin Ve3en, on his blog Solar Cycle 24, has characterized NASA’s real mission as funneling billions of dollars in tax money to software producers.
Thanks Anthony for giving us this information.I checked out my state ,n.c., and was suprised to find out how much missing data ther is .Take banner elk which is located in the mountains .There practially is no data , or missing ,for that area over the last five years.How does they have a clue what temperature it really was there .And look at Raleigh .They are warming up big time . But then you look at Darlington S.C and they are cooling off .How can Raleigh be that much warmer than Darlington .
When the data doesn’t say what you want it to say, just make it up. Pay more taxes so government can pretend to control the weather — This is part of the “pretend”.
The fact remains, government can fake the data, but they can’t fake what the sun does next.
baconman asked, then how can you explain yearly global temperatures that do not consistently go upwards every year, to which I remind everyone:
The atmosphere is a chaotic, complicated system. Features of on a short time scale – weather – can vary dramatically both in time and in space. Features on the long-term scale – climate – must be analyzed separately. Because it is understood that the climate has an intrinsic variability due to weather, it has never been suggested that the temperature must monotonically increase year after year. There will always be noise superimposed on the temperature signal, and it takes more than just “eyeballing” ten years of data to make a qualitative statement about climate trends.
I just looked at Chapel Hill n.c. and there annual mean temperature is 15.5 and Raleigh , which is part of the trangle Raleigh , Durham Chapel Hill,is showing an annual temperature of 17.There ‘s no way this is right. Just looked at Winston Salem, which is 30 miles from my home town, thier data stops at 1965 .
To add to Tom in Florida’s SSt observation, check out the latest mean sst anomolies, http://www.osdpd.noaa.gov/PSB/EPS/SST/data/anomnight.7.17.2008.gifit shows clearly the cooling off sst by ex hurricane Bertha.
Maybe I’m going to sound like some type of heretic, but NOAA may be right. They have moved the goal post (once again) by using their 129 years of recorded (and Hansenized) database as opposed to the 1979-1998 base everyone else is using. So in a sense, they may be right… I haven’t checked.
Regardless, it’s deceitful and manipulative. Something the Lamestream Media (ABCNNBCBS) relishes.
Jack Koenig, Editor
The Mysterious Climate Project
http://www.climateclinic.com
Wanna bet on the red or on the black? Spending trillions on climate change, something that has always happened and always will, and which we have little impact on, and thus can’t do anything about (except adapt) is sheer stupidity. Bet with your own money, not ours. Oh, that’s right, we’ll be forced to pony up regardless, and with mobsters like Big Al and Hansen, the MSM and political hacks running the show we’re all screwed. But guess what. Not only are we no longer warming, but cooling. You see, the king of climate change just happens to be the sun. And old sol is about to put the aforementioned crooks out of business (and hopefully in jail).
This is a mess. Go and look for yourself. How can anyone at NOAA/NASA keep a straight face when releasing this data?? Unbelievable. Are they not accountable to an oversight committee? Who’s in charge? Is there anyway to get to the bottom of this? Meanwhile, trust only the two independent and agreeable data sets, UAH and RSS.
“Oldjim: Also irritatingly interesting that all the 10 warmest years are among the 12 most recent years, whatever that might tell us…”
That tells me that temperatures peaked and then remained flat. I looked at the chart…
It could also mean that the temperatures are still rising,
or that the temperatures are cooling…
on the top of a oscillation all the points leading up will be in a range equal to the points leading down, this results, when viewed on a time scale point near the top, of a clustering of highs derived from the most recent points, so this claim will remain true even if the temperature falls at the same rate of rise.
What I am saying is that it is a rather strange metric to use.
Mike Keep,
Interesting to compare the gif showing SST in July 2005 from the same site. http://www.osdpd.noaa.gov/PSB/EPS/SST/data/FS_km5000.gif I wonder why we could get temp reading in the Antarctic (cooler) in 2005 and it appears as a huge ‘white space’ of no readings in 2008?
I can tell you that nearly all rural stations in Australia have no data after 1992 recorded in the GISS datasets. Nearly all Australian non-rural (cities and major towns) stations have their data recorded to the current year (2008). What does that say about the accuracy of their calculations? It doesn’t just apply to Australia. It also applies to much of Russia, China, Asia generally, Africa and South America.
There will always be noise superimposed on the temperature signal… Exactly, counters, and that is all that human-produced C02 is, noise. It is of no significance. C02’s role in climate is minor, although important. What it basically acts as is a climate stabilizer, although it pales in comparison to the oceans’ stabilizing effect.
I think we’re reaching a turning point…
Myth of Consensus Explodes: APS Opens Global Warming Debate
The American Physical Society, an organization representing nearly 50,000 physicists, has reversed its stance on climate change and is now proclaiming that many of its members disbelieve in human-induced global warming. The APS is also sponsoring public debate on the validity of global warming science. The leadership of the society had previously called the evidence for global warming “incontrovertible.”
Fraud: Misrepresentation or material omission; scienter; damages; reliance. Three out of four.
Hardest to prove would be scienter, but an independent investigation might at least reveal a reckless disregard for the truth, which would qualify.
Sorry to keep rehashing this, but going after Mann for nondisclosure of his codes or calling for an independent investigation in a scenario like this are far more feasible alternatives than suing Al Gore. And instances of data manipulation are only going to increase as temperatures continue to drop.
This is never going to end until somebody pushes the issue.
Good ole Al is at it again. Does anyone, anywhere really think this is a good idea?
http://www.physorg.com/news135511498.html
Boris…
Yes, of course, satellites do not measure surface temperature (right at the surface). However, if the earth is warming due to the greenhouse effect, it should be (and has been) reflected in the lower troposphere as well as the surface. If you look back over the past 30 years, you will see that satellite temperatures generally follow the same trends as surface data. However, there has been some diversion from that in the past 10 years, mainly with GISS/NOAA.
So, if the satellites are showing much cooler temperature anomalies in the lower troposphere than the surface data (base periods accounted for), then something is wrong. Considering the fact that surface data is much more susceptible to bias and significantly lacks coverage, it would be reasonable to trust the satellite data more.
A quick check of GISS, June08 was the coolest June since 1996… So NOAA may similar but not the same as GISTemp.
“So, if the satellites are showing much cooler temperature anomalies in the lower troposphere than the surface data (base periods accounted for), then something is wrong.”
Well, what was wrong in 1998 when satellite temps were higher than surface temps? Lower tropospheric temperatures respond more strongly to el nino and la nina events.
Considering the slew of major corrections to satellite analyses, I don’t think it makes sense to trust satellites more. And it certainly doesn’t make sense to compare MSU temps to surface without a clear discussion of the differences in the metrics.
Mike Bryant (09:52:55) :
Good ole Al is at it again. Does anyone, anywhere really think this is a good idea?
http://www.physorg.com/news135511498.html
Do you know what really scares me about this type of thing? If he gets his way and implements all these “Green” powerplants in place at the same time as the globe naturally cools, he is going to claim a victory and chalk it up to sucessfully fighting AGW, which means more political power to his own ends… I don’t like it!
Boris: So what you are saying is that all the data is bad, satellite and ground, and we don’t really have a handle on whether the earth is cooling or warming or anything. Do you think we should implement CO2 controls that impoverish and enslave the world based on no data….?
“Boris: So what you are saying is that all the data is bad, satellite and ground, and we don’t really have a handle on whether the earth is cooling or warming or anything.”
No. I’m not saying that.
You do realize that satellites do not measure surface temperature, right?
Neither do surface stations, as it turns out.
Mike Bryant,
There is about 500 GW of coal-fired generation in the US. There is also about 200 GW of natural gas-fired generation in the US. If we assume that the average plant has reached mid-life and that the installed cost of those plants averaged ~$1.5 billion per GW, the economic “dead loss” of removing those plants from service would be approximately $525 billion. Most of those plants are baseload or intermediate load plants.
The available base load and intermediate load power generation technologies include nuclear, geothermal and hydro. Solar and wind are not baseload or intermediate load technologies. They are not capacity replacement technologies; they are commodity replacement technologies. They are “source of opportunity” power.
Current estimates for new nuclear plants are ~$6 billion per GW. The chances of major new hydro being built in my lifetime are somewhere between slim and none. The technology for dry hot rock geothermal is not commerically available. Therefore, the investment required to replace the ~700 GW of coal and nuclear generation with commercially available technology (nuclear) would be ~$4.2 trillion. Therefore, ~$5 trillion is a better estimate than $3 trillion, including the dead loss.
However, the liklihood that the permits required for the construction of 700 GW of new generation of any type, no less nuclear, could be approved by state and federal regulators and processed through the appeals processes in the regulatory agencies and the courts within a 10 year is also somewhere between slim and none.
Just for giggles, theoretically, wind turbines with 25% availability could provide baseload power if 8 wind turbines of a given capacity were installed in 8 carefully selected locations which rarely if ever were impacted by the same weather patterns for each unit of that given reliable capacity required. Alternatively, 5 of those wind turbines plus storage (not yet commercially available) capable of storing their entire output could reliably provide the capacity of 1 of those wind turbines.
The answer, my friends, is not “blowin’ in the wind”.
Boris said
“You do realize that satellites do not measure surface temperature, right?”
As usual he is at best half right. The sea surface temperature measured by satellite uses the AVHRR. Please note the word “surface” in that phrase.
http://noaasis.noaa.gov/NOAASIS/ml/avhrr.html
Boris is a troll par excellence, whether professional or amateur. Notice how in his posting of 10:59:02 that he completely avoids specifiying what he is saying. Unless he brings real material to a discussion rather than aspersion and innuendo there’s no benefit to be gained by engaging in his shadow debates.