Joe D’Aleo, CCM, Fellow of the AMS
It was the eighth warmest June on record for the globe, the National Oceanic and Atmospheric Administration reported Wednesday in the 129 years since records began in 1880. And the first six months of the year were the ninth warmest since record keeping began in 1880, NOAA’s National Climatic Data Center reported. The planet’s average temperature for June was 60.8 degrees Fahrenheit, 0.9 degrees warmer than average for the month.
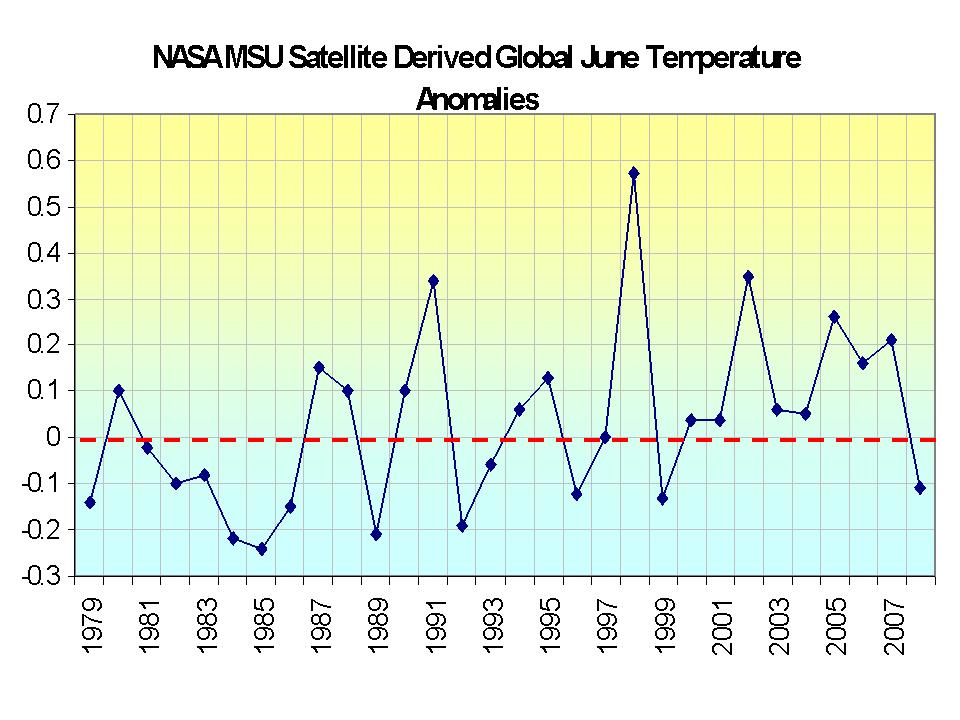
DON’T BELIEVE A WORD OF IT. Just a few days ago, the University of Alabama, Huntsville came out with their global assessment and they reported the 22nd warmest in the 30 years of records in their data base (in other words the 9th coldest). In fact, their global mean was actually below the average (base period 1979-1998 ) with a value of -0.11C (-0.19F). This is a full 1.1F degrees colder than the NOAA guesstimate. The other NASA satellite source, RSS had June as the 13th coldest out of the last 30 years.

NASA MSU June Temperatures since 1979. See larger version here.
The global data bases suffer from major station dropout after 1990 (number dropped from 6000 to less than 2000) and a ten fold increase in the number of missing months in the stations that report. There are serious problems with their algorithms for assessing whether a station is urban or rural and adjusting for local land use changes. There are major siting issues, many of which Anthony Watts, Steve McIntyre and Roger Pielke Sr. have shown have not been properly adjusted for. An old version of a document describing these issues can be found here. Please note the NERON networks plans of NOAA morphed into the Climate Reference Network, a relatively small number (110 if fully implemented) properly sited instrument locations that should provide a better tracking of at least US climate in the future but will not resolve the historical US and current global discrepancies.
Time has come for a major independent investigation of the data sets, compilation methodology and adjustment practices (and records) for the global data sets of NOAA, NASA and Hadley. Steve McIntyre and Anthony Watts are doing their best finding problems but Steve has run into many roadblocks suggesting folks may have something to hide. Meanwhile we will trust only the UAH and RSS.
Try this to see for yourself how bad the global station data is. Go to this site (GISS – virtually the same as NOAAs GHCN), scroll down to the map and click on any region. You will see stations listed – notice the highly variable reporting periods. Start clicking on stations. You will get plots. But before you move to other stations go to the bottom and click on “Download monthly data as text”. You will see for many/most stations numerous “999.9″s meaning missing data. How do you come up with an annual averages when one to multiple months are missing? That is like making beef stew but without the beef. I was told that in many cases the data is available (Environment Canada tells us they have their data we show as missing) but that NOAA and NASA is making no efforts to go out and get it.
Our cry should be after every NOAA press release “Where is the beef?”
I am getting the impression that KGO 7 (San Francisco) is very selective in its reporting of climate news. A few weeks back when the data came to light showing the cooling trend year over year, the M-A-M mean, and the June data, KGO did not cover the stories despite my sharing the sources with Dan Ashley and Cheryl Jennings (Cheryl and I go way back). Yet this NOAA release talking near record warming despite the wealth of other, better data, get covered.
Bias in the media?
REPLY: If it bleeds it leads, if it doesn’t burn its spurned.
“If it bleeds it leads, if it doesn’t burn its spurned.”
Okay, so how do we get more coverage for things near and dear to people’s hearts?
The California grape crop is in trouble I hear, or at least late.
Packing hot water bottles around babies in Tajikistan because the feedwaters to the hydro plant froze would be good, but who’d want to go there to report?
The recent corn crop problems in Brazil – combine that with a piece about rainforest being cut down for biofuels would be good.
And why did that kidney stone story take of in July but not May?
I suspect there will be plenty of stories in New England about people turning down the heat to pay for food and going hungry to keep the heat on, but that will happen regardless of the temperature.
Where’s the beef? indeed. After peeking in at the GISS site you’ve got to wonder how they can tell much of anything to any degree of reliability. Missing data and loss of hundreds of stations. Each month after the data comes in keeps my confidence in UAH & RSS high as well my skepticism of GISS.
I wonder what is going to become of the CRN?
Someone please correct me if I am oversimplifying this, but I just don’t get it. If CO2 is THE big cause of global warming as we’ve all been told repeatedly, and if the CO2 levels have increased every year, and if this is supposed to be a positive feedback loop mechanism, then how can you explain yearly global temperatures that do not consistently go upwards every year? I don’t think one can play both sides of the fence with this and say it is the big warming molecule and then say that you can’t just compare one lower year to the rest (i.e. it will average out). If global temperatures don’t increase for this year, then shouldn’t something be wrong with the model to begin with? Shouldn’t this mean that either A. perhaps CO2 is not the big driver of global warming, or B. perhaps there is another molecule that impacts global cooling to a greater degree than CO2 warms?
It’s a cry from my heart. An old heart looking through old eyes at the bright, fresh face of expectation of a year-old grandson: Wrest their influence from them…
Vested interests are warping science, and warping our lives.
Bald-faced lies are being projected into the consciousness of the western word with the full power of some massive conglomerate of evil intent for… what purpose? Egomaniacal satisfaction? Punishment as some kind of payback to life’s losers? The bitter claiming some semblance of satisfaction for their personal pain?
There would be enlightenment in learning the stories of their childhood. Just what went so wrong then that they must dedicate their adult lives to making all others suffer for their both real and imagined pain.
Wrest their influence from them. Wish them no harm; but remove them from influence and let mankind surge on in glorious adventure.
Can anybody in the US sue NOAA oder inviduals at NOAA for providing misleading data ?
This is a significant source of data for global political, economic and individual decisions including taxation or personal spending for protection against rising sea-level etc.
If this data is misleading, and for example not generated according to NASA standards or any other ethical or professional standards, isn’t there a personal responsibility for the damage or unnecessary expenses ?
The thing is, if this was only about the Climate, it would be simple…. All we would need to do would be to look at the facts and the empirical evidence….
But it isn’t about climate…. It’s about Socialism, that and rampant bureaucracy.
And NOAA et al are really playing the politicians for patsies.
It is silly there is so much controversy over June 2008. Did you know NCDC said that this past March was the second warmest on record, and the warmest on record in the Northern Hemisphere by far? I s*** you not. The biggest reason it is different is because NCDC measures surface air for 29% of the planet’s surface, and measures water temperature for the remaining 71%, and calls it a “global temperature”, despite combining two completely different things in different amounts.
Two more things I will add. The most dramatic differences aren’t over land, but over the Atlantic Ocean, where UAH and RSS show near normal and NCDC shows much above normal. And no, it is not differing base period, it is different methods, and the one that is better is the satellite, because it measures lower tropospheric air over the whole globe, and NCDC measures the water and surface air. Finally, NCDC is awfully close to GISS in warming trend, but it may have just overtaken it:
http://junkscience.com/MSU_Temps/NCDCanom.html
http://junkscience.com/MSU_Temps/GISSglobal.html
Out of interest I checked the Hadcrut data for June and sorted by temperature with the following result – comes out as the tenth warmest
1998/06 0.604
2005/06 0.512
2002/06 0.475
2006/06 0.443
2003/06 0.439
2001/06 0.415
1997/06 0.377
2007/06 0.375
2004/06 0.347
2008/06 0.314
1995/06 0.287
1991/06 0.286
1999/06 0.264
1990/06 0.234
2000/06 0.232
1994/06 0.216
1988/06 0.207
1941/06 0.167
Here in England we’ve just had our coolest June since 1991 (equalled 1999). I think we’re just about to have our coolest July since 1988.
Mr. Carr,
Very good post……The only thing that I could add would be for all of us to forward information like this to family, friends and colleagues through E-mail and word of mouth.
This is the only way that I know of to by-pass the obviously biased press and those that would profit by espousing the “global warming” fraud.
I still don’t get your methodology. What’s the probability for type A vs. B error here (null hypothesis= there is no overall global warming or cooling; specific hypothesis= there is one; type A error=to claim there is a global warming or cooling while there is not; type B error: to claim there is no global warming/cooling while there is one) ?
I would like to see such a sound analysis on existing data.
More importantly: what about the impact of these errors? (type A error impact= the world is ready for something terrible that will not happen any time soon; type B error impact=the world is not ready for something terrible that’s already in the pipeline).
Wanna bet on the red or on the black?
Oldjim: Also irritatingly interesting that all the 10 warmest years are among the 12 most recent years, whatever that might tell us…
Does an average temperature really mean anything? NOAA says the average temp for the month of June is 60.8. How many places on Earth were actually 60.8 degrees for any length of time? My bet would be none.
Just in: water temps off the Gulf coast of central Florida have gone down about 5 degrees because of several days of rain and cloud cover. They will go back up to the normal 89 degrees after a couple of days of sunshine. Would that change the average SST for this area during July. I’ll bet it does. Does it mean anything other than we had several days of cooler weather due to a strong, lingering low pressure center in the area? Nope. Of course in a couple of years one would look back and say July 2008 was cooler than the norm of base period whatever, forgetting that the reason was those days of rain and cloud cover.
So the question is :
Is this a case of :
A) Total incompetance
B) Deliberate and planned fraud
…or,
C) Both of the above.
Has a PhD ever won a Darwin Award?
How do you pump out a “GISS-pool”?
Enquiring minds want to know.
9th warmest vs 9th coldest?
NOAA must be using the “New Math”
UAH T=actual reading
NOAA T=A + ( B/2 x 567 / 192 + 2^1 – 1000 x 1 ) x ( if Y < 2000 then – 50 else + 50 ) /2 + 3939 – 3939) + 1
see it’s easy to get 2008 to be the 9th warmest.
“Can anybody in the US sue NOAA oder inviduals at NOAA for providing misleading data ?”
No, but there is something called Congressional Oversight. For obvious political reasons you will not hear a single complaint from the responsible sub-committees.
Didjeridust (04:31:12) :
Not really surprising as all the metrics show that the average global temperatures in the last 10 years have been higher than average including UAH for example. The difference between the satellite based numbers and the ground stations is on the extent of the drop this year. This must, in part, be due to the significant gaps in station coverage with the ground based stations
Baconman, CO2 is NOT the most important greenhouse molecule; water vapor (95%) is. The total human contribution to the Greenhouse Effect is 0.3%, hardly what one would call a major contribution. Look up “Coconuts In Wyoming?” for a breakdown. And if there is a positive feedback mechanism, how can the observed fact that the planet has remained within acceptable limits for multicellular life for over half a billion years, despite wildly varying atmospheric conditions, be explained?
I checked several sites in Eastern Wisconsin and the results were truly bizarre. 2008 had the coldest Winter in memory, a late Spring and now a chilly Summer, but GISS is showing the temperature the same or increasing from 2007.
Are the values shown at the GISS site raw numbers or manipulated? Is there a list of street addresses for the stations so I can do my own sleuthing?
You do realize that satellites do not measure surface temperature, right?