GISS Ts+dSST Numbers Are In

by John Goetz

The GISS Ts+dSST numbers are in.

June comes in at 26, continuing the downward trend at GISS and making it the seventh lowest anomaly this decade.

Lots of history was rewritten by the June temperature, with 89 monthly adjustments upward and 22 downward. Most of the downward adjustments were made this decade, and most of the upward adjustments were made pre-1941. At an annual level, 9 years before 1928 were adjusted upward, and 2007 was adjusted downward.

As for 2008, Jan and Feb were unchanged, Mar up 2, Apr up 1, and May up 3. The uplifts in M-A-M surprised me some, because I would have expected out of season months (such as June) to have no effect. Such is the GISS method.

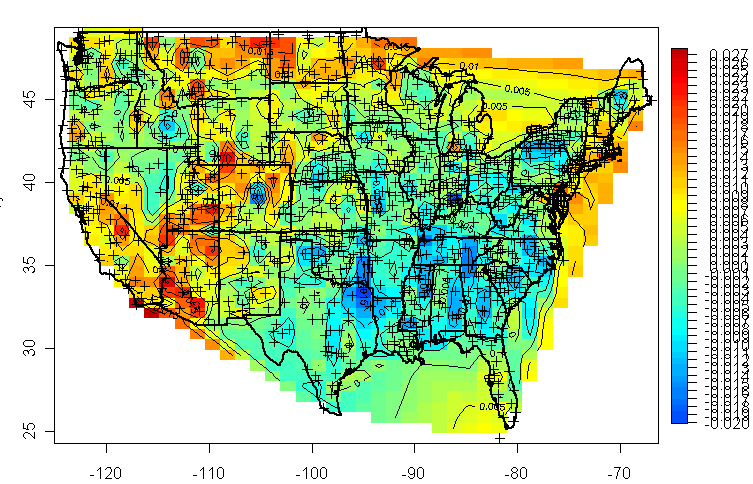
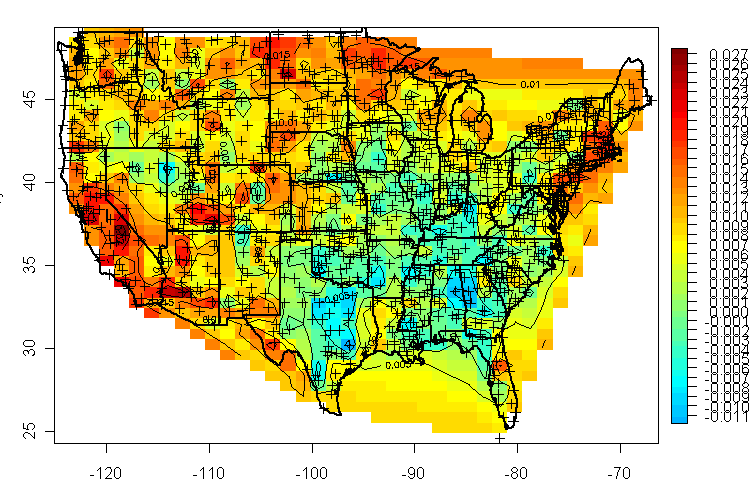
I will post up a plot later today, unless Anthony beats me to it (I like his format).

REPLY: Go for it. I’m jammed up today, fires are threatening again. 1/4 mile visibility due to smoke.

Added reference: A number of comments ask why the historical numbers change. I wrote a post on that earlier this year, which was publicized on this blog and Climate Audit. I am not saying it is OK that they change, only describing why they change.

The climate data they don't want you to find — free, to your inbox.
Join readers who get 5–8 new articles daily — no algorithms, no shadow bans.
0 0 votes
Article Rating
80 Comments
Evan Jones
Editor
July 9, 2008 1:23 pm

Or is the raw data simply not available any more?
It is. But NASA/GISS raw data = NOAA adjusted data.
NOAA raw data must be available because they show a before/after adjustment map. Not for public consumption, of course! (If the public could see it, they’d be marching up to Abbeville (or wherever the hell) with torches, flails, and pitchforks.) The Rev has it though, and posted it a couple of months ago.

Stevie B
July 9, 2008 1:29 pm

Can someone please explain to me why they adjust temperatures every month? I understand them trying to adjust for the terrible placement of climate stations, but why adjust past data based on current data. Lastly, why adjust it every month?

Keith
July 9, 2008 1:32 pm

Robert Wood, I couldn’t agree with you more. That is the mathematical definition of average. The problem, of course, is that with most of the historical data, all we have is the high and the low. No records of additional data points available. In order to be able to use same method comparisons for averages, they only worry about the high and low with the modern data. That allows them to say they are following historical trends. It isn’t necessarily reflective of reality, but it gives the illusion. You also have to remember that the temperature listings being used are monthly, seasonal, and annual averages, which even further skew data points.
I would much rather they put the data from 1902 to one side, and concentrate upon the more current data where we have more data points for a day to use. The trend length might not be as long, but temperature values would be more indicative of heat and we might get better predictive ability.

Pierre Gosselin
July 9, 2008 1:34 pm

Bob Tilsdale,
LOL! Yes, and you’ll recall what Hansen was saying before Congress exactly 20 years ago. It’s just too amazing.

Evan Jones
Editor
July 9, 2008 1:36 pm

fred: As for NOAA/USHCN adjustment procedure, if you want to raise AGW by having your blood boil, check this out:
This is the USHCN-1 method.
Adjustments 1900-2000:
http://www.ncdc.noaa.gov/oa/climate/research/ushcn/ushcn.html
http://www.ncdc.noaa.gov/img/climate/research/ushcn/ts.ushcn_anom25_diffs_pg.gif
Results:
Map of Raw Temperature (USA)
http://www.climateaudit.org/wp-content/uploads/2007/06/usgrid79.gif
Map of NOAA-Adjusted Temperature (USA)
http://www.climateaudit.org/wp-content/uploads/2007/06/usgrid81.gif
Before you calm down, let me emphasize that the USHCN-2 is out now, and the adjustments are even worse. (Up to +.425°C trend adjustment from +.30°C) But they are MUCH too smart to provide a graph (or maps) this time around!
The best that I can put together is that they carefully account for the CRN1/2 to CRN4/5 differences–by “adjust” the CRN1/2 results to fit the others! Then they show a graph about how proud they are that their fine adjustment procedure “fixes” station quality, so go away, you denier, you!

Evan Jones
Editor
July 9, 2008 1:41 pm

Can someone please explain to me why they adjust temperatures every month?
I think it’s because they like to keep their options open? If they do it every month, then they can, effectively say anything at any time. And go, “…..What?” if anyone objects.
The story (poss. apoc.) is that the beastly Sovs used to send the British government a new Soviet Encyclopedia every year which included instructions as to what articles to add and cut out of the old ones.

leebert
July 9, 2008 1:45 pm

Gary Gulrud:
Do these include those FUBARd Soviet-era weather stations that habitually exaggerated their wintertime lows in order to qualify for more fuel subsidies?

July 9, 2008 1:53 pm

Don’t assume malice when stupidity will explain it.
Corollary: …Unless reputations and big, big bucks are involved.
Question: Does GISS provide the historical raw data along with the cooked data? If so, for how far back does their raw data go? Is it archived online?
Also, Gary mentions the old mercury thermometers [usually about 30″+/- long, with sliding magnifiers and 1/100th degree reticles] were by far the most accurate. They are more accurate than today’s thermocouple/datalogger setups, because thermocouples have inherent hysteresis; mercury thermometers don’t. Something to consider when tenths/hundreths of a degree matter.

fred
July 9, 2008 2:15 pm

— Paul Clark
Yes basically this is blowing up. Or this piece of it is, the UHI piece. No-one could assess Jones’ claims as long as the stations were kept secret. When they found the Chinese names out, after FOI proceedings in the UK last year, it turned out they likely were heavily contaminated with UHI. So now we have the Russian ones, and we must see whether they too are contaminated or are lacking adequate histories.
It always did seem odd that in studies the ROW station record showed so much more warming than the US station record. Now that the names of the stations have been revealed after 15 or 20 years, we can for the first time check into why this should be.
REPLY: I may need to go to Russia to solve this issue. -Anthony

Diatribical Idiot
July 9, 2008 2:17 pm

Well, I’ve thrown up my monthly analysis and charts related to the GISS temps here: http://digitaldiatribes.wordpress.com/2008/07/09/july-2008-update-on-global-temperature-giss/
Joe

fred
July 9, 2008 2:25 pm

Some people are asking why the past should change all the time. Well, you have to be a physicist to understand this, its a quantum mechanics matter, but here is a journalistic explanation for lay readers. You see, with temperatures, the act of observing affects them. This means that if you know when the temperature was recorded, you can only tell in a probabilistic way what it was. Obviously therefore the observation will change as surrounding data points are observed. You may not have quite followed this last step, but its as I say a quantum matter.
Its one of the things that makes climate science so difficult, and why we should particularly respect people like Hansen who struggle with this sort of thing every day.
Its almost as bad if you find you do know the temperature exactly. Then you can only tell in a probabilistic way when it was measured. This is why its so hard to establish what the warmest years of a given period were, and why it changes all the time. Its not the temperatures that were moving around, but the dates.
Its a bit like the husbands some of us used to have. If you knew where they were, you did not know what they were doing. If you knew what they were doing, you could only tell in probabilistic terms who they were doing it with. As to when they had done it, well, probably in the lunch hour. But not always.
Do you see now?
REPLY: For laymen readers, this is satire. -Anthony

Diatribical Idiot
July 9, 2008 2:27 pm

“It is still unfathomable to me that historical data is revised every month.”
I can actually think of a reasonable reason to do so. I am not saying the GISS approach is reasonable, just that I can see a theoretical reason why it isn’t a problem.
Suppose you take measurements with a crude instrument until year X. In year X, you are able to take more accurate readings with a new instrument. Or, perhaps you used to take readings only twice a day, but the new instrument is able to take a proper 24-hour average. If you continue to take readings using both instruments from year X forward, each new month provides more information on how the crude instrument deviated from the new one. And, perhaps with further analysis, it can be shown that these deviations are of different magnitudes depending on certain conditions. With each new bit of information, then, the old data can be adjusted to give what can reasonably be considered to be a more accurate adjustment of the old readings to the current technology.
Again, I’m not saying that this is what has been done, or even if it is, that it has been done correctly. But it is a plausible argument in favor of making historical adjustments.

Admin
July 9, 2008 2:32 pm

Their reasoning is something like that–JG knows it thoroughly, I’m just a dumb moderator.

Editor
July 9, 2008 2:34 pm

In the article, Anthony ponders:

The uplifts in M-A-M surprised me some, because I would have expected out of season months (such as June) to have no effect. Such is the GISS method.

I wouldn’t be at all surprised that since the last release some late May data also arrived. If so, then that data would apply to the M-A-M GISS I-can’t-believe-they-do-that data adjustment for past M-A-Ms.
Just another uplifting GISS experience and yet another qualification in trying to keep track of data to reproduce past analyses.

Brendan
July 9, 2008 2:47 pm

What Diatribical Idiot is refering to is either a boostrap method or a Bayesian method. Both are common statistical treatises, but I would think that after a certain amount of time enough data form the new reliable statistical distribution would have been collected, resulting in very little change in the posterior (or newly estimated) result. It would be interesting to see if they were actually using this – perhaps John mentioned it in the preceeding post – I’ll have to go and look.

Gary Gulrud
July 9, 2008 3:50 pm

fred: You had me going.

Gary Gulrud
July 9, 2008 3:53 pm

leebert: Sorry, you’re beyond my pay grade.

Robert Wood
July 9, 2008 4:14 pm

Fred, to continue in all innocence, this is precisely the problem that Hansen has: climate is always changing, all over the place, all the time, in a probabalistic fashion.
He needs it to change upwards, all over the palce, all the time, so you can imagine the stress of his job and the fast-footedness of his statistical adjustments of data.

Steve Moore
July 9, 2008 4:28 pm

Fred, Anthony,
It made perfect sense to me.
It reads like something from “The Dancing Woo-Woo Masters”.

Philip_B
July 9, 2008 4:45 pm

Unconcious bias is well documented and widespread in science. If you study science at university, you get drummed into you that you have to construct your experiments to minimize unconcious bias. Adjusting data is a big ‘no no’ for this reason.
Which is not to say the temperature adjustments aren’t justified, but they need to be done in a transparent auditable way.
And if you think the situation is bad in the USA, it’s worse in other countries where they won’t say whether they even adjust the data, never mind, by how much.

July 9, 2008 4:49 pm

Actually, THIS may be Hansen’s problem.

July 9, 2008 5:23 pm


Would that be the Hansenberg Uncertainty Principle???
I view GISS temperature record more like the cat in Schrodinger’s box and the current monthly temperature as the random quantum fluctuation that releases Hansen. The observer is unable to know the actually state of the GISS record until they open the box and GISS record collapses into a series of positive and negative adjustments.

Robert Wood
July 9, 2008 5:34 pm

Hey, thanks to thopse who answered my question re: median v. av erage temperature.
I was right (yeah :-)) but this measure is kept for historical reasons.

John D.
July 9, 2008 5:42 pm

These measurement/data problems may be telltale of limits in our technological abilities. Perhaps observation of long-term trends in species distribution (altitude, latitude, temporal) are more revealing to actual trends. Could these highly evolved natural systems be more sensitive to climate trends than our timeframe-sensitive, technology-based perceptions? Maybe they are also too noisy; I guess we’ll find out.
Jd

Editor
July 9, 2008 6:17 pm

Robert Wood (12:54:34) :

The “average” daily temperature is taken to be (highest + lowest )/2. Isn’t this, rather the median temperature? Isn’t the average a more important indicator, but would require integrating the temperature samples over the day and then dividing by the number of the samples. Wouldn’t this give a different result, more indicative of the heat of the day?

All this has been answered, but a personal empirical note applies. For a while I had a surplus thermograph that dad had rescued from work. (Nice big industrial style round charts with thermocouples and vacuum tube amplifiers. None of this search for an hour looking for the USB stick you dropped.) When I went to college I keypunched several months of data for each 3 hours and wrote various Algol programs to produce “ASCII art” graphs and whatnot.
One thing I did was to compare (max+min)/2 and average of 3 hour periods (half weighting each to the 0000 and 2400 readings). I was moderately surprised at how well they matched. Only in some of the obvious situations, e.g. winter cold front passing right after midnight so that 0000 had the high for the day was the data obviously bad.
The difference was typically a few tenths of a degree, IIRC, so I’d be very reluctant to mix both styles into any climate change analysis, but for producing climate atlases and other low precision documents, I decided it was close enough for government work.
All this data was from northeastern Ohio, but probably holds in most other areas. Perhaps not coastal with summer seabreezes, but perhaps it does.
40 year-old data. I know I don’t have the punch cards, but I might have it on listings still.