Since I’m traveling at the moment at have a combination of occasional Internet connectivity and exhaustion, I’ll defer to Joe D’Aleo’s excellent writeup on UAH, RSS, GISS, and HadCRUT. – Anthony
Global Data All In – NASA GISS Biggest Outlier Again
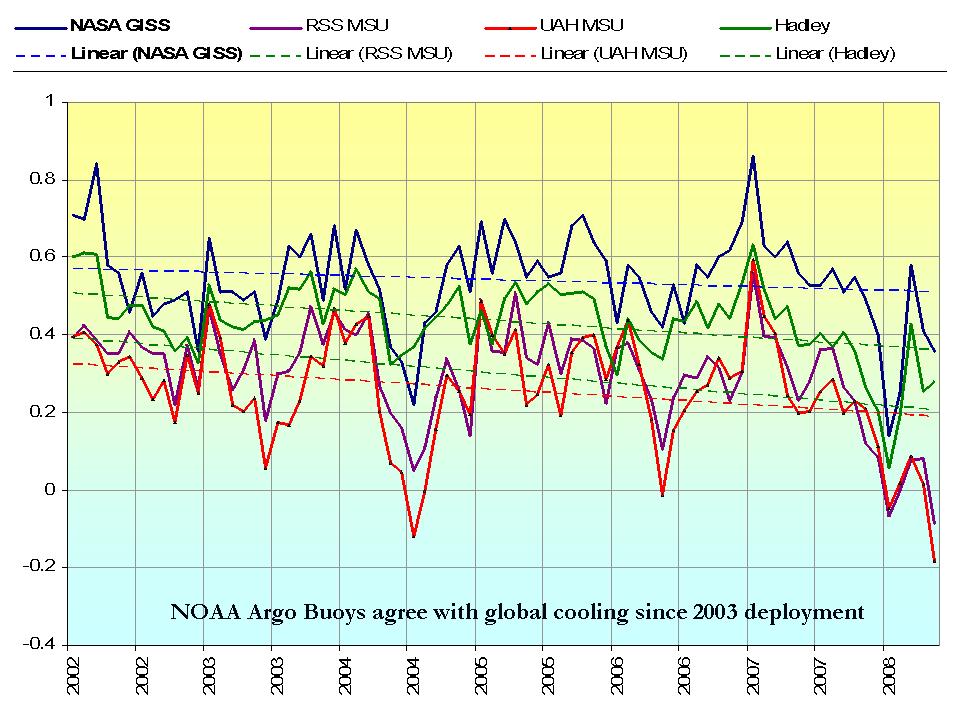
UAH and RSS MSU satellite data uses a base period of 1979-1998. NASA uses the coldest period of the last century 1951 to 1980. Hadley uses 1961 to 1990 as a base period. Obviously satellite providesthe best coverage of the low and middle latitudes land and oceans. The other data bases are at the mercy of the country governments and of spotty imperfect ocean temperature measurements.
2/3rds pf the worlds station dropped out after 1990 and the number of missing months in places like Asia and Africa increased tenfold. Siting has been shown so well by Anthony Watts at http://surfacestations.org to ba an issue with more than 2/3rds of the United States stations poorly sited. The importance of urbanization is underestimated thanks to the flawed research of Peterson and Parker in all the global surface data bases. Numerous studies have shown that surface data bases may overestimate warming by 50%. And then there is the issue of the oceans and each of the data centers treats that differently and now will likely change the data to better reflect the changeover from buckets to ship intakes. See Steve McIntyre’s Lost at Sea here.

See larger image here
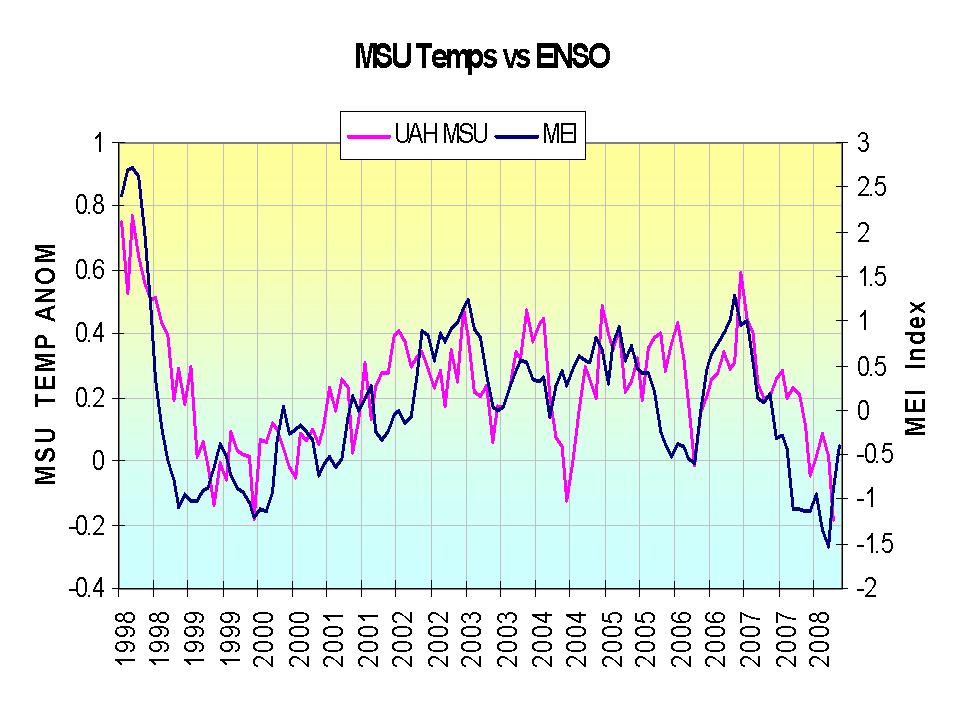
All four plotted data sets, yes even GISS shows a decline since 2002. GISS has the largest positive anomaly because it uses the coldest base period. Satellites, the coldest since, their base period (by chance) was in the warmest decades (of the positive PDO with most El Ninos). Note how well the temperature variations have tied to the variations of ENSO, in this case using the Mulitvariate ENSO Index (MEI) of CDC’s Wolter.

See larger image here
 wpDiscuz