From the UNIVERSITY OF EAST ANGLIA
Low growth in global carbon emissions continues for third successive year
Global carbon emissions from burning fossil fuels did not grow in 2015 and are projected to rise only slightly in 2016, marking three years of almost no growth, according to researchers at the University of East Anglia (UEA) and the Global Carbon Project.
The projected rise of only 0.2% for 2016 marks a clear break from the rapid emissions growth of 2.3% per year in the decade to 2013, with just 0.7 per cent growth seen in 2014.
The new data is published in the journal Earth System Science Data. It shows emissions growth remained below 1 per cent despite GDP growth exceeding 3 per cent.

Decreased use of coal in China is the main reason behind the 3-year slowdown.
Prof Corinne Le Quéré, Director of the Tyndall Centre at UEA who led the data analysis, said: “This third year of almost no growth in emissions is unprecedented at a time of strong economic growth. This is a great help for tackling climate change but it is not enough. Global emissions now need to decrease rapidly, not just stop growing.”
China – the biggest emitter of CO2 at 29 per cent – saw emissions decrease by 0.7 per cent in 2015, compared to growth of more than 5 percent per year the previous decade. A further reduction of 0.5 per cent is projected for 2016, though with large uncertainties.
The USA, the second biggest emitter of CO2 at 15 per cent, also reduced its coal use while increasing its oil and gas consumption and saw emissions decrease 2.6 per cent last year. USA emissions are projected to decrease by 1.7 per cent in 2016.
The EU’s 28 member states are the third largest emitter causing 10 per cent of emissions. The EU’s CO2 emissions went up 1.4 percent in 2015, in contrast with longer term decreases.
India contributed 6.3 per cent of all global CO2 emissions, with their emissions increasing 5.2 percent, in 2015 continuing a period of strong growth.
Although the break in emissions rise ties in with the pledges by countries to decrease emissions until 2030, it falls short of the reductions needed to limit climate change well below 2 degrees Celsius.
Prof Le Quéré said: “If climate negotiators in Marrakesh can build momentum for further cuts in emissions, we could be making a serious start to addressing climate change.”
The Global Carbon Budget analysis also shows that, in spite of a lack of growth in emissions, the growth in atmospheric CO2 concentration was a record-high in 2015, and could be a record again in 2016 due to weak carbon sinks.
Prof Le Quéré said: “Part of the CO2 emissions are absorbed by the ocean and by trees. With temperatures soaring in 2015 and 2016, less CO2 was absorbed by trees because of the hot and dry conditions related to the El Niño event. Atmospheric CO2 levels have exceeded 400 parts per million (ppm) and will continue to rise and cause the planet to warm until emissions are cut down to near zero.”
The Global Carbon Project’s estimation of global CO2 emissions and their fate in the atmosphere, land and ocean is a major effort by the research community to bring together measurements, statistics on human activities, with analysis of model results.
Prof Le Quéré stressed the need for reporting such as the Global Carbon Budget to inform decisions and actions on how to respond to climate change.
Dr Glen Peters of the Center for International Climate and Environmental Research in Norway, who co-authored the analysis, said: “Emissions growth in the next few years will depend on whether energy and climate policies can lock in the new trends, and importantly, raise the ambition of emission pledges to be more consistent with the temperature goals of the Paris Agreement.”
###
One thing that should be considered is that the EU and the UK are still in something of a recession.
Two factors seem to affect year to year power demand. The economy and weather.
The year I moved from California, California lost 5000 jobs. Conservation was credited for the decrease in demand.
The year after the the rolling blackouts, the new governor, Schwarzenegger, took credit for conservation when he did not have order rolling blackout on a very hot day. By my count from reading the news, 2 million were without power because of equipment failures. There was no evidence of voluntary conservation.
I like the part of the report that states
Where will that stand when China creates an additional 20% increase in power production by increasing coal use? It isn’t like China NEEDS all that additional surplus energy
Is that decreased use of coal based on China’s statistics? If so, it should be verified by that satellite that monitors CO2 emissions.
Retired Kit Phigher:
“The year I moved from California, California lost 5000 jobs.”
Better you had stayed there…
The US still hasn’t fully recovered from the recession of 2008.
Very true, in fact we are far worse off, the problems are all still there, in spades, just covered up.
The shale revolution accounted for most of the economic growth in the entire nation from 2010-2015, but now we are back to being stagnant.
Hopefully the world will move on from the social media boom onto something more substantial, i.e. the graphene age. If the feds directed all climate change funding into material science funding who knows what could be achieved.
Real US GDP (chained 2009 $ in trillions) and the EU. Growth is higher in nominal $ with inflation. In Euros, European grown is better, but the Euro has fallen compared with the dollar.
2006 14.61
2007 14.87
2008 14.83 (EU 19.03 US$T 2015)
2009 14.42
2010 14.78
2011 15.02 (first year to beat 2007)
2012 15.35
2013 15.61
2014 15.98
2015 16.40 (EU 16.23 US$T 2015)
2016 16.60 (based on Q1-3)
Stop listening to Donald Trump about America’s lack of greatness. It hasn’t been a great recovery in the US, but most of the world is doing worse.
http://www.bea.gov/national/xls/gdplev.xls
http://data.worldbank.org/region/european-union
Most of the rest of the world, Europe especially, is backing the Low Carbon meme which equates to high cost
Frank: I’ll bet you’re one of those people who would tell a kid hospitalized with MRSA that it could be worse, he could have cancer, and he should cheer up.
The total number of people working is still less than it was before Obama took office.
MARKW says: “The total number of people working is still less than it was before Obama took office.”
…
However, the facts says he’s wrong:
..
http://data.bls.gov/pdq/SurveyOutputServlet?request_action=wh&graph_name=CE_cesbref1
Reality Check: While I haven’t told a kid with MRSA to cheer up because he might have cancer, I have a family member with a disability. I do remind him about the others who have even more severe problems. If we spend all of our time focused on what is wrong with our world, we won’t make an effort to make things better. And the differences between fair, poor and failing are much more important than the differences between fair, good and excellent; both in our circumstances and in our attitude. We are surrounded by negativism. Negative ads win elections, negative news brings in advertising, and even the Weather Channel thrives on fear-casting. Hollywood and the left disdain our country. Trump’s “Make America Great Again” sickens me; give me Matt Ridley’s “The Rational Optimist”. Those who have been left behind by the last recession are likely to be disillusioned by what Trump can do to help them. Those who are thankful they don’t live in the EU, Japan, India or almost anywhere else in the world might also be help themselves.
GC and others: In terms of GDP, our economy has recovered from the Great Recession. The story is mixed in terms of employment. The data below is year, millions of jobs, % of total working age population with jobs, and % unemployed (ie actively seeking work)
2005 141.7 62.7% 5.1%
2006 144.4 63.1% 4.6%
2007 146.0 63.0% 4.6%
2008 145.4 62.2% 5.8%
2009 139.9 59.3% 9.3%
2010 139.0 58.5% 9.6%
2011 139.9 58.4% 8.9%
2012 142.5 58.6% 8.1%
2013 143.9 58.6% 7.4%
2014 146.3 59.0% 6.2%
2015 148.8 59.3% 5.3%
So we had about the same number of American jobs in 2014 as before the Great Recession, about 3 million more jobs in 2015 and further improvement in 2016. However, about 3% fewer of the Labor Department’s estimate of the potential civilian work force still don’t have jobs. This is a tragedy – both for those people who have left the labor force (possibly permanently) and for our nation’s fiscal health. Perhaps 1% of this 3% is due to an aging population and increasing numbers of people in school. IIRC, the Labor Department’s old-fashioned definition of the working population is everyone over 18. I’d really like to know how many people are their prime working years (say 25-62) and what fraction of them are employed.
For comparison, here are the averages for 1990-2004 and the best and worst years during that period. To get back to 63% of working age people having jobs, we need another 9 million jobs, about as many have been created since 2010. Taking into account demographic changes, maybe 5 million more jobs. Today’s low unemployment rate and record high number of jobs.
1990-2004 128.8 63.0% 6.0%
2000 133.5 64.4% 4.0%
1992 118.5 61.5% 7.5%
gallopingcamel, thanx for the graph… should be interesting to see how things pan out with trump going forward. At issue is his vision of high growth verses the federal reserves policy now of slowing down the economy. The unemployment rate just edged down below 5% and it’s time now for the fed to be getting nervous. (were bernanke still in charge it would be time for him to get “cranky”) My prediction is that if trump doesn’t yank janet yellen as fed chair for some one vastly more compatible with his vision then we are likely to see a one term president. If he doesn’t deliver economically, i don’t think republican’s have the needed demographics to carry trump over for a second term. Trump may be a smart business man, but if he’s as dumb about economics as all his predecessors then he’ll be in for a bumpy short ride as potus. So, keep your eye on the big fight, “trump vs the fed”. Whoever wins that one will determine the fate of the 45th presidency…
The labor participation rate is lower than it has been since Carter’s malaise. The unemployment rate does not measure those who have given up looking. The middle class has been substantially hollowed out. And, Obama is the first US President in history never to have seen 3% annual growth. The litany of failure is extensive.
Hey, Bart, see my reply way down below to your other comment to me. There i recap our discussion a while back on economics. Interested to hear what you have to say. These are (very) interesting times…
India sure isn’t. They’re easily the fastest growing CO2 source.
If they ever decide to stop being poor and follow the Chinese model for rapid economic growth, every CO2 reduction plan will be moot.
The two big carbon sinks are expanding capacity, namely the oceans and the plants.
Recently here on WUWT I think there was an article about the planet recently greening an area the equivalent of two United States. And if the oceans, over all, are cooling, that may account for any reduction.
Look for Snowball Earth coming to an election cycle near you soon.
To quote something I read in a WUWT comment thread long ago: three words: net primary production.
Okay, a few more words. What if the oceans are beginning to cool and absorbing more CO2? I’m not saying this is true, only raising the question. God knows the climate scientists we’ve all heard of won’t raise it.
What goes up can rapidly come down. If the oceans cool due to low sun activity while we humans increase agricultural production to feed yet more of us (this is going up exponentially) then we will reach a point when CO2 in the atmosphere starts to go down. If it falls below 150 ppm (and it can) all life on our planet starts to suffocate, big plants and animals first. They become extinct over a short period. The bones to be rediscovered thousands of years later.
No doubt at 200 ppm we will have many Gaian zealots still maintaining that CO2 is toxic.
Unfortunately, you can’t burn your food if you wish to eat something later. Hopefully a volcanic period, comet or meteor strike on a big forest etc will save life on our planet once again, decimation of Gaians not a requirement.
Forgot to mention the coral reefs. They will do very nicely. The Zooplankton which produce sugar via photosynthesis for the coral polyps need CO2. So a massive expansion of coral reef (assuming other things are relatively stable) is a sure sign ocean temperatures are falling and there is a lot more available dissolved CO2. This produces lots of dissolved oxygen around a coral reef. This makes other life more possible. A slow contraction of coral reefs may have caused our ancestors to crawl onto shore to continue breathing.
Unfortunately, our Gaians are direct descendants of this very long crawl. A flood event is engraved in their genes.
UK in recession? Who told you that?
“Britain will be fastest growing G7 economy this year, says IMF”
The UK has not been in recession since 2010! http://www.tradingeconomics.com/united-kingdom/gdp-growth-annual
Most of the ‘recovery’ in the UK that leads to the impression of growth is that it is fictional “wealth” created by re-inflating the housing bubble.
Cameron’s govt. provided state backed loan guarantees to low income private buyers, this allowed banks to create more loans. More available money pushes up prices of existing housing stock: simple supply and demand effects.
Does this sound a little like sub-prime lending, well it is. They were warned but needed to pull the country out of recession.
Now none of this fictional “wealth” has anything to do CO2 emissions because it is not real economic activity. So yes, Hugh, on paper the economy has not been recession. All we need to do now is to keep blowing and blowing and wait until the next time we get gum all over our faces.
The fastest dead horse in the field.
Well perhaps. With forecasts, one always has to wait and see.
But the issue is industrial growth. The UK economy is heavily swayed towards the financial services sector, and that sector is not a big CO2 emitted. The UK has been in industrial decline since the 1960s, and remains in such decline.
Let’s hope that the UK opens up its fracking, switching energy from coal to gas, and producing cheaper energy to help its industrial competitiveness.
So, when John Kerry said at the Paris accords that if the US started biking to school, carpooling to work, using solar for all our household needs, in fact he said that if the US stopped greenhouse gas emissions completely or 100% that it would not make a difference because of the rest of the world. Was anyone at all listening to what he said? The video I watched of him was from Western Journalism. Don’t know how to upload video or I would.
Th3o, just copy the links ( in the search bar at the top where it shows what you are looking at) paste them into your replies and others could add the videos. But I think once you copy and paste the addresses the vids are included in the links.
asybot, that did not work because the place it was not the place where it was from and the links had been severed. Fortunately the message queue broke through and the guy who had posted it got back to me. A couple of ministeps later and I am back here again. (need to remember not to clipboard something else interesting when coming back to a site to post) the addy is: https://www.youtube.com/watch?v=CMpd9Z8Uugg and thank you asybot for your help.
That’s not the case across the EU
this decrease as is clearly stated has taken place while there has been economic growth.
Forget about any recessions as the cause, their claims about fossil fuel burning is FUBAR
And how do you suppose those brilliant college employees figured out there was no increase in the “burning of fossil fuels”?
Well “DUH”, …… with the Mauna Loa mid-May CO2 data it wasn’t very “tuff” figuring it out.
NOAA’s Mona Loa CO2 ppm data
2012 …. 396.78 ppm
2013 …. 399.76 ppm + 2.98
2014 …. 401.88 ppm + 2.12
2015 …. 403.96 ppm + 2.08
2016 …. 407.70 ppm + 3.74
But it was really, really ….. dastardly devious and dishonest to blame any of the above noted Mauna Loa CO2 increases on emissions from fossil fuel burning.
Maximum to Minimum yearly CO2 ppm data – 1979 thru 2016
Source: NOAA’s Mauna Loa Monthly Mean CO2 data base
@ ftp://aftp.cmdl.noaa.gov/products/trends/co2/co2_mm_mlo.txt
CO2 “Max” ppm Fiscal Year – mid-May to mid-May
year mth “Max” _ yearly increase ____ mth “Min” ppm ___ Bi-yearly ppm cycle
1979 _ 6 _ 339.20 …. + …… __________ 9 … 333.93 _____ 79/80 = -5.27 — +7.54
1980 _ 5 _ 341.47 …. +2.27 _________ 10 … 336.05 _____ 80/81 = -5.42 — +6.96
1981 _ 5 _ 343.01 …. +1.54 __________ 9 … 336.92 _____ 81/82 = -6.09 — +7.75
1982 _ 5 _ 344.67 …. +1.66 __________ 9 … 338.32
1983 _ 5 _ 345.96 …. +1.29 __________ 9 … 340.17
1984 _ 5 _ 347.55 …. +1.59 __________ 9 … 341.35
1985 _ 5 _ 348.92 …. +1.37 _________ 10 … 343.08
1986 _ 5 _ 350.53 …. +1.61 _________ 10 … 344.47
1987 _ 5 _ 352.14 …. +1.61 __________ 9 … 346.52
1988 _ 5 _ 354.18 …. +2.04 __________ 9 … 349.03
1989 _ 5 _ 355.89 …. +1.71 __________ 9 … 350.02
1990 _ 5 _ 357.29 …. +1.40 __________ 9 … 351.28
1991 _ 5 _ 359.09 …. +1.80 __________ 9 … 352.30
1992 _ 5 _ 359.55 …. +0.46 Pinatubo _ 9 … 352.93
1993 _ 5 _ 360.19 …. +0.64 __________ 9 … 354.10
1994 _ 5 _ 361.68 …. +1.49 __________ 9 … 355.63
1995 _ 5 _ 363.77 …. +2.09 _________ 10 … 357.97
1996 _ 5 _ 365.16 …. +1.39 _________ 10 … 359.54
1997 _ 5 _ 366.69 …. +1.53 __________ 9 … 360.31
1998 _ 5 _ 369.49 …. +2.80 El Niño __ 9 … 364.01
1999 _ 4 _ 370.96 …. +1.47 __________ 9 … 364.94
2000 _ 4 _ 371.82 …. +0.86 __________ 9 … 366.91
2001 _ 5 _ 373.82 …. +2.00 __________ 9 … 368.16
2002 _ 5 _ 375.65 …. +1.83 _________ 10 … 370.51
2003 _ 5 _ 378.50 …. +2.85 _________ 10 … 373.10
2004 _ 5 _ 380.63 …. +2.13 __________ 9 … 374.11
2005 _ 5 _ 382.47 …. +1.84 __________ 9 … 376.66
2006 _ 5 _ 384.98 …. +2.51 __________ 9 … 378.92
2007 _ 5 _ 386.58 …. +1.60 __________ 9 … 380.90
2008 _ 5 _ 388.50 …. +1.92 _________ 10 … 382.99
2009 _ 5 _ 390.19 …. +1.65 _________ 10 … 384.39
2010 _ 5 _ 393.04 …. +2.85 __________ 9 … 386.83
2011 _ 5 _ 394.21 …. +1.17 _________ 10 … 388.96
2012 _ 5 _ 396.78 …. +2.58 _________ 10 … 391.01
2013 _ 5 _ 399.76 …. +2.98 __________ 9 … 393.51
2014 _ 5 _ 401.88 …. +2.12 __________ 9 … 395.35
2015 _ 5 _ 403.94 …. +2.06 __________ 9 … 397.63
2016 _ 5 _ 407.70 …. +3.76 El Niño __ 9 …
The “Max” CO2 occurred at mid-May (5) of each year … with the exception of three (3) outliers, one (1) being in June 79’ and the other two (2) being in April 99’ and 2000.
The “Min” CO2 occurred at the very end of September (9) of each year … with the exception of eleven (11) outliers, all of which occurred within the first 7 days of October.
I’ll believe the atmospheric measurement of CO2 over the UEA compilations anytime. The CO2 increase will be dampened by increasing biomass consumption and oceanic deep-sinking. Does UEA have credibility anymore? As long as Phil Jones and crew are there, they’re probably issuing politically-motivated statistics.
I reviewed the CO2 page on WUWT. If human released CO2 had an affect on global CO2 levels and human CO2 emission have dropped to near zero, then you could see the drop on the Mauna Loa CO2 graph. I do not see a change in the graph. Either there is no affect, or the effect is so small it cannot be measured because it is smaller than the error in measurement. Either way, our reduction has no affect on global CO2 levels and the amount we were generating had no affect either. Therefore, Human released CO2 has no affect on global CO2 level, and any climate effect caused by CO2 is not affected by our release of CO2. Where am I wrong?
Right on Jeff.
Please re-read the article. It did not say that CO2 emissions have dropped to zero, it said that the growth in CO2 in the atmosphere has dropped to zero (or near zero) That is, the level of CO2 is constant. Neither growing nor shrinking.
Mark W
“That is, the level of CO2 EMMISIONS is constant.”
Yes, but they keep telling us that all the increases in the Global CO2 is due to the increases in Human Emissions, when it clearly isn’t.
AC Osborn,
If the rate of CO2 entering the atmosphere remains constant, that means that the total amount of CO2 in the atmosphere is increasing at a constant rate. It does not mean that the total amount of CO2 will cease to increase.
Jeff,
The natural sinks which absorb CO2 above the ocean-atmosphere (dynamic) equilibrium per Herny’s law are quite linear in ratio to the extra CO2 pressure in the atmosphere. Human emissions were – until recently – increasing every year, with as result that only about half the emissions were absorbed by plants and (deep) oceans. Net result: ever increasing CO2 levels in the atmosphere, be it with a large year by year variability due to the influence of temperature variations (especially El Niño) on (tropical) vegetation uptake rate.
If the emissions remain constant (which I suppose will not be the case when the economic crisis ends…), CO2 levels in the atmosphere will increase until CO2 emissions and net sink rate are equal. If we ever reduce our CO2 emissions – thanks to fusion – the CO2 levels will drop again until the old equilibrium (around 290 ppmv for the current average ocean temperature) is reached again…
Ferdinand,
If emissions remain constant, and natural sinks continue increasing, which is quite possible as we are far from equilibrium, the rate of increase in atmospheric CO2 will go down. This should reduce the urgency of any problem that might come due to high CO2 levels, whether real or imaginary.
Best regards.
Ferdi: “CO2 levels in the atmosphere will increase until CO2 emissions and net sink rate are equal.”
So you are agreed with me. Le Quere is talking crap. Emissions do not need to drop to zero in order for atm CO2 to stop rising. They need to drop to about half the current annual rate at which point they will equal the current sink rate.
Ferdinand is right. Emissions are higher than the natural sink rates, and they won’t match up until many years out. But …
If keep emissions right at this level, CO2 levels will stabilize at about 480 ppm in about 40 years. If we cut our emissions by about 35% gradually, we can stabilize CO2 at about 450 ppm in about 30 years.
The Greens all think we have to cut to emissions to near-Zero, but they do not understand basic math so why would one believe them about any number, let alone what CO2 emissions should be.
Natural gas combined cycle power plants are the key to the current slow-down in emissions and the eventual stabilization of CO2. They are the reason for the slow-down.
But in reality we do not need to cut them at all, a doubling would actually be better for the world.
I agree with A C Osborn. Really good point. A doubled CO2 to 560 ppm would probably be a better target. We could then decide to put it higher if this was even more beneficial.
And “warming” has only been half of what the non show THEORY projected!
I’m pretty sure green groups will consider that achievement of global climate change related policies having some effect and will ask for their continuation. I guess it needs careful analysis why it occurred first.
From my point of view, though, constant emissions still mean constant rate of increase of “human produced” CO2 in atmosphere so if the task is to stabilize or lower atmospheric CO2 concentrations, it’s not achieving anything.
It is hard to increase atmospheric CO2 when there is no economic growth.
Yet the paper clearly states that there has been economic growth, so I don’t see the point of your comment
As always, models trump reality.
I predict the atmospheric levels of CO2 are recovering from the abnormal ice age low, towards more normal levels. And human activity has a negligible influence.
See http://www.geocraft.com/WVFossils/stomata.html and http://www.geocraft.com/WVFossils/Carboniferous_climate.html
Two interesting references. Thank you.
Nothing to see here — yet:
http://www.climate4you.com/images/CO2%20MaunaLoa%20MonthlySince1958.gif
Can it be that the human contribution is not as significant as claimed?
Chris I do not know who has been doing the claiming but EPA/DOE annual reports on anthropocentric sources of ghg has always been a small fraction (10% IIRC) compared to the natural flux.
I have long maintained focusing on natural is a good way to reduce ghg emissions and produce energy. The coal bed methane program is an example.
Retired Kit,
Most of the natural fluxes are bidirectional over the seasons, while the human contribution is ~9 GtC/year (~4.5 ppmv/year) one-way addition. The net result is ~4.5 +/- 3 GtC/year increase. Thus the natural cycle is a net sink for about half the human emissions of CO2, both in the oceans and vegetation, and also the year by year variability (Pinatubo, El Niño) is only half human emissions.
The claim du jour is that emissions were flat in the past 3 years.
http://news.trust.org/item/20161114000455-vw85r/
Somebody forgot to tell the atmosphere. As the blue line above shows, CO2 in the atmosphere continued to behave just like it did in earlier years, when emissions were increasing.
This is another example of the disconnect between emissions vs how much CO2 is in the atmosphere.
Whoops!
Jurgen,
Emissions were flat, not zero and as the sinks are only about half the emissions, CO2 levels in the atmosphere continue to increase, be it at a lower speed…
Nothing to see at Mauna Loa?
Do you know who funds and runs this facility?
I am so suspicious that I am thinking of acquiring my own equipment.
Although to measure parts ppm of co2 used to be to difficult except for hugely expensive scientific equipment, there seems to be a number of commercial sensors that can handle the minute amounts and changes needed.
Here is one that is close.
http://www.vaisala.com/Vaisala%20Documents/Brochures%20and%20Datasheets/CEN-G-GMP252-Datasheet-B211567EN.pdf
There are more.
Cheers
Roger
http://www.rogerfromnewzealand.wordpress.com
Roger,
NOAA runs some 10 base stations, some 60 others are run by different groups most of them from different countries. Scripps still does take their own samples at Mauna Loa, since they lost the supervision there. If NOAA would even try to cheat with a few tenths of a ppmv, they would have to explain that to the rest of a critical scientific world while all measurement equipment is continuosly cross examined with calibration mixtures.
I only can hope one day that measuring temperature was done with the same rigor as CO2 levels are measured and continuously controlled on accuracy…
O/T Roger, how are things in Christchurch? We are all understandably upset by what happened, can you keep us posted for a day or so on this thread, I tried finding your site but with no luck.
Asybot,
thanks for your concern.
Fortunately for us, in spite having been rocked firmly in bed for more than 100 seconds and being kept awake all night by the tsunami warning, we are not directly affected by the earthquake. There has been no report of damage in Christchurch to my knowledge although a coastal bay unfortunately directly facing North had its only house written off. (tsunami)
This is because this huge seismic event occurred about 2 hours drive north of our city.
Although the epicenter and the fault movements were generlly in low populated areas, the town of Kaikoura is not only cut off but appears to be completely flattened. The army and other contractors are engaged in flying out stranded tourists and a navy ship is on its way there.
The coast road, which you may have seen on TV, looks a write off as well. Huge slips that look impossible to repair. This is a main highway and is a serious economic loss.
The quake has also wrought damage in Wellington, with at least several CBD building evacuated and some residental damage. A Wellington acquaintance who fled Christchurch when her house was written off there sustained reasonably severe damage to her Wellington home.
So all in all a bit messy north of here. Unfortunately there were two casualties, I believe they were in Kaikoura, and a miracle that no one was killed in the slips on the main highway.
Not sure why you couldnt find my website. the address is http://www.thedemiseofchristchurch.com
However if you google “rogerthesurf” quite a lot of stuff comes up.
Thanks for your query.
Feel free to seek further information as you wish. Pref on my website though.
Cheers
Roger
Here is the data from the study plotted as change in the annual rate.
Here is the rate of change at MLO compared to Le Quere’s emissions data: Note the units are scaled for comparison of form.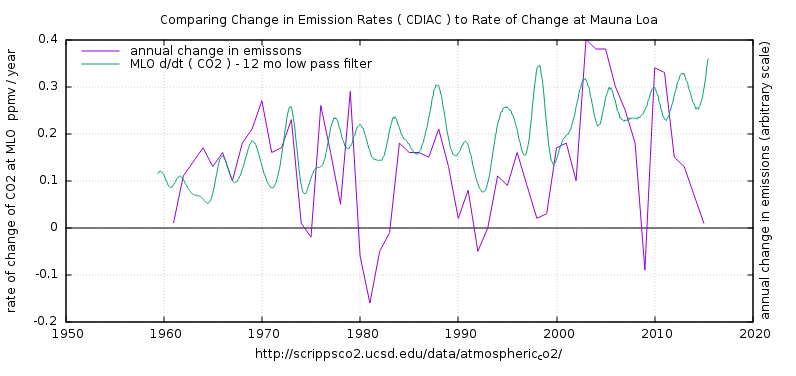
Now if CO2 emissions are supposed to be the control knob of temperature via radiative forcing, wouldn’t it at least have to be controlling the atmospheric concentration first ?
So why will annual emissions generally dropping since 2002, why has d/dt(CO2) in the atmosphere been generally rising over the same period. I don’t see a lot of correlation there.
Greg,
It is not because the year by year temperature variability has a huge influence on the CO2 rate of change variability that the emissions are not the cause of the increase in the atmosphere, neither that CO2 has no influence on temperature. The latter is very modest: some 1.1 K for 2xCO2, based on physics. The rest of the panic is based on failed climate models.
Near all of the increase is human caused, as only about half the human emissions remain (as mass) in the atmosphere. Temperature has a small influence over longer periods: about 16 ppmv/K. Maximum 16 ppmv of the 110 ppmv rise since the LIA. That is all.
Why should I believe a site that can’t even accurately identify what it is measuring?
Rhoda R,
Please, most of what is measured at Mauna Loa has passed thousands of km over the oceans and presents the average CO2 level over the NH. If they see that the wind blows from uphill the volcano, they mark the values and don’t use these for daily to yearly averages. The same for upwind conditions (slightly depleted values) from the valley. Incuding or excluding the marked values doesn’t influence the average and trend with more than 0.1 ppmv/year.
If you don’t like the Mauna Loa data, there are some 70 other stations available for your convinience…
I prefer the South Pole station, as that has no volcano or vegetation for 1000s km in the neighborhood and started a year earlier than Mauna Loa, but lacks a few years of continuosu data, which were infilled with 14-day flask samples, which are as good, as there is hardly a seasonal change at the South Pole (and most of the SH).
See: http://www.esrl.noaa.gov/gmd/dv/iadv/
Why are we discussing CO2 levels here at all? CO2 may be controlled by the big factors (ocean uptake, biomass growth, insects) or diddled by the minor stuff (industrial growth, power consumption, land-use change) – – BUT NONE OF THIS IMPACTS GLOBAL TEMPERATURES (aka “Climate Change”)
As the Mauna Loa graph shows, atmospheric CO2 has been steadily rising (yearly average) since measurements began in the 50s. Yet, global temps cooled significantly to the mid 70s, then rose about 1F to the late 90s – – then no change/nothing/niente/nichts/nada/bupkis to today
Those facts alone are sufficient to conclude CO2 has NO EFFECT on global temperatures
Thus, anything that impacts global CO2 is also immaterial to “global warming/climate change”, etc.
Let’s talk about how to get more cheap, reliable energy to the world’s poor
GeologyJim,
You can’t prove from the varaibility around the trend that CO2 has zero effect, only that it has a small effect. Natural factors (PDO and other ocean ascillations, clouds,…) may mask that, but overall there is some warming and thus maybe some (small) effect…
FE says – –
“You can’t prove from the varaibility around the trend that CO2 has zero effect, only that it has a small effect. Natural factors (PDO and other ocean ascillations, clouds,…) may mask that, but overall there is some warming and thus maybe some (small) effect…”
I was purposefully dogmatic when I said “CO2 has NO EFFECT”, because I’m not quibbling over “small effect’ vs “no effect”. To quote the former Dem presidential candidate, “At this point, what difference does it make!!”
The advocates of man-caused catastrophic global warming must be required to demonstrate the plausible truth of their assertion. Otherwise, their hypothesis is bogus.
ll empirical evidence indicates that human influences are miniscule.
Yes quite. I suspect these papers more than most. I mentioned in another comment yesterday that the “slowdown” was one of the lead items on the BBC radio news a couple of days ago
” The big El Nino of 2015-16 led to a smaller uptake of CO2 by plants.” How does that work? Especially since observations from satellite have shown a 14% increase in ” greening.” How do the plants do that while taking up less CO2?
James,
The problem is mainly in the mature forests of the Amazon: While in general quite neutral in uptake, during a strong El Niño the increase in temperature is over the top for many plants and the parallel change in rain patterns dries large parts out. The net result is temporarely more CO2 release than uptake. That reverses with a La Niña and/or restoring of the rain patterns. For the 1998 the result could be measured by the opposite CO2 and δ13C (a measure for the 13C/12C ratio in CO2) changes. If the CO2 changes were mainly from warming oceans, CO2 and δ13C changes would parallel each other. See:
http://www.bowdoin.edu/~mbattle/papers_posters_and_talks/BenderGBC2005.pdf
While the year by year varibaility in uptake is huge, most levels out to zero within 1-3 years and over longer periods vegetation is a small, but increasing, sink for CO2…
@FE- If that were true we would have seen an increase in atmospheric CO2 levels commensurate with the reduced plant uptake- so this sounds like more b.s. modelling to me.
John,
At the same time that plants overall were a net source, the oceans remained a net sink, be it also reduced by the higher ocean temperatures during an El Niño. Total effect in 1998 was that the uptake by plants + oceans was very small and that near all human emissions (as mass, not the original molecules) remained in the atmosphere.
In 1999 the El Niño was followed by a strong La Niña where the Amazon recovered and the oceans cooled, absorbing ~2 ppmv from the ~3 ppm emitted:
http://www.ferdinand-engelbeen.be/klimaat/klim_img/dco2_em2.jpg
As you can see on that graph, the Pinatubo eruption too had a large effect: not only by a small temperature drop but also by increasing photosynthesis, as many leaves normally part of the day in the shadow of other leaves were receiving scattered light from the particles in the stratosphere…
Isn’t it just following temperatures – ie the Pause – with a bit of a lag………
There was no pause and CO2 does not lag…
Griff
If there was no pause why did last 5th IPCC report reference it and why did so many climate scientists write papers attempting to explain something that you say did not exist?
“Nothing to see here — yet:”
https://scripps.ucsd.edu/programs/keelingcurve/2016/05/23/why-has-a-drop-in-global-co2-emissions-not-caused-co2-levels-in-the-atmosphere-to-stabilize/
“Note: Readers have asked why there has been no stabilization in the measured levels of the greenhouse gas carbon dioxide in the atmosphere when reported emissions of CO2 have fallen. Scripps CO2 Group Director Ralph Keeling gave this response:
There’s a pretty simple reason why the recent stabilization in global emissions hasn’t caused CO2 levels to stabilize. The ocean and land sinks for CO2 currently offset only about 50 percent of the emissions. So the equivalent of 50 percent of the emissions is still accumulating in the atmosphere, even with stable emissions. To stabilize CO2 levels would require roughly an immediate roughly 50 percent cut in emissions, at which point the remaining emissions would be fully offset by the sinks, at least for a while.
Eventually, additional emissions cuts would be required because the sinks will slowly lose their efficiency as the land and ocean start to saturate. A permanent stabilization at current levels therefore requires both an immediate 50-percent cut as well as a slow tapering thereafter, eventually approaching zero emissions. The recent stabilization in emissions might be viewed as a very small first step toward the required cuts.”
That sounds convincing but it’s really an example of policy based fact making.
The carbon cycle isn’t nearly as well understood as the IPCC would have us believe.
CommieBob,
Both Segalstad and the IPCC are wrong. Segalstad uses the residence time, which indeed is around 5 years, that is how long an individual CO2 molecule resides in the atmosphere before being swapped with a CO2 molecule from another reservoir. That does say next to nothing about how long it takes to remove an extra shot CO2 (as mass), whatever the source, out of the atmosphere.
That is like the difference between the turnover of capital and goods in a factory (= residence time) and what the factory makes as gain (or loss) at the end of a fiscal year. Although related, knowing the turnover says nothing about gain or loss…
The IPCC uses the Bern model, which assumes a saturation of the sinks at a certain level. That is only true for the ocean surface, still far away for the deep oceans and unlimited for vegetation. The real sink rate, unchanged over the past 55+ years, has a half life time of ~35 years.
I would not trust anything the University of East Anglia said. They are in the business of advocacy, not accurate science. They’ll be some new scheme or strategy behind this announcement.
Then you must examine their science and refute it using science.
Otherwise your statement is merely advocacy for the other viewpoint…
so what’s wrong with their methodology?
I’m trying to decide if that statement is more hypocrisy, or irony.
As a former member of UEA’s Environmental Science School, but a aAGW sceptic, I would suggest you separate your distrust of UEA’s advocacy from the basic science and data it produces. The measurement of human emissions of CO2 and other GHGs is basic evidence that advocates on all sides of the climate argument use. Corinne and her colleagues organize the collection of emission data worldwide. The information that emission rates have slowed come from them (and is being used by both warmists and sceptics alike). If you dismiss this data because it comes from UEA (actually it comes from the Tyndall Centre which is only partially based at UEA, and the data itself comes from worldwide sources), you have no data to use whatever.
The usual practice in science is not to dispute even an opponent’s raw data. Interpretation of that data (including evaluations of its value), especially if it includes advocacy, is fair game however.
well…..there’s nothing like moving production to China
China – the biggest emitter of CO2 at 29 per cent
The USA, the second biggest emitter of CO2 at 15 per cent,
…………. USA emissions are projected to decrease by 1.7 per cent in 2016.
But hey…it’s not a problem…we’ll just retrain everyone
…so we can stop importing people from Mexico to do the jobs they are not trained to do now
Something happened around 2000, the measured atmospheric CO2 growth plateaued.
The article,
http://www.nature.com/articles/ncomms13428#f1
recession……I know, it’s wiki
https://en.wikipedia.org/wiki/Early_2000s_recession
According to the GCP, around 2000, that’s when China’s emissions increased. Global emission rate increase after 2003, yet the atmospheric rate plateaued. Interesting findings…..
http://cdiac.ornl.gov/GCP/images/global_co2_emissions.jpg
What happened was SST plateaued.
So how come you can’t see it in the Mauna Loa graph above?
A C OSborn,
Because a growth rate of 2 ppmv/year still is a growth… If you plot the Mauna Loa data against its linear trend, you will see that it is in general a slightly quadratic curve, while in recent years it is more linear.
More than just “recent years”, Ferdinand. The rate of growth in atmospheric CO2 has been roughly constant ever since the temperature “pause”, while emissions have been accelerating in that time. I expect they still are accelerating, but someone recognized that, that just didn’t fit the data anymore. So, time for a fudge.
How would fudging emissions downwards in a way which does NOT match MLO be desirable. I’m not saying they are beyond rigging the data, that’s the “new normal” but try to be a bit logical in your claims.
If emissions have come to a standstill and atm CO2 is still rising at 2ppmv /year , it makes it look even less likely that emissions are the main cause of rising CO2 and thus temp increase or any other aspect of the 10.000 things that CO2 is supposed to be doing.
Greg – Atmospheric concentration is rising at a steady rate. That is what MLO data show. What they are doing here is claiming emissions are now leveling off, which would mean accumulated emissions would be rising at a steady rate, too.
But, the leveling off of the rate of change of atmospheric concentration started almost two decades ago, when temperatures entered a hiatus. So, they’re a day late and a dollar short.
Bart,
Besides the large monthly or year by year fluctuations, the response of the sinks to the increase of CO2 in the atmosphere still is completely in ratio to the extra CO2 pressure above the dynamic equilibrium (“steady state”) between oceans and atmosphere, according to Henry’s law:
http://www.ferdinand-engelbeen.be/klimaat/klim_img/dco2_em6.jpg
At constant emissions, the “airborne fraction”, what remains in the atmosphere, drops with still increasing CO2 pressure until emissions and sinks get equal.
“Something happened”
It’s called Temperature.
It became more or less constant.
So why is there no flattening of the steady rise shown at Mauna Low?
Yes, something happened around 2000…Al Gore lost.
British media has gone nuts about 2016 being the warmest year ever. All the experts are making big deal of already being 1.2C above pre-industrial level..
On plus side, as far as I see it, we are 1.2C further away from the new ice age, at least for the time being. We should count ourselves lucky since the global temperature could have swung the other way by 1.2C.
Little to no mention that .8 degrees of that happened before 1950 when industrialization took off.
Even less mention of the LIA.
Considering increasing temperatures worldwide the last decade(s), are there any valid figures of the consequent increases in soil-bound carbondioxide (from non human activity) and methane, anyone?
My Maple trees took care of most of it.
My exact feeling – technology and, believe it or not, simple economics will result in huge decreases in carbon emissions : molten salt nuclear reactors will become, at production costs less than 2 cents per kWhr, universally desirable and can be built in factories, and require very little site preparation, adding up to very rapid deployment. And, of course, electric cars are not far off.
Battery prices below $150 per kWhr and will drop further via automation. Electrics are intrinsically cheaper to build when battery prices are near $100, require less upkeep and maintenance and are more reliable. Evangelizing lower carbon via conservation, etc is nonsensical and unecessary.
Sheesh, isn’t that almost “too cheap to meter”?
Arthur says: ” molten salt nuclear reactors will become, at production costs less than 2 cents per kWhr,”
…
Since there are NO operating MSR’s as of today, how do you know what the productions costs really are?
C’mon folks, make some carbon! This global cooling is accelerating~!
You could reduce industrial CO2 emissions to zero and Mother Nature would still control 96% of World CO2 emissions. CO2 levels would continue to rise still. The good or bad news is that the cutting of industrial CO2 would not affect temperature as it is temperature that affects CO2 level..
Nicholas,
I don’;t think your bookkeeper would agree, you forgot to coiunt the other side of the balance: Mother Nature also controls 98% of the World CO2 sinks, that is a net loss of 2% (~2 ppmv) per year…
CO2 has no effect on world temperatures so who cares if it goes down or up?
Eugene WR Gallun
no kidding. why adopt this orphaned narrative? people who talk about co2 as if it mattered are furthering the agenda 21 fable, it’s not a refutation; it’s an endorsement.
I just have no idea why going from .23 millibars of CO2 in 1850 to .4 millibars today out of 1013 would change temps a lot. What about water vapor/ocean feedback effects? Land use change (check out NASA view of Earth at night) is another story. When it’s 50 degrees in the countryside and 60 a few miles away, in the lot area that says something.
I would propose a Global “Hold Your Breath Day” where all those who believe that Human Emissions of CO2 is bad for the world should Hold their breath for a minimum of 1 hour. Call it Earth CO2 awareness hour.
Prof Le Quéré said: “Atmospheric CO2 levels have exceeded 400 parts per million (ppm) and will continue to rise and cause the planet to warm until emissions are cut down to near zero.”
Crap, half of current emissions are getting absorbed by the biosphere. We are supposedly about 43% above the natural equilibrium, so if emissions were zero it would be plunging. If our emissions were about half current levels then atmospheric CO2 would be about stable since if is the deviation from assumed equilibrium which drives the re-absorption. . Assuming, as I’m they are assuming, that the “natural” equilibrium is still what it “should be” 280 ppmv, then zero growth would be achieved with about half the current output, not zero.
If Le Quéré does not understand physical processes better than that she should probably refrain from making ignorant, misleading claims and stick to her carbon bean counting.
Perhaps someone can explain where I am wrong about the following thought…
Since 1850 (or 1750 by some Church of AGW accounts) the ppm has risen from ~280 to 400. A rise of 120 ppm in 166 years. Humans are supposed to be adding 4% to the total CO2 in the atmosphere.
Now it is highly unlikely we have been adding 4% since the beginning of the Industrial era and likely it’s only been since circa 1950 after we ramped up manufacturing after WW2, but let’s ignore that and suppose that, from day 1 we have been adding 4%.
Near as I can figure, that means we have added 4.8 ppm in 166 years to the total CO2 content.
So where has the other 115.2 ppm come from?
Another thought I had is that we know from the ice cores that CO2 follows temps by approx 800 years or so. 800 years prior to either 1850 or 1750 we had the MWP, which lasted a couple of hundred years before declining into the LIA.
And CO2 began rising around 800 years later…
Mark, my post below was meant as a reply to yours, which I totally agree with.
MarkMcD,
The error in your reasoning is that the 4% is one-way additional to a natural cycle of 96% that is simply going in and out every year, mainly ovr the seasons. That cycle itself doesn’t change one gram of CO2 as mass in the atmosphere, as long as the natural ins and outs are equal. At this moment, the additional pressure of CO2 in the atmosphere removes about half of human emissions out of the atmosphere, as there is slightly more sink than source in the natural cycle, thus the other half still accumulates in the atmosphere. That was in average the case for the years since 1850 and certainly for every year since Mauna Loa (and the South Pole) started measuring.
Since 1850 humans have emitted some 400 GtC as CO2 (~200 ppmv), the measured increase is ~110 ppmv (plus ~10 ppmv from ocean warming)…
“And CO2 began rising around 800 years later…”
Which implies that ocean circulation is involved. This is order-of-magnitude the time it takes for an element of ocean water to travel from an absorption area (northern or southern) to an emission area (equatorial).
pochas94,
Yes, but the drop of CO2 between MWP and LIA was only ~6 ppmv for a drop of ~0.8 K. If we may assume that the MWP was as warm to warmer than the current times, that gives only 6 ppmv increase caused by warmer ocean temperatures. Not the 110 ppmv we measure above equilibrium per Henry’s law…
Thanks for your reply. Long time lags are involved. The change in CO2 level is unrelated to what is going on at present. Let me indulge. It’s about sea ice. Whatever causes these Bond events (perhaps astronomical), more sea ice means less CO2 absorption which means less emissions 800 years later. Conversely, less sea ice means more CO2 absorption which means more emissions 800 years later. Equatorial ocean temperatures are stable compared to those in the polar regions, so emissions depends only on the chemistry of the upwelling ocean water. Pure speculation, I admit.
It would be nice if we could calculate mortgage interest payments that way but unfortunately not!
Say we’ve been adding 4%/year for the last 50 years, that would mean that the level would now be
1.04^50 = ~7
In other words 7 times what we started with!
About 1%/year would yield about 1.6X the starting value.
I have carried some calculations based on data readily available and quoted by the warmist camp, such as Sceptical Science, the bottom line of which is:
The global daily anthropogenic carbon emissions stated as a percentage of the total carbon in the form of CO2 in the atmosphere and hydrosphere constitutes just 0.0000634%.
In my opinion, this insignificant amount cannot ever have any sort of influence on the levels of CO2 in the atmosphere and oceans. It is tantamount to adding one speck of grain to the total annual feed of a herd of cattle. But then I may be wrong.
Pete,
Of course we may be wrong – CO2 might even be reducing the warming going on. 😀
Think of it this way – the ‘reflected’ radiation is near as dammit saturating the CO2 absorption. Increased warming expands the CO2 and the only place it can go is higher.
Add to this that each absorb/emit cycle for CO2 lowers the frequency until very quickly the IR is no longer able to be absorbed by CO2 at all.
So at the top levels of CO2 we have a whole lot of CO2 that is NOT being tickled by IR at all, so any IR coming IN will be absorbed. And if the CO2 lower down works for warming as proclaimed by the Church of AGW, they will have a problem claiming the CO2 up high is not preventing IR from reaching ground. 😀
Or is that just me being a bit of a bastard? 😀
Pete,
All depends of the speed with which the sinks react on some increased CO2 pressure in the atmosphere. The only real fast sink is the ocean surface, in direct contact with the atmosphere. Due to (buffer) chemistry that react fast (less than a year half lifet ime), but limited in uptake: some 10% of the change in the atmosphere. That gives that the ocean surface sinks some 0.5 GtC/year from the ~9 GtC/year human emissions, with ~4.5 GtC/year remaining increase.
Next fast are the deep oceans: enormous capacity, but very limited exchange rate, as most is isolated from the atmosphere and exchange is only at the extremes: polar sinks and equatorial upwelling.
That gives a net sink rate of ~3 GtC/year with a half life time of any CO2 pressure above equilibrium of ~35 years.
Much slower is vegetation: a net sink rate of ~1 GtC/year and a half life time of ~170 years.
Quantities don’t tell you anything, you need quantities, temperature, pressure and uptake speed to know what will happen in the atmosphere…
Yes, thanks for the details, however, CO2 emissions, both natural and anthropogenic, are a continuous process. CO2 is not added to the atmosphere on New Year’s day, 9 GtC of it, but it’s more like 9 GtC/356 = 0.0247 GtC per day, forget the rate per hour. While this CO2 is being emitted, there’s a whole biosphere eating out of a massive store of carbon, 38,885 GtC of it. Now my question is: What the heck of a difference would adding 0.0237 GtC do to an existing trough containing 38,885 GtC out of which the hungry biosphere is continuously munching on?
It’s like up to yesterday, the hungry biospheric pigs had 38,850 Gt of food to eat from, but as from today they will have 38,885.0237 Gt. I cannot see why this insignificant quantity should result in any CO2 increases in the atmosphere and oceans. That CO2 increase is mostly due to global warming.
Pete,
Most of the huge natural fluxes are temperature driven:
In the NH spring/summer, oceans and atmosphere warm up, oceans release large quantitities of CO2 into the atmosphere, vegetation starts to grow and removes large quantities of CO2 out of the same atmosphere. In fall/winter the opposite happens as leaves start to fall down and bacteria and molds start to decay that all winter and in part next year(s). Here is the NH extratropical vegetation dominant: +/- 8 ppmv at ground level, +/- 4 ppmv at the height of Mauna Loa (3,400 m height).
The opposite seasons happen in the SH, but the differences are much smaller: +/- 1 ppmv over the seasons, due to more ocean and less land.
The quantities involved are reasonably known, as vegetation produces oxygen and its decay (also as feed/food) uses oxygen, and its 13C/12C ratio is widely different from the ocean ratio.
Mass flows involved in the seasonal fluxes:
~50 GtC/year out and in the oceans
~60 GtC/year in and out the biosphere
Net global effect in the atmosphere: ~10 GtC (~5 ppmv) change within a year for average ~1 K temperature change.
Another, more continuous CO2 flux is between the equatorial upwelling places and the polar sink places. That is about 40 GtC/year as CO2 in and out, rather constant (based in the 14C decay rate and the dilution of the 13/12C ratio from human emissions). That doesn’t influence the CO2 levels in the atmosphere at constant temperature. For (long term) temperature changes that gives changes of ~16 ppmv/K.
Oceans are dominant on long term (decades to millions of years)
Over the past 57 years, there is hardly any change (a slight increase) in the seasonal cycle and a slight increase in temperature, good for ~10 ppmv increase in the atmosphere. That is all.
Before human emissions, the seasonal and conntinuous cycles were rather constant, only influenced by temperature changes on short term (mainly by vegetation) and long term (mainly by the oceans).
The first human releases were small and didn’t much increase the CO2 levels in the atmosphere. That didn’t influence the temperature related seasonal and permanent processes to any measurable level. That CO2 simply remained largely in the atmosphere (as mass). Only when the CO2 levels increased further, the extra pressure did give a disequlibrium between the ocean release and uptake: some less release at higher temperatures, some more uptake at lower temperatures. To a much lesser extent, the same happens in the biosphere, where uptake increases, but release is independent of the CO2 pressure in the atmosphere.
Thus human emissions give extra CO2 pressure in the atmosphere, which gives a disequilibrium in the uptake/release processes that cycle CO2 in/out the atmosphere, caused by temperature.
The main fluxes are temperature related, the main removal of any extra CO2 is pressure related and the removal of the extra CO2 (whatever its origin) is hardly influenced by temperature (on periods longer than 1-3 years)…
Since there is no proof that CO2 has any effect on temperature, why do we permit the warmists to endlessly push the CO2 concentration as having some importance. After all, 400 ppm is only 0.0004, or four molecules in every 10,000.
Ian M
“Since there is no proof that CO2 has any effect on temperature, why do we permit the warmists to endlessly push the CO2 concentration as having some importance.”
I watched the Mars special tv program tonight, on the Science Channel, and I heard Robert Zubrin (a highly intelligent rocket scientist) say we could terraform Mars by adding carbon dioxide to the atmosphere of Mars, and he pointed to Earth’s “global warming” as presumably evidence of it working. He seems to believe it would be real easy.
I wonder how long humans would have to operate CO2 producing powerplants on Mars to warm it up to human standards. Let’s say we transport all Earth’s coal-fired powerplants to Mars tomorrow and fired them up. How long would we have to wait for decent weather?
I’m thinking it would be a *very* long time.
When Mar’s atmosphere is already 95% CO2?
Now I’m watching the new “Mars” series on National Geographic Channel. The series seems to be based on Elon Musk’s vision of going to Mars. He’s planning to do it all wrong. He shouldn’t even attempt to land on Mars until he has established an occupied habitat module either in Mars orbit or on Mars’ moon Phobos.
I note one of the characters that lands on Mars in 2033 is named Robert Zubrin. 🙂 All is right with the universe!
Musk’s plan is unnecessarily complicated and dangerous, and should not be attempted without having human backups in Mars orbit.
In fact, Mars is just a sideshow. The real action for the future of humans in the greater universe is in orbit, at least until we are able to reach a twin Earth somewhere out there. It is much easier to construct habitats in space that can hold millions of people comfortably and safely, in full Earth-equivalent “gravity”, than it is to try to live on Mars for anything other than research, with Mars’ high radiation levels and numerous other obstacles to establishing humans. Just landing on Mars is an unnecessary risk, if the goal is to get humans off the planet Earth permanently as soon as possible.
Musk is planning on developing a lot of hardware for use on the surface of Mars. If he has enough money to do that, then he has enough money to do it the right way, which is not the way he is planning on doing it now, imo.
Mars already has more CO2 in it’s atmosphere than the Earth’s does.
Robert Zubrin is a very smart rocket scientist. It just goes to show that person can be a genius on one subject and completely clueless on another.
Who needs it? Why, our enemies do. Those who hate us, for one reason or another. Envy perhaps. And certainly those who stand to gain from it do. CO2 is just the excuse.
“Atmospheric CO2 levels move permanently above 400 ppm”! Thats a big call!
Unscientific I would have said.
I don’t believe CO2 could be the primary cause of massive global warming as proposed by Environmental Activities. The CO2 levels have been proven to be much higher in some prehistoric times than now and the earth didn’t suffer a mass extinction. Any scheme to sequester CO2 is madness and will damage the earths green productivity and thereby reduce available O2 in the atmosphere and damage human existence.
The stabilization of the rate of change of atmospheric concentration to a more-or-less constant level started nearly two decades ago, at the same time temperatures stabilized. As cause cannot precede effect, any recent stabilization of human emissions did not cause it.
http://i1136.photobucket.com/albums/n488/Bartemis/nopause_zpscjndrosf.png
What I suspect is that there has been no stabilization in emissions at all. This is just the latest fudge to try to limit the divergence between atmospheric concentration and emissions, which has been becoming more and more glaring since the temperature pause.
ooh…. they would, too…
Bart,
Comparing temperature to the derivative of CO2 has no bearing in any physical effect. dCO2/dt changes lag dT/dt changes with exactly the same waveform but with zero slope:
http://www.ferdinand-engelbeen.be/klimaat/klim_img/temp_co2_der.jpg
The opposite CO2 and d13C waveforms (if plotted together) prove that vegetation is the main cause of the variability in CO2 rate of change. The huge variability in CO2 rate of change zeroes out in 1-3 years and while most is the result of the response of vegetation to temperature changes, vegetation is a net sink over longer periods.
CO2 changes lag T changes with 4-5 ppmv/K, the maximum effect (Pinatubo, El Niño) is +/- 1.5 ppmv around a trend of ~80 ppmv since Mauna Loa. Temperature has hardly any influence at 4 ppmv/K, even with the 1992 Pinatubo or 1998 El Niño:
http://www.ferdinand-engelbeen.be/klimaat/klim_img/wft_trends_rss_1985-2000.jpg
The huge variability in CO2 rate of change zeroes out in 1-3 years and while most is the result of the response of vegetation to temperature changes, vegetation is a net sink over longer periods.
While near all variability in the CO2 rate of change is caused by temperature variability, there is no physical process that delivers 80 ppmv CO2 from a small increase of 0.6 K since 1959. The oceans are good for maximum 10 ppmv increase in that period as base (but still were a net sink), while vegetation was an extra sink.
All you have done is attributing all the slope of dCO2/dt to temperature by using an arbitrary factor and offset, thus assuming that human emissions have little effect. Mathematically that seems right, but that violates all known observations, including Henry’s law for the solubility of CO2 in seawater and the equality of any CO2 for the sinks, whatever the source…
The factor isn’t arbitrary – it is precisely what is needed to make the variability match up. Both the variability and the slope match as close to perfectly as you could likely ever expect in the real world with error-prone data.
There is no violation of Henry’s Law. It is, in fact, the action of Henry’s Law in a dynamic flow environment that causes the ppmv/degC/unit-of-time sensitivity.
You can rationalize, and draw epicycles all you like, but you are just fooling yourself.
Bart,
Henry’s law is about ppmv/degC, not ppmv/degC/unit-of-time. The latter part in your formula has nothing to do with Henry’s law, as any net flux between oceans and atmosphere stops when the (dynamic) equilibrium is reached again.
By comparing temperature with the derivative of CO2, you are comparing apples with oranges. You can compare T with CO2 and dT/dt with dCO2/dt: CO2 lags T (be it mainly for the variability, hardly for the trend) and so do the derivatives, with zero trend in dT/dt. That is because the CO2 variability is mainly the transient response of vegetation to temperature variability.
By comparing T to dCO2/dt, you have already removed most of the trend in CO2, which is slightly quadratic, the rermaining slope is rather linear in the derivative. It is no problem to match two slopes and the variability if the slopes are not too different, but that says next to nothing about cause and effect: any sinusoid-like transient response with a lag does fit the timing of the original sinusoid without a lag in the derivative if the response is slow enough.
With your arbitrary offset and factor you simply attribute all increase in rate of change to temperature, while the real origin of the variability in dCO2/dt is dT/dt, which has zero slope…
“…but you are just fooling yourself.”
Bart, you’ve gotta knock off this “nice guy finishes last” stuff!(☺) F is not fooling himself, he’s trying to fool everybody else. (leave the charity for sunday mornings, not the blogs)…
This rubbish about arbitrary offset and factor demostrates the (alinsky) power of STUPID. When it comes to making a graph to compare temperature with the carbon growth rate a scale MUST be used. One curve is measued in ppm and the other in degrees. THERE IS NO OTHER WAY TO COMPARE THE TWO GRAPHS. And when we do, viola (!), they are a near perfect match. Not only with the interannual variability, but with the the longer term trend (a it’s trend features) as well. This is something that F has no answers for (exceptin’ lies)…
NOTE ALSO, the scale used is a prefect match with ice cores where ice cores are at their greatest stability (before substantial changes in the growth rate, calculated from temps, from the warming a century ago). F has a wonderful graph that shows the calculated ppm back at the turn of the century based on temperature which is an exact match. This would not happen with ANY OTHER SCALE BEING USED! (so much for an “arbitrary factor”) Keep up the good fight, Bart. Hopefully the good Lord will give us a nice long cooling spell in the near future so that F will be dispenced with once and for all. Tis a shame that he has to “cotton bomb” every carbon data thread here at wuwt. (much like d.c., he really stunts the debate)…
p.s. i really enjoyed our discussion a while back on economics. (thanx… i really sensed that it was putting you to sleep!) i think your point about economic stability is not without merit. Now that trump is potus i’d really like to revisit it with you at some point. i think he’s going to have a rough go at it unless he yanks yellen from the fed chair. Should be interesting to watch, so keep an eye on those interest rates… fonzie
“(a it’s trend features)” should read “(and its trend features)”
Well, Fonzie, I don’t think Ferdinand is intentionally lying. I think he is a good person. I think the system is just more complex than he comprehends at this time. But, he is not an AGW advocate. I think he wants to put the CO2 attribution question to bed because he thinks it is not the way to win the argument (please feel free to correct me if that is not the case, Ferdinand).
I do not believe I can convince him, or many others, at this time. I just try to keep the controversy alive because one day it will dawn upon them that the connection between atmospheric concentration and emissions just doesn’t hold up, and I want people to be ready to accept the alternative.
But, your support is appreciated. I do not recall specifically what that economics discussion was about, but I’m glad you enjoyed it.
Why is it that i see a rat where you see a “good person”? (☺)
Our chat about economics was about the federal reserve’s policy to ward off inflation and enhance economic stability by keeping the unemployment rate artificially high (at no less than 4%). The inflation argument is bunk (being very similar to the mass balance argument). You don’t do people any favors by making people so poor that they can’t even afford cheaper prices, which is all that the fed does. The point that YOU made to me was the economic stability argument which i think could have some merit. My thinking is that the unemployment rate is probably the wrong metric to use regarding economic stability. It’s more likely the shear size of an economy which causes economic instability (or greater crashes). Evidence for the unemployment rate alone is scant. Recessions were not deeper before the 70s. (that is to say, the period before fed regulation began to tighten things up and after the safeguards enacted during the great depression) 2008, on the other hand, may be a good example of an economy that was simply so large/hot that the crash was deep. (hard to say… maybe the unusual drags were what did it, but the size may have had something to do with it, too) By the summer of ’08 the unemployment rate was low, worker participation rate was high, world wide economic growth high, resulting oil prices were high and so also was inflation. That’s virtually every metric of economic activity (including, of course, simply the larger number people working as compared to the 50s and 60s). If the shear size of an economy causes greater crashes then this could spell trouble in the years to come. In the immediate short term it should be interesting to see how trump deals with things. He’s pledging to ramp up economic growth to 6%. Yellen on the other hand has begun the process of shutting the economy down. Should be interesting to see how this plays out… Bart, i can see that i’m putting you to sleep here again. (yer eyes are gettin’ droopy!) Didn’t want to go too deep here, just a refresher about what we discussed. If trump doesn’t know much about economics (as opposed to business) then his could be a bumpy ride. (and if he doesn’t lock hillary up, she could wind up becoming potus come 2020… never underestimate the staying power of the clintons) His whole presidency rests on his economic success and that ain’t likely with fed policy being what it is. Should be fun to watch…
Fonzie,
Indeed, as Bart says, I am far from a AGW adept, just think that CO2 may have some modest – mostly beneficial – effect on temperature, far below what the climate models make of it.
My problem with a non-human origin of the CO2 rise is that it is a lost battle: every single observation points to the human origin. Every alternative fails one or more observations and Bart’s mathematical solution fails every observation. That is where the “consensus” is very strong and it undermines the credibility of the better arguments from the skeptics…
About curve fitting: of course you need an offset and a factor to match two variables with a linear slope. That is not that difficult if the slopes are not too different. And in this case, T and dCO2/dt have exactly the same timing of the waveforms, simply because the variability of CO2 around the trend follows the variability of temperature with ~90 degr. as a transient response. If you take take the derivative of CO2, you shift the waveform some 90 degr. back in time and voila, you have a perfect timing.
While the waveforms match, that gives zero information about what caused the slopes. By comparing T with dCO2/dt, you have largely detrended the total CO2 change (which is slightly quadratic, leaving only a linear slope in the derivative). By using an arbitrary factor and offset, you simply attribute all slope in the CO2 derivative to temperature, while another player: human emissions has about twice that slope in the derivatives, but is completely ignored by the arbitrary “match”.
Thus, in my opinion, comparing T with dCO2/dt doesn’t make sense as comparing the real causes and effects is between human emissions and T for CO2 (which shows the real impact of T variability: +/- 1.5 ppmv around a 80 ppmv trend and double that in emissions) or compare dT/dt with dCO2/dt, which shows exactly the same waveforms, but with the normal lag of ~90 degr. and zero slope for dT/dt and the double slope for emissions dCO2/dt, without much variability…
Many skeptics are overfocused on the nice match of the waveforms in the variability of the derivatives, but that is only for +/- 1.5 ppmv at the extremes (Pinatubo, El Niño) and says next to nothing about the cause of the slope, as the variability zeroes out after 1-3 years.
The slope is a nice match with the difference between human emissions and net sink rate, which is in ratio to the extra pressure of CO2 above steady state of the oceans per Henry’s law…
“If you take take the derivative of CO2, you shift the waveform some 90 degr. back in time and voila, you have a perfect timing.”
The problem with that approach is that, if anthropogenic CO2 is subject to dissipation in that manner, so is natural CO2, and the atmosphere would have been depleted of CO2 entirely over eons past.
Atmospheric CO2 is maintained by a balance of incoming and outgoing parcels. A sustained imbalance in those flows results in a steady change that can be sustained for as long as it takes the THC to circulate. And, such an imbalance can be induced by a change in temperature.
Bart,
if anthropogenic CO2 is subject to dissipation in that manner, so is natural CO2, and the atmosphere would have been depleted of CO2 entirely over eons past.
Indeed, it doesn’t matter if some CO2 injection is caused by humans, volcanoes, etc. That doesn’t imply a complete depletion of CO2, as the removal rate is directly proportional to the extra CO2 pressure above steady state for the average ocean surface temperature… Once that is reached – if ever – the net flux is zero.
Atmospheric CO2 is maintained by a balance of incoming and outgoing parcels. A sustained imbalance in those flows results in a steady change that can be sustained for as long as it takes the THC to circulate. And, such an imbalance can be induced by a change in temperature.
There can’t be a sustained imbalance in water parcels, as water doesn’t pile up at one place (except in the neighborhood of huge land/ice masses). There may be a change in CO2 concentration of what is upwelling, but that is met with an increase in the atmosphere:
http://www.ferdinand-engelbeen.be/klimaat/klim_img/upwelling_incr.jpg
Temperature has hardly any influence on the THC upwelling/sink rates of water flux, as temperature hardly changes in equatorial and sink areas, most is wind driven and density driven at the edge of the ice formation. Even so, a temperature increase of 1 K both in the upwelling and sink areas is completely compensated by 16 ppmv increase in the atmosphere per Henry’s law and the original CO2 in/out fluxes with the ocean waters are restored…
Ferdinand
can you just explain again to us how you came to the 16 ppm?
I note the atmosphere itself does not have a constant volume….
http://www.seeker.com/earths-shrinking-atmosphere-baffles-scientists-discovery-news-1766491731.html
HenryP:
can you just explain again to us how you came to the 16 ppm?
I note the atmosphere itself does not have a constant volume….
The 16 ppmv is what was measured from over 3 million seawater samples in equ8ilibrium with the atmosphere above it. More accurate: it is the equilibrium between the CO2 pressure in seawater with the partial pressure of CO2 (pCO2) in the atmosphere. The difference with ppmv is a few %, as ppmv is the CO2 volume ratio in the dry atmosphere while the partial pressure (in μatm) is for the wet atmosphere just over the sea surface.
The volume of the atmosphere plays little role, as only the pCO2 near the surface is at play. That is currently around 0.0004 bar. Quite low for pressing any CO2 in the ocean waters – or reverse.
Total atmospheric pressure also plays a small role,, as pCO2 is in ratio to total air pressure, but that levels out to average over longer periods. That too is maximum a few percent in variability around the pCO2 difference between oceans (mainly temperature dependent) and atmosphere and the resulting in- or outflux (which is only pressure difference dependent)…
there is no formula?
pCO2 in seawater: that depends a lot on [HCO3 (1-)]
there are many, many giga tons of carbonates in the oceans
which presumably originally came from volcanic activity
so how do you measure and assess the [CO3(2-)] i.e. volcanic activity of earth [reportedly more activity underneath the oceans’ floors than that of the continents]
truth is: CO2 follows warming and cooling; currently it is cooling.
According to my calculations at least until 2037
Ferdinand Engelbeen @ November 17, 2016 at 5:45 am
“That doesn’t imply a complete depletion of CO2, as the removal rate is directly proportional to the extra CO2 pressure above steady state for the average ocean surface temperature… Once that is reached – if ever – the net flux is zero.”
This expresses the error in your thinking. You assume there is some steady state that just happens. Magically. It just is.
In actual fact, steady state is always reached by a balance enforced by negative feedback. And, if the feedback maintains the balance such that temperatures have little impact, then it will maintain it in the face of human inputs as well.
“There can’t be a sustained imbalance in water parcels, as water doesn’t pile up at one place (except in the neighborhood of huge land/ice masses).”
We’re not talking about water piling up. We’re talking about CO2 content of the waters piling up.
guys
remember that pCO2 in the oceans depends on [HCO3-] which depends on [CO3] which depends on volcanic activity
more than 70% of volcanoes are underneath the ocean floors
we are talking about parameters that cannot reliably measured
at present…
Bart, the ways i sees it, the CO2 that comes from the upwelling (thermocline) waters is no more part of the “carbon cycle” than ACO2. As long as SSTs are above the equilibrium state temperature, the upwelling waters hit the surface and outgas accordingly. (and what happens after that fact should be the same as ACO2) So if ACO2 is thought to cause a rise in atmospheric concentrations, then the same logic should be applied to the outgassed CO2 from the upwelling waters…
Yes, Fonzie, with the added proviso that what is upwelling in the oceans is vastly larger than puny human inputs, and so dominates the observations. There is an impact from human releases, but it is comparatively very small.
Henry,
Here is the formula:
(pCO2)sw @ Tin situ = (pCO2)sw @ Teq x EXP[0.0423 x (Tin-situ – Teq)]
That is used as a correction for the difference in temperature between the seawater intake and the temperature at the measuring device, usually less than 1 K.
Explanation at:
http://www.ldeo.columbia.edu/res/pi/CO2/carbondioxide/text/LMG06_8_data_report.doc
More about solubility, pH, concentrations:
http://www-naweb.iaea.org/napc/ih/documents/global_cycle/vol%20I/cht_i_09.pdf
Land volcanoes emit about 1% of what humans do, based on CO2 measurements around active volcanoes like mount Etna in Sicilia/Italy. If underwater volcanoes are emitting 10 times that amount, that still is less than 1 GtC/year, dissolving in the 38,000 GtC already present in the deep oceans…
Bart:
You assume there is some steady state that just happens. Magically. It just is.
In actual fact, steady state is always reached by a balance enforced by negative feedback. And, if the feedback maintains the balance such that temperatures have little impact, then it will maintain it in the face of human inputs as well.
Based on 800,000 years of ice cores, there is a steady state between oceans and atmosphere which changes with 16 ppmv/K over very long periods. There are changes of ~8 ppmv/K over centuries (MWP-LIA) and on shorter time scales 4-5 ppmv/K (seasonal, year by year) with direct measurements. There is zero indication in any time period of the past by direct (ice cores) measurements or proxies that CO2 changed with over 100 ppmv/K as in this period.
The negative feedback to temperature changes is a change of 4-16 ppmv/K CO2 in the atmosphere, 5 ppmv/K for seasonal changes, 4-5 ppmv/K for year by year changes and 16 ppmv/K over many millennia, until steady state is reached again.
The negative feedback to pressure changes in the atmosphere is a change in the in/out balances, removing part of the pressure change until steady state is reached again.
We’re not talking about water piling up. We’re talking about CO2 content of the waters piling up.
Which simply is impossible. CO2 moves with the waterflow from source to sink, there is hardly any movement from CO2 in the waterflow backward or forward or sideward or downward. It can’t pile up if the waters don’t pile up. The only escape route is towards the atmosphere, but if the CO2 concentration in the upwelling waters remains constant then the pCO2 pressure remains constant for a fixed temperature and only changes with temperature with not more than 16 μatm/K.
Fonzie,
As long as SSTs are above the equilibrium state temperature, the upwelling waters hit the surface and outgas accordingly.
The outgassing not only depends of the CO2 pressure in the upwelling waters – which depends of its temperature – it also depends of the CO2 pressure in the atmosphere. The outgassing is in direct ratio to the pCO2 difference between water and atmosphere.
At the upwelling sites, the pCO2 of the oceans is ~750 μatm in the atmosphere around 400 μatm. The difference of 350 μatm is good for an outgassing of ~40 GtC/year. If the levels in the atmosphere ever reach 750 ppmv (~= μatm), the outgassing would be zero, despite the high temperature.
Increase the temperature at the upwelling sites with 1 K above your “equilibrium state temperature” and immediately the local ocean pCO2 increases from 750 μatm to 766 μatm. Thus increasing the outgassing to 366/350 = 105%, or a new outgassing flux of 41.8 GtC/year. The opposite happens at the sink places: decreased outflow for higher ocean temperatures.
That gives that the CO2 levels in the atmosphere increase over time: thus reducing the pCO2 difference at the upwelling zones adn increasing them again at the sinks. At 416 ppmv in the atmosphere, the pCO2 difference between oceans and atmosphere is again 350 μatm, what it was before the temperature increase and the original outgassing of ~40 GtC/year is restored…
All what an increase in temperature does is increasing the pCO2 of the atmosphere with maximum 16 ppmv/K, then it stops…
Ferdinand Engelbeen @ November 17, 2016 at 5:24 pm
“Based on 800,000 years of ice cores…”
Unverifiable data with unknown dynamics. It does not matter. Since at least 1958, the rate of change of atmospheric CO2 has been proportional to appropriately baselined temperature anomaly. That is all you need to know. No need to speculate about goat entrails and tea leaves. We have modern, accurate data which tell the story in our time.
“Which simply is impossible.”
Absolute nonsense. CO2 distribution in the oceans is neither uniform nor homogeneous. It depends very, very, very heavily on temperature gradients. Change the gradients, and you change the CO2 distribution.
Ferdinand Engelbeen @ November 17, 2016 at 5:47 pm
“The outgassing is in direct ratio to the pCO2 difference between water and atmosphere.”
Yes, and as less CO2 is downwelling than is upwelling due to the temperature change, that leads to a steady rise in the pCO2 of the portion of the oceans in contact with the atmosphere, and thus the pCO2 of the atmosphere steadily rises.
“All what an increase in temperature does is increasing the pCO2 of the atmosphere with maximum 16 ppmv/K, then it stops…”
Incorrect. This is body of water with continuously flowing constituents, not a static pool.
Bart:
Unverifiable data with unknown dynamics.
I know, you don’t like the data, so they must be wrong…
As these data fits Henry’s law for a static as well as for a dynamic equilibrium, the data are verified.
It does not matter. Since at least 1958, the rate of change of atmospheric CO2 has been proportional to appropriately baselined temperature anomaly.
Just curve fitting and comparing apples with oranges: comparing the non-detrended temperature with a more or less linear increase with the derivative of the slightly quadratic increase of CO2 in the atmosphere, which also results in a linear slope, thus where the CO2 increase is largely detrended into space…
That has no ground in any physical process…
That is all you need to know.
Except that the alternative explanation fits all the data at least as good and moreover fits all other observations, while yours fits none…
Yes, and as less CO2 is downwelling than is upwelling due to the temperature change, that leads to a steady rise in the pCO2 of the portion of the oceans in contact with the atmosphere, and thus the pCO2 of the atmosphere steadily rises.
OK, we may finally agree that the upwelling ocean waters bring a rather constant amount of CO2 to the surface. There was some misinterpretation of my side.
Let’s start with a fixed average temperature and a dynamic equilibrium between releases and uptakes.
If you increase the temperature over all ocean surfaces, more CO2 is released in warmer zones and less is absorbed in colder zones, thus the ocean surface is containing less CO2 than before the warming as the exchange is between oceans and atmosphere, not internal the oceans. That amount of CO2 is transported into the atmosphere, because of the change in pCO2 difference between oceans and atmosphere.
The rise in atmospheric pCO2 has the opposite effect on the CO2 in/out fluxes, that makes that there is no steady rise of CO2 in the atmosphere, the rise reduces to zero when influx and outflux are equal again. At that moment the ocean surface CO2 content is the same at every spot as before the temperature rise, only both the pCO2 of the oceans and of the atmosphere did rise with 16 μatm/K…
Incorrect. This is body of water with continuously flowing constituents, not a static pool.
It really doesn’t make any difference: for a fixed influx of water with a fixed concentration of CO2 at a fixed temperature, the influx is constant. The same for the outflux.
Increase the temperature and the in/outflux changes which results in a pCO2 increase in the atmosphere.
Increase the pCO2 of the atmosphere and the in/outflux changes which results in less pCO2 increase in the atmosphere.
At 16 μatm/K increase, the original fluxes are restored.
Increase the pCO2 of the atmosphere further and the in/outflux changes which results in more CO2 uptake by the oceans than release.
Which is what we have now at 110 ppmv above steady state and a net imbalance of 3 GtC/year into the deep oceans…
“I know, you don’t like the data, so they must be wrong…”
I like the data, so they must be right. That knife cuts both ways.
It is a moot question. Since at least 1958, the rate of change of atmospheric CO2 has been proportional to appropriately baselined temperature anomaly. Since that time, at least 72% of the rise from the “pre-industrial level” has been recorded.
“Except that the alternative explanation fits all the data at least as good and moreover fits all other observations, while yours fits none…”
It is aphysical – natural and anthropogenic inputs must be treated the same. The rest is just rationalization of incomplete data shoehorned into your paradigm.
“If you increase the temperature over all ocean surfaces, more CO2 is released in warmer zones and less is absorbed in colder zones…”
You are getting wrapped around the axle in details. Fundamentally, the surface oceans are receiving new CO2 from upwelling waters. Due to a change in temperature, less of that CO2 downwells. The net result is an accumulation of CO2 in the surface waters. The atmospheric concentration is proportional to the content of the surface waters. Hence, there is an accumulation in the atmosphere as well.
“At 16 μatm/K increase, the original fluxes are restored.”
No. The surface waters are accumulating CO2. As a result, the atmosphere must also accumulate CO2. The leakage of CO2 to the atmosphere relieves a tiny portion of the pressure on downwelling, it does not enhance it. Temperature acts as a throttle on downwelling, and this necessarily leads to accumulation in the surface waters, and hence to the atmosphere.
Bart:
Since at least 1958, the rate of change of atmospheric CO2 has been proportional to appropriately baselined temperature anomaly.
Right for the variability, which is the result of a transient response of vegetation to temperature changes, but zeroes out in 1-3 years. Just curve fitting without physical base for the slopes, as that isn’t caused by vegetation. Two separate processes at work,
It is aphysical – natural and anthropogenic inputs must be treated the same.
They are threated the same, but the reaction of the sinks and sources is very different – and largely independent – on temperature changes than on pressure changes.
Due to a change in temperature, less of that CO2 downwells. The net result is an accumulation of CO2 in the surface waters.
Any parcel of CO2-rich water reaching the atmosphere in a warmer ocean surface loses more CO2 to the atmosphere, thus is getting more depleted. As at the sink side there is less absorption by the waters too, the total ocean surface gets more depleted. All accumulation is in the atmosphere, not in the ocean surface.
The leakage of CO2 to the atmosphere relieves a tiny portion of the pressure on downwelling, it does not enhance it.
Nice fantasy, not based on reality. Reality is that at the upwelling and sinking areas what counts is the pressure difference between atmosphere and ocean surface (and wind speed for the speed of release or uptake). For a fixed average wind speed, the CO2 flux between oceans and atmosphere is directly proportional to the pCO2 difference between ocean surface and atmosphere.
If the temperature increases, the CO2 input into the atmosphere at the upwelling areas is increased, proportional to the increased pCO2 of the ocean surface to the atmospheric pCO2. Opposite at the sinks.
If the pCO2 in the atmosphere is increased, the CO2 input into the atmosphere at the upwelling areas is decreased, proportional to the increased pCO2 of the atmosphere to the ocean surface pCO2. Opposite at the sink areas.
The net result is that with an increase of 16 ppmv in the atmosphere / K increase of the ocean surface temperature, the original in/out fluxes are restored…
“All accumulation is in the atmosphere, not in the ocean surface.”
Nonsense. If there is accumulation in the atmosphere, there is accumulation in the ocean surface. It is a bilateral relationship. It holds regardless of which one of us is right.
“Opposite at the sinks.”
Opposite, but not equal. And, that inequality results in accumulation.
“If the pCO2 in the atmosphere is increased, the CO2 input into the atmosphere at the upwelling areas is decreased, proportional to the increased pCO2 of the atmosphere to the ocean surface pCO2.”
But, not the upwelling itself. The same amount is coming up regardless.
But, yes, they will outgas when they come up, so less is available to flow to the downwelling areas within the meridional currents. At the poles, the atmospheric pressure restores some of the concentration of the downwelling flow, as you contend, but it is only replacing what has already been taken out.
Thus, the atmospheric dynamics have negligible net impact on the overall oceanic flow. CO2 is continually coming up with upwelling waters, and less CO2 goes down. The resulting imbalance produces a sustained rise in surface ocean content, which in turn produces a sustained rise in atmospheric concentration.
Bart:
Nonsense. If there is accumulation in the atmosphere, there is accumulation in the ocean surface. It is a bilateral relationship. It holds regardless of which one of us is right.
With a constant supply of CO2 from the upwelling, a higher ocean temperature results in more CO2 release from the warm oceans near the equator and less uptake by the cold waters near the poles. That results in an overall depletion of the total water mass moving from upwelling to sinks and less CO2 sinking into the deep oceans. All accumulation is in the atmosphere (without human or volcanic emissions). Still some problems with mass balances?
CO2 is continually coming up with upwelling waters, and less CO2 goes down. The resulting imbalance produces a sustained rise in surface ocean content, which in turn produces a sustained rise in atmospheric concentration.
The above shows that the imbalance produces a depletion in the surface ocean CO2 content, not a rise. The rise is entirely in the atmosphere. Because of the increasing CO2 pressure in the atmosphere, the influx of CO2 at the upwelling gets reduced and at the sinks gets increased, restoring the original in/out fluxes at 16 ppmv/K…
You’ve become confused, Ferdinand. There is no reality in which a constriction of CO2 carried by downwelling results in a depletion of CO2 in the surface system.
Bart:
You’ve become confused, Ferdinand. There is no reality in which a constriction of CO2 carried by downwelling results in a depletion of CO2 in the surface system.
You still still have problems with mass balances…
Assuming steady state at the start at ~40 GtC CO2 in and out the ocean surface and no human emissions and large volcanic eruptions adding CO2 into the atmosphere:
– The increase in temperature at the upwelling side increases the pCO2 of the ocean surface. That increases the pCO2 difference between ocean surface and atmosphere and thus the influx of CO2 from the upwelling into the atmosphere. Let’s say from 40 to 42 GtC/year.
– The increase in temperature at the sinks side increases the pCO2 of the ocean surface. That decreases the pCO2 difference between atmosphere and ocean surface and thus the outflux of CO2 from the atmosphere into the ocean surface. Let’s say from 40 to 38 GtC/year.
– The net result is a depletion of 4 GtC/year in the ocean surface and 4 GtC/year less sinking in the deep oceans than is upwelling. Nowhere is there any mass increase of CO2 in the ocean surface.
– All of the 4 GtC/year CO2 mass increase is in the atmosphere, or you are violating the mass balance…
You have gone from the pseudo-mass balance argument to completely turning mass balance on its head here. Both maladies proceed from your inability to envision things in a dynamic framework.
It happens when you try to lay things out sequentially, as in your list here. But, as you hop from one step to the next, the natural world is undergoing infinite recursions which invalidate your next step before you even get there. By the time you get to
“– The net result is a depletion of 4 GtC/year in the ocean surface and 4 GtC/year less sinking in the deep oceans than is upwelling. Nowhere is there any mass increase of CO2 in the ocean surface.”
whole new parcels of upwelling CO2 laden waters have entered the system, and you’re dealing with an entirely different ocean than the one with which you started.
Bart:
By the time you get to
“– The net result is a depletion of 4 GtC/year in the ocean surface and 4 GtC/year less sinking in the deep oceans than is upwelling. Nowhere is there any mass increase of CO2 in the ocean surface.”
whole new parcels of upwelling CO2 laden waters have entered the system, and you’re dealing with an entirely different ocean than the one with which you started.
Bart, you have no idea what happens between the ocean surface and the atmosphere.
Let us start with one parcel of water with a fixed CO2 content that is upwelling near the equator, gets transported over the ocean surface and sinks into the deep near the poles.
The only exchange of CO2 from that water parcel is with the atmosphere. Hardly any exchange occurs with adjacent water parcels, neither with the deep oceans during its surface transport.
One upwelling parcel releases a lot of CO2 after heating up at the surface and during transport, it releases smaller quantities of CO2 until it is in equilibrium with the atmosphere. With further cooling it starts to absorb CO2 out of the atmosphere with a maximum absorption at the cold sink places.
The amount of CO2 released and absorbed of one parcel depends of the ocean temperature at one side, as that determins the pCO2 of the ocean surface and at the other side, the pCO2 (~ppmv) of the atmosphere. The pCO2 difference is what gives the in and out fluxes of CO2 between ocean surface and atmosphere.
At steady state the amount of CO2 released by one parcel during the warmer part of the trip equals the amount of CO2 absorbed in the colder part of the trip and the CO2 content of the parcel decreases from the upwelling to the point that the pCO2 of ocean surface and atmosphere are equal and increases again until it sinks in the deep. In total there is zero change in the atmosphere and what sinks is the same amount of CO2 as what was upwelling. The integral of all CO2 in/out movements of one parcel at steady state is zero.
As the next parcel that is upwelling does exactly the same trajectory. the total amount of CO2 moving in and out is simply that of one parcel x the number of parcels transported / unit of time. Estimated around 40 GtC/year.
At steady state at every point in the ocean surface there is the same in or out transport with the atmosphere at any moment of time and the same CO2 concentration in the ocean surface, because the next parcel had the same temperature trajectory during its trip.
I hope we agree up to this point…
Back to the discussion:
Heat the ocean surface up with 1 K. Any parcel of water that is upwelling will get warmer and will release more CO2. During its transport it cools down, but the point of equal pCO2 between water and atmosphere moves polewards, thus in total there is more release of CO2 than before the warming. While moving further towards the sinks, the parcel also absorbs less CO2 out of the atmosphere. Thus more release and less uptake.That gives that at any point of the oceans the parcel will contain less CO2 than before the warming and less is sinking into the deep.
The same happens with the next parcel given the same disequilibrium and thus net CO2 release. So far so good for your theory: every new parcel brings the same amount of extra CO2 into the atmosphere, be it that you were wrong that it occurs via accumulation in the ocean surface. The ocean surface gets more depleted and all accumulation is in the atmosphere.
Where you go completely wrong is that you don’t take into account the effect of any CO2 pressure increase in the atmosphere, no matter what causes it (including a warming of the surface). For every parcel going from upwelling to sinks any extra pressure in the atmosphere has the same effect: less release of CO2 at the warm ocean parts and more uptake at the colder parts, thus enriching the ocean surface on every point, compared to before a CO2 pressure increase and more CO2 sinking in the deep. The net result depends of the average pCO2 difference between ocean and atmosphere. For one parcel the extra net release from a warming ocean is completely compensated with an increase of 16 ppmv ppmv in the atmosphere for 1 K ocean surface warming.
For every new upwelling parcel the same effect happens over its traject from source to sink. Thus the total effect is that of one parcel x number of parcels / time period.
The fact that there is a continuous upwelling of new parcels doesn’t change the fact that for an increase of 16 ppmv/K a new steady state is reached between warming upwelling waters and the atmosphere…
Sorry, but where is the data on global fossil fuel production/usage these past 20 years?
Richard, BP Statistical Review of World Energy 2016 is one such source.
See URL on bottom plot above. CDIAC site.
I’m sorry but this propaganda piece is one of the biggest bullshit stories in the history of mankind.
The many thousands if not millions of highly educated supposedly technically proficient scientists out there in climate work just do not understand what is really going on! So to cover for the deep mystery, as there can be no cracks in their armor, they make up this convoluted explanation that obscures the basic facts.
The sun’s energy deposited into the ocean peaked early in 2016, and since then it is going the other way.
Henry’s law.
Bob,
Henry’s law gives 16 ppmv/K for the area weighted average ocean temperature change. Thus good for 16 ppmv since the LIA. That is all. We are now 120 ppmv above the old equilibrium. The rest of the 104 ppmv increase is from humans, which emitted over 200 ppmv since ~1850…
The oceans are not static, and you are misapplying Henry’s Law.
Bart,
Henry’s law is for every place on earth between the ocean surface and the atmosphere. No matter if that is static in a closed sample or dynamic over the world wide oceans where ~40 GtC/year as CO2 moves out of the oceans at the upwelling places and ~40 GtC/year as CO2 sinks with the THC waters into the deep oceans.
It doesn’t matter for both cases: for 1 K temperature increase the ultimate increase in CO2 is 16 ppmv in the atmosphere. All what happens in the dynamic case is that warming makes that the CO2 influx temporarely increases and the CO2 outflux temporarely decreases. The opposite happens when CO2 in the atmosphere increases until 16 ppmv/K is reached and the original in/out fluxes are restored:
http://www.ferdinand-engelbeen.be/klimaat/klim_img/upwelling_temp.jpg
Sorry, Ferdinand, no. Henry’s law tells you steady state proportionality for a closed system. When you have an open system that is not in steady state, it does not apply directly, but must be modified for the flow regime. I have shown you the math countless times. The result is a time dependent sensitivity in ppmv/degC/unit-of-time.
Bart,
What part of the oceans that does exchange CO2 with the atmosphere (in ánd out) is static? The oceans exchange CO2 in a full dynamic way with the atmosphere, both between the upwelling at the equator and the sink places near the poles and over the seasons. The latter is a fast, huge, but limited player (more or less static for the ocean surface), the former is what gives the dynamic equilibrium between deep oceans and the atmosphere.
Whatever the original in/out fluxes were, any change of 16 ppmv/K in the atmosphere will restore the original fluxes after some time. That is a full dynamic response of the fluxes to a changed temperature of the ocean surface at the main source and sink places.
Your math doesn’t match reality, it is only curve fitting without a physical process behind it: it is impossible that a small temperature offset from an arbitrary base level gives a constant extra flux of CO2 into the atmosphere without any immediate reaction of the in/out fluxes on the changing CO2 pressure in the atmosphere. For warming oceans the increasing CO2 pressure in the atmosphere reduces the influx and increases the outflux until a new dynamic equilibrium (or the previous disequilibrium) is reached again per Henry’s law. That is ppmv/K not ppmv/K/time-period…
“Whatever the original in/out fluxes were, any change of 16 ppmv/K in the atmosphere will restore the original fluxes after some time.”
No, it won’t. The atmosphere has negligible effect on oceanic flows. It is the flea to the ocean’s elephant.
“Your math doesn’t match reality…”
It does.
Bart,
We are talking here on CO2 fluxes, not water fluxes…
If there was no exchange between the oceans and the atmosphere, the upwelling CO2 rich waters would simply transport all CO2 contained in it to the poles and sink again. No matter how much water is circulated and how much CO2 it contains. CO2 doesn’t accumulate in the ocean surface waters, as that is what you seem to think: it is simply transported with the ocean flows and there is hardly any (CO2 or other) exchange with the deeper oceans by the surface transport flows and certainly not with parcels of water before or behind it and very limited with the waters outside the main ocean flows.
The only huge CO2 exchanges are with the atmosphere: ~40 GtC/year out of the deep oceans near the equator, ~40 GtC/year into the deep oceans near the poles. The increased CO2 pressure in the atmosphere gives a current unbalance of ~3 GtC/year between the decreased CO2 upwelling and increased sink fluxes… That is simple logic as the CO2 fluxes between oceans and atmosphere are directly proportional to the pCO2 difference between them.
Your math doesn’t take into account the effect of the increased CO2 pressure in the atmosphere on the CO2 exchanges between atmosphere and oceans…
“…the upwelling CO2 rich waters would simply transport all CO2 contained in it to the poles and sink again.”
No, you are wrong. For a given surface temperature, if held, the CO2 of the oceans would approach a particular steady state distribution. Change that surface temperature, and the distribution changes, with time constants approaching centuries if not millennia.
“Your math doesn’t take into account the effect of the increased CO2 pressure in the atmosphere on the CO2 exchanges between atmosphere and oceans…”
Yes, it does. Quite explicitly. The increase in pressure in the atmosphere is caused by the increased content of the surface waters. You can cause and effect reversed.
You have cause and effect reversed.
Bart:
No, you are wrong. For a given surface temperature, if held, the CO2 of the oceans would approach a particular steady state distribution. Change that surface temperature, and the distribution changes, with time constants approaching centuries if not millennia.
For a given temperature and CO2 concentration, the pCO2 of the oceans is constant and the CO2 outflux at the upwelling zones is in direct ratio to the pCO2 difference between ocean and atmosphere. The same, but reverse, at the sink zones.
If the temperature changes, the pCO2 of the upwelling zones and sink zones changes with 16 μatm/K, leading to a change of in and out flux in ratio to the change in pCO2 difference. The change in pCO2 difference is fully compensated with a change of 16 ppmv/K in the atmosphere and the original fluxes are restored. That is a matter of years, not even decennia.
Human emissions are currently ~4.5 ppmv/year. After only 4 years that surpasses any effect of 1 K temperature change on CO2 levels in the atmosphere…
I have worked a few years in a cola bottlery (Royal Crown, don’t know if they still exist). If the temperature of the liquid mid summer couldn’t get cool enough, just increase the CO2 pressure to push enough CO2 in the cola…
Yes, it does. Quite explicitly. The increase in pressure in the atmosphere is caused by the increased content of the surface waters. You have cause and effect reversed.
Bart, there is no increased content of CO2 in the surface waters: CO2 in the waters is simply moved from upwelling to sink together with the waters, as there is hardly any exchange of waters, neither of their CO2 content.
The only CO2 exchange is with the atmosphere: it enters the atmosphere near the equator and it is absorbed back into the oceans near the poles, depending of the pCO2 difference between atmosphere and ocean surface. Currently ~3 GtC/year more sink than source…
“Bart, there is no increased content of CO2 in the surface waters:”
Ridiculous. If atmospheric CO2 is increasing, then oceanic content is also increasing. You can’t have one without the other. Remember Henry’s Law?
Bart says
If atmospheric CO2 is increasing, then oceanic content is also increasing
…remember Henry’s Law?
Henry says
now you made me curious
cause I don’t remember anymore what I wrote there….
can you just put that law in writing in front of us for all to see?
Bart:
Ridiculous. If atmospheric CO2 is increasing, then oceanic content is also increasing. You can’t have one without the other. Remember Henry’s Law?
Sorry? This is what you always were saying: that CO2 is accumulating in the oceans because of ever incoming new parcels with extra CO2, thus the ocean is accumulating CO2 and that is the cause of the increase in the atmosphere, not reverse…
What really happens is that at the upwelling areas, cold, CO2 rich, waters are emerging and warmed up at the surface. The result is that the pCO2 of the ocean waters gets much higher than in the atmosphere (750 μatm vs. 400 μatm). That results in a huge flux of CO2 out of the upwelling waters into the atmosphere (several estimates come at around 40 GtC/year). That depletes the upwelling waters from CO2, until the pCO2’s from water and atmosphere are equal.
If the local waters increase in temperature, the local pCO2 goes up with 16 μatm/K and so does the flux in ratio. Thus warmer temperatures only deplete the ocean waters at the upwelling side even more.
As long as there is no change in total water upwelling and its CO2 (+derivatives) content is constant, the influx of CO2 is constant for a fixed temperature. For an increase of 1 K , the increase in flux is temporarely until the atmosphere equals the 16 μatm increase in pCO2 of the oceans.
Once the waters flow in cooler areas, the pCO2 drops below that of the atmosphere and the waters start to absorb CO2 out of the atmosphere.
As long as the source rate equals the sink rate, nothing happens with the CO2 concentration in the atmosphere. That is for the current average ocean temperature around 290 ppmv.
We are currently at 400 ppmv in the atmosphere. Thus indeed the net flux of CO2 is from the atmosphere into the oceans, not reverse…
“This is what you always were saying: that CO2 is accumulating in the oceans because of ever incoming new parcels with extra CO2, thus the ocean is accumulating CO2 and that is the cause of the increase in the atmosphere, not reverse…”
Yes, that is correct. You have countered by saying that oceanic CO2 is not increasing. But, that is false, because oceanic CO2 must be increasing regardless of which one of us is right.
“As long as the source rate equals the sink rate, nothing happens with the CO2 concentration in the atmosphere.”
And, the sink rate is influenced by temperature. Not the source rate. The upwelling source was set into motion centuries ago, and is rising back to the surface irrespective of temperatures. And, thus, an imbalance between source and sink is induced by temperature.
Bart,
You are violating the mass balance…
Let’s start with everything in balance:
CO2 rich water is upwelling at the equator and sinking near the poles. There is little exchange with the deep oceans over most of the surface and most of the CO2 content remains in the surface waters or are exchanged with the atmosphere.
The total mass of CO2 (and derivatives: bicarbonates and carbonates) in the ocean surface is ~1000 GtC, not so different from the current atmosphere (~800 GtC).
At steady state, the CO2 influx from warm equatorial waters is ~40 GtC/year and the outflux near the poles is the same 40 GtC/year. That is a continuous flux as long as the water flux, its CO2 concentration and the temperature are constant. Thus equatorial waters get depleted of CO2, while polar waters are enriched with CO2. The latter get into the deep oceans to return some ~1000 years later at the upwelling sites near the equator, enriched in CO2… Overall at steady state there is no change in total CO2 in surface waters or atmosphere, no matter what the real water and CO2 fluxes are at whatever constant temperature at upwelling and sink sites.
If the ocean surface temperature rises everywhere, more CO2 is emitted near the equator and less absorbed near the poles. Thus there is an overall loss of CO2 (+ derivatives = DIC) in the ocean surface, which all is transported into the atmosphere.
There is no piling up of CO2 at the upwelling sites, to the contrary: every parcel of water lost more CO2 to the atmosphere than before, because of the higher seawater temperature. Neither is there an extra increase of ocean CO2 at the sink sites, as the higher temperatures there reduces the uptake. Thus every parcel of water sinking into the deep contains less CO2 than before the warming because of more emission and less uptake.
Any increase in CO2 pressure in the atmosphere, whatever the cause, has the opposite effect on in/out fluxes and remaining CO2 in the ocean surface. If the increase in the atmosphere is caused by warmer ocean surface temperatures, the steady state is reached again at 16 ppmv in the atmosphere/K.
If the pressure in the atmosphere exceeds 16 ppmv/K, then extra CO2 is pushed into the oceans, leading to a reduced pH and increased DIC.
If ocean temperature was the cause of the increase in atmospheric pressure, then more CO2 is pushed out of the oceans, leading to a higher pH and decreased DIC.
All measurements over all ocean surfaces show a decrease in pH and an increase in DIC…
Bart,
Where I said:
At steady state, the CO2 influx from warm equatorial waters is ~40 GtC/year and the outflux near the poles is the same 40 GtC/year.
To avoid any misunderstanding: at steady state, the CO2 influx from the upwelling waters into the atmosphere is ~40 GtC/year and the outflux near the poles from the atmosphere into the sinking waters is the same 40 GtC/year.
How much CO2 is upwelling and sinking in the water phase is not relevant at steady state, in that case the warmed upwelling waters get depleted and the colder sinking waters get enriched in CO2. Net zero effect for the waters (and the atmosphere): the CO2 content that is upwelling near the equator sinks again near the poles.
With a ocean surface temperature increase, there is more outgasssing of the warmer waters and less enriching of the colder waters, thus in general depleting the ocean surface waters.
“How much CO2 is upwelling and sinking in the water phase is not relevant at steady state…”
The oceans are not in steady state, and won’t be entirely so until universal heat death.
“With a ocean surface temperature increase, there is more outgasssing of the warmer waters and less enriching of the colder waters, thus in general depleting the ocean surface waters.”
Outgassing is a second order effect. Just focus on what is happening with the waters. As you say, there is less enriching of the colder waters. That is where the waters sink. The upwelling is effectively an exogenous input over centuries long timelines, i.e., it is not immediately affected by the temperature change.
Only the downwelling is immediately affected. And, due to the reduced enrichment of the colder waters, there is less CO2 transported along with the downwelling flow. The result is necessarily an accumulation of CO2 in the surface oceans, and hence in the atmosphere.
If we genuinely started in steady state, with a given surface temperature and uniform tidal mixing, we would have a steady state distribution of CO2 within the oceans from the depths to the surface. A change in surface temperature would then disturb that distribution, with a new profile from depths to surface established once a new steady state was reached.
But, this redistribution takes a very long time, on the order of the time for THC circulation. Thus, in the near term (order of centuries), you effectively have an integral relationship from temperature to CO2 concentration within the surface system.
Bart:
The oceans are not in steady state, and won’t be entirely so until universal heat death.
That indeed is a matter of millennia, not decennia, which is the current period we are talking about.
Over pre-industrial millennia, the change is not more than 0.02 ppmv/year or 0.00125 ppmv/K/year if we take your formula for a “rapid” glacial-interglacial transition (~5000 years). The current increase is ~2 ppmv/year or ~1.5 ppmv/K/year from your current baseline.
For a small period like 60 years, the long-term disequilibrium with the deep oceans is of no importance.
The upwelling is effectively an exogenous input over centuries long timelines, i.e., it is not immediately affected by the temperature change.
Here you are completely mistaken. While there is no indication that there was a huge change in average water upwelling over the past 60 years, neither of huge changes in average CO2 concentration of the upwelling waters, temperature has an immediate effect on the release of CO2 for every parcel of water which is emerging from the deep oceans. Higher ocean temperatures mean more outgasssing, thus more CO2 influx in the atmosphere and more CO2 depletion of every parcel of water at the upwelling areas.
Because of the small difference in relative quantities of CO2 in the ocean surface (~1000 GtC) and the atmosphere (~800 GtC), any change in influx (~40 GtC/year) from ocean surface into the atmosphere has a substantial effect on the CO2 concentrations in both ocean surface and atmosphere.
The opposite happens at the sink sites.
The exchange of CO2 between surface waters and atmosphere is very fast: a half life time of less than a year, both ways. With a constant supply of CO2 in the upwelling waters, and an increased temperature, that starts with an increased influx of CO2 in the atmosphere. That gives an increased CO2 pressure in the atmosphere. The increased pressure of CO2 in the atmosphere gives a decrease of the CO2 influx at the upwelling areas. The opposite happens at the sink areas. Back to the original in/out fluxes at 16 ppmv/K…
Thus any change in CO2 influx in the atmosphere caused by a constant CO2 influx in the upwelling waters and an increased ocean surface temperature is equalised in a matter of years, not millennia.
“The increased pressure of CO2 in the atmosphere gives a decrease of the CO2 influx at the upwelling areas.”
No, it does not. Those waters are coming up, and their CO2 with them. There is nothing that can stop them in the “short” (centuries) term.
You seem to be getting confused between influx into the atmosphere and influx into the surface oceans. Influx to the atmosphere stops when there is a balance between pCO2 of the atmosphere and of the ocean waters with which it comes into contact. But, the upwelling continues nevertheless, and the surface waters become more enriched, because the same level of CO2 is not downwelling due to the temperature change. And, as the pCO2 of the surface oceans increases, atmospheric content ineluctably follows.
Bart:
No, it does not. Those waters are coming up, and their CO2 with them. There is nothing that can stop them in the “short” (centuries) term.
You seem to be getting confused between influx into the atmosphere and influx into the surface oceans. Influx to the atmosphere stops when there is a balance between pCO2 of the atmosphere and of the ocean waters with which it comes into contact.
I don’t think I am confused, you don’t take into account the increase in CO2 release of the upwelling waters at higher temperatures:
Indeed there is nothing that stops the inflowing waters with their CO2 content, but there is also nothing that stops the release of CO2 from these upwelling waters into the atmosphere, as long as the pCO2 of these waters is higher than of the atmosphere. Which was the case at steady state: ~40 GtC/year influx into the atmosphere at the upwelling areas with ~750 μatm oceanic pCO2 and 400 μatm [*] in the atmosphere, ~40 GtC/year outflux at the sinks with ~250 μatm oceanic pCO2 and 400 μatm in the atmosphere.
As a higher temperature increases the pCO2 of the upwelling (and sinking) waters, the release of CO2 from the upwelling waters increases to ~41.8 GtC/year (at ~766 μatm, still 400 μatm in the atmosphere), depleting the upwelling waters even more. The opposite happens at the sink side: ~36.1 GtC/year (at ~266 μatm) is absorbed. The difference is a depletion of the surface waters (and of the net sink in the deep oceans) with initially 5.7 GtC/year that all accumulates in the atmosphere.
For a constant influx of upwelling waters with a constant CO2 concentration, any increase in ocean surface temperature will deplete the CO2 content of the ocean surface and the CO2 accumulation is entirely in the atmosphere.
The accumulation in the atmosphere pushes more CO2 back into the ocean surface and at 16 ppmv/K the original in/out fluxes are restored.
[*] The real steady state in the past was at 290 μatm in the atmosphere for the current area weighted ocean surface temperature. The current extra pressure at 400 μatm pushes ~3 GtC/year more CO2 into the deep ocean sinks than released from the deep ocean sources.
“The current extra pressure at 400 μatm pushes ~3 GtC/year more CO2 into the deep ocean sinks than released from the deep ocean sources.”
You have the cart pulling the horse. The atmosphere is a release valve. It removes part of the concentration of the upwelling waters so that less CO2 flows to the downwelling areas. It cannot simultaneously force more CO2 down. It is a passive player. You can disregard it entirely as far as the net impact on oceanic CO2 flow is concerned.
What you are suggesting would result in temperature having no net effect on CO2 distribution in the oceans. It absolutely, positively does have an impact on CO2 distribution.
Bart:
It removes part of the concentration of the upwelling waters so that less CO2 flows to the downwelling areas. It cannot simultaneously force more CO2 down. It is a passive player. You can disregard it entirely as far as the net impact on oceanic CO2 flow is concerned.
Bart, this is very elementary: the only CO2 exchange between oceans and atmosphere is when there is a (partial) pressure difference between them, no matter what caused that difference. It may be temperature changes of the waters or changes in CO2 pressure in the atmosphere caused by volcanoes or humans.
At the upwelling sites ocean temperature and thus pCO2 is high and CO2 enters the atmosphere. At the downwelling sites ocean temperature and thus pCO2 is low and CO2 is pushed into the ocean waters. Thus there is always a simultaneous influx and outflux of CO2 from oceans to atmosphere and back.
At steady state at ~290 ppmv in the atmoosphere, some 40 GtC goes in and out the atmosphere. That is substantial, as the total C content of the ocean surface is ~1000 GtC and the THC may be maximum 10% of the total surface, thus containing ~100 GtC of which some 40% is released and some 40% is absorbed during its trip from upwelling to downwelling…
The atmosphere has to reach 750 ppmv, before the CO2 influx at the upwelling stops. At 400 ppmv there still is a huge influx of ~38.5 GtC and at the same time a ~41.5 GtC outflux into the colder ocean waters. 3 GtC more outflux than influx.
That is a direct reaction of any chemical or physical process in steady state to a disturbance.
What you are suggesting would result in temperature having no net effect on CO2 distribution in the oceans. It absolutely, positively does have an impact on CO2 distribution.
Temperature is a minor player: at every place of the oceans where the temperature increases, the result is an increase of 16 μatm/K in ocean pCO2. Depending of the atmospheric pressure, that results in more release, no release/uptake or less uptake. Thus the point where the ocean flow turns from a net emitter into a net absorber will shift poleward and the net result is a small increase of CO2 in the atmosphere, if we started from steady state. That ends when the pCO2 increased with 16 ppmv/K.
That is completely dwarfed by the 110 ppmv (~μatm) level of the atmospheric pCO2 above steady state. The temperature increase only will -temporarely- decrease the net sink rate in the oceans as the atmospheric increase is over 2 ppmv/year…
I really do not know how to get through your mental block. Temperature is the major player here. That is why they call it the Thermohaline circulation.
You keep appealing to atmospheric pressure, but the atmosphere is only a passive player. You can fundamentally disregard it as far as the THC dynamics are concerned, because it only represents a splitting of the flow – that which is carried to the poles by the atmosphere is equal and opposite to that which is not carried by the ocean currents themselves.
A change in temperature changes the characteristics of the thermohaline circulation. Fundamentally, and unequivocally. You are just refusing to see.
Bart:
I really do not know how to get through your mental block. Temperature is the major player here. That is why they call it the Thermohaline circulation.
Bart, that only shows that you don’t understand simple physical processes, maybe too simple for your knowledge…
The “Thermo” in the THC is about the ocean water temperature and mainly at the sink places, where the cooler waters and the ice formation increase the remaining waters in salt (Haline) content and density. That let the heavier waters sink into the deep oceans and gives part of the circulation. At the upwelling sites and underway (Gulf Stream) wind patterns are the main driver.
Temperature has a huge influence on the CO2 circulation between ocean surface and atmosphere: at steady state, 40 GtC is released into the atmosphere near the upwelling, 40 GtC is absorbed from the atmosphere near the sink places.
You keep appealing to atmospheric pressure, but the atmosphere is only a passive player.
The atmosphere is a passive player but the reaction to a pressure change in the atmosphere is not passive: any change in atmospheric pCO2 has an immediate influence on CO2 exchanges with the oceans as the in/out fluxes are directly proportional to the pCO2 difference between both.
You can fundamentally disregard it as far as the THC dynamics are concerned, because it only represents a splitting of the flow – that which is carried to the poles by the atmosphere is equal and opposite to that which is not carried by the ocean currents themselves.
Here you are fundamently wrong: any change in temperature of the ocean surface or any change in atmospheric pressure not only influences the in/out fluxes on their own but also the balance between influx and outflux:
– higher temperatures: more influx, less outflux, increase in the atmosphere, decrease in the ocean surface.
– higher atmospheric pressure: less influx, more outflux, decrease in the atmosphere, increase in the ocean surface.
A change in temperature changes the characteristics of the thermohaline circulation. Fundamentally, and unequivocally. You are just refusing to see.
It definitely does change the CO2 release / absorption characteristics of the THC as it starts with more net CO2 release into the atmosphere for higher temperatures. It definitely is influenced by an increased CO2 pressure in the atmosphere in the opposite direction, something you refuse to see…
“That let the heavier waters sink into the deep oceans and gives part of the circulation.”
Exactly, Ferdinand. And, with warmer waters, the downwelling portion has less CO2 in it.
“…any change in atmospheric pCO2 has an immediate influence on CO2 exchanges with the oceans as the in/out fluxes are directly proportional to the pCO2 difference between both.”
You are missing, as Dirk Gently would say, the fundamental interconnectedness of all things. CO2 in the atmosphere is merely a splitting of the flow. It does not change the net result, that being the buildup of CO2 in the surface system.
“– higher temperatures: more influx, less outflux, increase in the atmosphere, decrease in the ocean surface.”
Quite impossible. If one is rising, they are both rising.
You always want to pack everything into a static framework. But, every microsecond, more CO2 laden waters are upwelling. So, it is not a zero sum game, not a case of one increasing while the other decreases. They both increase at the same time.
This is getting tedious. We are only repeating ourselves.
Bart:
Exactly, Ferdinand. And, with warmer waters, the downwelling portion has less CO2 in it.
Exactly, because the water phase contains less CO2, and that CO2 remains in the atmosphere.
You are missing, as Dirk Gently would say, the fundamental interconnectedness of all things. CO2 in the atmosphere is merely a splitting of the flow. It does not change the net result, that being the buildup of CO2 in the surface system.
Please Bart, if the temperature rises everywhere, the pCO2 of the oceans increases everywhere, which means that at every point of the ocean surface either more CO2 is released or less CO2 is absorbed for the same atmospheric pressure. That results in less CO2 remaining at every point of the ocean surface. The ocean surface contains less CO2 everywhere after a temperature increase.
What is less contained (and sinking) as CO2 in the ocean surface is fully accumulating in the atmosphere, not fifity-fifty in atmosphere and ocean surface, as warming oceans don’t accumulate more CO2 at a constant supply, it is exactly the opposite.
“– higher temperatures: more influx, less outflux, increase in the atmosphere, decrease in the ocean surface.”
Quite impossible. If one is rising, they are both rising.
Only possible with human (and volcanic) emissions in the atmosphere. If the oceans are warming, they get CO2 depleted.
You always want to pack everything into a static framework. But, every microsecond, more CO2 laden waters are upwelling. So, it is not a zero sum game, not a case of one increasing while the other decreases. They both increase at the same time.
I wonder what you really know about slow dynamic processes:
The “static” exchanges (per Henry’s law) between ocean surface and atmosphere applies for every point of the surface at any moment. Every microsecond new CO2-rich water is upwelling. Every microsecond, that water is releasing CO2 into the atmosphere, as long as its pCO2 is higher than in the atmosphere or reverse after cooling down during its trip towards the poles.
The integral of all these microexchanges is zero at steady state, but a loss of CO2 out of the oceans with increasing temperatures and enriching the CO2 content of the atmosphere. There is no way the ocean surface can increase its CO2 content from higher ocean temperatures and a constant supply of CO2 by upwelling waters (and no increase of atmospheric CO2 pressure by humans or volcanoes)…
“There is no way the ocean surface can increase its CO2 content from higher ocean temperatures and a constant supply of CO2 by upwelling waters (and no increase of atmospheric CO2 pressure by humans or volcanoes)…”
Yes, it can. You are neglecting the flow. You are treating the oceans as a shallow, static pool of water which equilibrates with a temperature change in fairly short order. That is not a valid model.
The oceans are vast. They take centuries to equilibrate from top to bottom. On a short timescale relative to that, CO2 evolves at a rate proportional to the temperature change. That is what we expect to see, and that is what the data show.
Bart,
Yes, it can. You are neglecting the flow. You are treating the oceans as a shallow, static pool of water which equilibrates with a temperature change in fairly short order. That is not a valid model.
The oceans react exactly the same on temperature for a static as for a continuous exchange.
Static:
Heat water in a water kettle and CO2 and O2/N2 get released from the moment that their solubility is exceeded (pCO2(aq) > pCO2(atm)) once over 65°C CO2 release is more than needed to maintain Ca in solution as bicarbonate and that settles down as carbonate scale. Later at ~80°C O2/N2 are released from the water phase in larger bubbles. In all cases, from the moment you start to increase the water temperature over their solubility, the water gets depleted of CO2 and O2/N2.
Let it cool down and the opposite happens.
Warming the waters somewhat higher will release more CO2 and let it cool less, then less CO2 is reabsorbed. Overall less CO2 remains in the water after a full cycle with increased temperatures.
Dynamic:
Heat water in a “tankless” flow water heater. Besides the higher continuous pressure of the water, CO2 and O2/N2 get released from the moment that their solubility is exceeded (pCO2(aq) > pCO2(atm)) once over X°C CO2 release is more than needed to maintain Ca in solution as bicarbonate and that settles down as carbonate scale. Later at Y°C O2/N2 are released from the water phase in larger bubbles. In all cases, from the moment you start to increase the water temperature over their solubility, the water gets depleted of CO2 and O2/N2.
Let it cool down and the opposite happens.
Warming the waters somewhat higher in the heater will release more CO2 and let it cool less, then less CO2 is reabsorbed. Overall less CO2 remains in the water after an average increase in temperature.
At atmospheric pressure, there is zero difference between a static or dynamic exchange of CO2 between the ocean surface and the atmosphere. In both cases the water get depleted and the atmosphere enriched in CO2 for higher ocean temperatures.
Increasing the CO2 pressure in the atmosphere has the opposite effect: the high pressure in the flow water heater prevents the release of CO2 and O2/N2 until higher temperatures are reached as the same higher pressure is in any gas bubble, while the pCO2 of the water phase only changes with temperature.
The same happens in the atmosphere: the cuurent higher pressure of CO2 in the atmosphere opposes the release by upwelling waters and increases the uptake of sinking waters far beyond the pressure increase caused by an increased temperature.
On a short timescale relative to that, CO2 evolves at a rate proportional to the temperature change. That is what we expect to see, and that is what the data show.
You are treating the ocean as not responding to any pressure increase in the atmosphere: an increase of CO2 in the atmosphere reduces the influx from the upwelling sites and increases the outflux at the sink sites. The net sink rate is proportional to the change in average pCO2 difference between atmosphere and ocean surface. That has currently far more effect than the ocean temperature and is responsible for the net imbalance of ~3 GtC/year more sink than source in the oceans. The oceans sink more CO2 than they release…
hi Ferdinand
I don’t think you can use the depletion of oxygen as a factor in your deliberations as it is involved in a number of reactions TOA, protecting us from the sun’s most harmful rays, which is now more prevalent [during a period of lower solar activity].
If you did not know this: there never was an ozone hole. {I think} Above the oceans peroxides are formed more preferentially to ozone, doing exactly the same thing: protecting [human] life. Look at the absorption spectra of both components.
As the lower activity of the sun continues, it spews more of the most energetic particles [because of the lower polar magnetic fields] and therefore ozone, peroxides and nitrogenous oxides will continue to increase [to protect us]. I can prove this {e.g. that ozone is increasing}. That process [of protecting us] is taking away more oxygen from the atmosphere. Unfortunately it also reduces the amount of UV coming through, reducing big T on earth, as can be seen from Tmin and Tmax if anyone would care to look at it.
Anyway, at least we do agree on your final sentence:The oceans sink more CO2 than they release…
that means it is getting cooler.
that process will continue.
winter is coming.
count back exactly 86.5 years, and know where we are, when looking at the sun: 1930.
Go south, young man. Go south.
Ferdinand Engelbeen @ November 23, 2016 at 1:48 am
You are just not getting it.
The oceans are immense, and they take centuries to millennia to come to equilibrium with a shift in boundary conditions such as surface temperature.
“You are treating the ocean as not responding to any pressure increase in the atmosphere…”
That’s just idiotic. It’s just a splitting of the flow.
Pardon the last bit, but I have lost patience. A holiday is coming up here in the US, and I do not have any more time to engage in this endless cycle of explanation and obstinate denial.
Henry’s law is a relaxation phenomenon, with characteristic time constants that increase with the volume of the system. The ocean volume is immense, hence the time constants exceedingly long, as they depend upon long period ocean circulation and long tail diffusion.
So, you do not, cannot get, a 16 ppmv/K relationship over anything like the short term. In the (relatively) short term (centuries), you get an integral relationship, and a sensitivity in ppmv/K/unit-of-time.
There is no doubt about it. It is what one expects, and it is what one gets. It really couldn’t be any more obvious or clear, and your obstinance is just an instance of plugging your ears and refusing to evaluate the evidence, and employ basic physics.
Thumbs up! (aaaaaaaaay…)
Bart:
The oceans are immense, and they take centuries to millennia to come to equilibrium with a shift in boundary conditions such as surface temperature.
Sorry Bart, I thought that we agreed on the point that the ocean surface is largely isolated from the deep oceans and that most of the fast responses to temperature and pressure are for the ocean surface only and that we might assume that on years to decades the influx of CO2 with the upwelling waters is fairly constant.
That’s just idiotic. It’s just a splitting of the flow.
Not only splitting the flow, also changing the balance of influx and outflux between atmosphere and oceans…
There is an immediate response of the fluxes to any change in CO2 pressure in the atmosphere: less influx, more outflux for an increase of CO2 in the atmosphere.
Pardon the last bit, but I have lost patience. A holiday is coming up here in the US, and I do not have any more time to engage in this endless cycle of explanation and obstinate denial.
Have a nice holiday, see you next time…
Henry’s law is a relaxation phenomenon, with characteristic time constants that increase with the volume of the system. The ocean volume is immense, hence the time constants exceedingly long, as they depend upon long period ocean circulation and long tail diffusion.
This is your problem: the ocean surface (the “mixed layer”) contains ~1000 GtC, the atmosphere ~800 GtC and the time constant for any CO2 exchange between these two is less than a year. That is what we were discussing, not the exchanges with the rest of the oceans.
The time constant for CO2 exchanges between atmosphere and deep oceans (~38,000 GtC) is ~51 years. Seems quite right to me for the differences in carbon content.
So, you do not, cannot get, a 16 ppmv/K relationship over anything like the short term. In the (relatively) short term (centuries), you get an integral relationship, and a sensitivity in ppmv/K/unit-of-time.
As I said before: the transient response of CO2 in the atmosphere to temperature changes is 4 to 16 ppmv/K from seasonal to multi-millennia. The latter involves the deep oceans. There is only a fixed response for a fixed temperature change with response times depending of what process is involved: ocean surface or deep oceans or vegetation (tropical or extra-tropical).
There is no doubt about it. It is what one expects, and it is what one gets. It really couldn’t be any more obvious or clear, and your obstinance is just an instance of plugging your ears and refusing to evaluate the evidence, and employ basic physics.
Bart, I have not the slightest problem to admit that I am wrong if you have solid proof. I would even be very happy that you can prove that humans are not the cause of the increase in the atmosphere, as that would destroy the whole CAGW meme. But until now you have not delivered one good argument, except that you can fit two slopes + variability, which I can do too with human emissions as cause of the slope and temperature as cause of the variability…
You refuse to accept any explanation and every observation that opposes your impossible theory that a small temperature step can give a continuous increase of CO2 into the atmosphere until eternity, without any immediate influence of the increased CO2 pressure in the atmosphere on ocean-atmosphere fluxes.
Your theory is only based on a nice match of two slopes + variability, plus a lot of fantasy of how the real world exchange of CO2 between oceans and atmosphere in your opinion works, without any observation that confirms your opinion…
“Sorry Bart, I thought that we agreed on the point that the ocean surface is largely isolated from the deep oceans and that most of the fast responses to temperature and pressure are for the ocean surface only and that we might assume that on years to decades the influx of CO2 with the upwelling waters is fairly constant.”
Yes, for many years, centuries even, the influx is fairly constant. The outflux, however, is not. It is very temperature dependent. After a very long time interval, that outflux will begin to influence the influx, as the entire ocean moves towards equilibrium. But, in the intervening years, it produces what is effectively an integral response of CO2 in the surface waters to temperature anomaly.
What you have not appreciated, though I have described it to you many times, is that there are two responses to temperature change. There is a fast and a slow dynamic at work. The fast dynamic is equilibration between the atmosphere and the surface oceans. That equilibration is temperature dependent, and results in a small and finite shift in atmospheric CO2 given the temperature change. This is the dynamic that you have focused on. But, you have ignored the other one.
The slow dynamic is the equilibration of the entire ocean, and that is very long term, and is what begets what is effectively an integral relationship between temperature and atmospheric CO2 over fairly long time periods.
And, with those parting words, I am outta here. Until we meet again…
“So, you do not, cannot get, a 16 ppmv/K relationship over anything like the short term. In the (relatively) short term (centuries), you get an integral relationship, and a sensitivity in ppmv/K/unit-of-time.”
This needs clarification. When I said short term above, I meant relative to the time for THC overturning and full oceanic equilibration. In the very short term, you do get a finite shift in atmospheric CO2 due to a temperature change. But, it does not end there, because it is going to take a very long time for full oceanic equilibration.
Bart:
That equilibration is temperature dependent, and results in a small and finite shift in atmospheric CO2 given the temperature change. This is the dynamic that you have focused on. But, you have ignored the other one.
Well, at last we agree on the first part: the finite shift of CO2 for a short-term change in temperature is in the orders of 4-5 ppmv/K.
We still disagree on the second part: according ot ice cores (and proxies and Henry’s law) there is a finite shift of CO2 for very long term temperature changes too: about 16 ppmv/K.
Even if the current CO2 influx from the upwelling waters is part of the long term equilibrium process between atmosphere and deep oceans, it can’t give you more than 16 ppmv for a total increase of 1 K in ocean temperature.
Moreover, we are at the tail of a 10,000 years long Holocene, which has its temperature peak some 7,000 years ago and since then in average is cooling. The MWP may have been slightly warmer than today, but that was good for only ~6 ppmv above the LIA…
What you still ignore is the immediate influence of pressure changes in the atmosphere on the balance of the CO2 in/out fluxes between the atmosphere and the ocean surface, including upwelling and sink areas. That is what gives a fast response to ocean surface and deep ocean temperature changes alike, but a slower response for equilibration of CO2 levels (pressure) between atmosphere and deep ocean changes than for the ocean surface…
Bartemis,
Here is a paper that might be of some interest:
http://www.biogeosciences.net/1/101/2004/bg-1-101-2004.pdf
I mentioned it on another thread where this issue (content of upwelling ocean waters) was raised, but the thread was pretty well dead by then so you may not have seen it.
Thanks, Jim. It is suggestive. There has been such a rush to judgment, with little actual data to back it up.
Jim,
That story is far from complete… The data for pCO2 show a huge increase with cooler temperatures. That is because of the cooler temperatures are caused by more upwelling of CO2-rich deep ocean waters. Thus most of the release then is outside the upwelling zones over warmed waters, where not was measured… Give little idea about the real fluxes: only modelled fluxes…
I still think this is playing darts with a blindfold. I have still not seen a convincing detailed account of the Carbon cycle. Can anyone tell me now, whether the oceans are net absorber or emitter of CO2?
Planetary modelling just isn’t detailed enough.
Robert,
Besides the biosphere (sinks ~1 GtC/year, absed on the oxygen balance) and the ocean surface (sinks ~0.5 GtC/year, measured as DIC), the rest of the difference between emissions and increase in the atmosphere sinks in the deep oceans. That is partly measured via tracers (14C, CFC’s,…) and changes in 13C/12C ratio.
The total sink rate is in direct ratio with the extra CO2 presure in the atmosphere above dynamic equilibrium per Henry’s law, currently 2.15 ppmv/110 ppmv or a half life time of ~35 years.
You don’t need any detail of all the natural fluxes, a simple calculation is sufficient: human emissions are known with reasonable accuracy, based on fossil fuel sales (taxes!) and CO2 levels in the atmosphere are accurately known to +/- 0.2 ppmv. The difference in increase rate is what the natural fluxes have absorbed or added. In the past 57 years, nature was more sink than source, wherever that was and whatever the natural fluxes changed over the years…
Thus humans are the main cause of the increase of CO2 in the atmosphere.
Of course, Bart has a theoretical escape route, where temperature is the main cause of the increase, but that violates every single observation…
“Thus humans are the main cause of the increase of CO2 in the atmosphere.”
WOW.. that is amazingly GOOD NEWS .
That means by increasing world-wide CO2 release, we can continue to support the world’s growing population
COAL FIRED POWER PLANTS ARE AN ABSOLUTE NECESSITY ..
…for the survival of the human species, and all other life on Earth.
WELL DONE , Ferd ! 🙂
This seems like a nightmare scenario for liberals and Democrats that CO2 is going down. If temperatures aren’t affected by CO2… and CO2 is going down, what will they complain about next? I’m sure they’ll find something, but no one is gonna let them forget this fiasco.
MrX, the atmospheric concentration of CO2 is NOT going down.
Human emissions seem to be. Others seem to be indicating that the rate of increase is decreasing.
MrX,
The rate of increase is relative flat (be it highly variable), but still above zero, thus CO2 still is increasing at a slower speed than in earlier decades where CO2 increased slightly quadratic…
Article in Nature says it is do to the increased carbon uptake not less emissions. In particular the increased greening and the lower rate of warming. So at least here it has little to do with cutting emissions and more to do with the earth reacting and rebalancing. http://www.nature.com/articles/ncomms13428
Dear Willard,
In the title of this article you post: “CO2 emissions are declining on their own”
..
In case you don’t comprehend English, “did not grow in 2015” does not mean “decline”
..
Additionally, “The projected rise of only 0.2% for 2016” also does not mean “decline”
..
Lastly, ” 0.7 per cent growth seen in 2014.” doesn’t mean there is a “decline”
..
Could you please provide us with what your definition of the word “decline” means in your vocabulary?
HENRYSatSHAMROCK@aol.com That article may not have used the word decline but the article in Nature sure did http://www.nature.com/articles/ncomms13428
” we report a recent pause in the growth rate of atmospheric CO2, and a decline in the fraction of anthropogenic emissions that remain in the atmosphere, despite increasing anthropogenic emissions. We attribute the observed decline to increases in the terrestrial sink during the past decade, associated with the effects of rising atmospheric CO2 on vegetation and the slowdown in the rate of warming on global respiration.”
CMS, a pause in the RATE of growth is not the same thing as a DECLINE in the emissions. Emissions can continue to GROW even if the rate of growth is zero. (1st year calculus remember?)
‘declining rate’ is a perfectly legitimate concept and there is not even a valid quibble
it means ‘slowing down’
simpler than thou.
gnomish…..here’s a concrete example of a “declining rate of growth” where emissions constantly rise.
…
year 1: CO2 increased 5 ppm/yr.
year 2: CO2 increases 4.5 ppm/yr.
year 3: CO2 increases 4.0 ppm/yr.
year 5: CO2 increased 3.5 ppm/yr.
year 6: CO2 increases 3.2 ppm/yr.
year 7: CO2 increased 3.0 ppm/yr.
…
Declining RATE is not the same as declining EMISSIONS
GET IT?
Ah HSS you might try reading the rest of the quote for example ” We attribute the observed decline to increases in the terrestrial sink during the past decade” or “a decline in the fraction of anthropogenic emissions that remain in the atmosphere”. But instead of reading the first sentence or two to find something that you can jump on. Instead read the article, it is an important article in a top journal, Then your criticism might have something to add to the conversation.
When UEA say good morning – I check my watch. Possibly in a decade or so of actual science following the sacking of all of the charlatans and lying mountebanks it may even be possible to believe a single word emanating from that blighted establishment.
Tbh though – taking off and nuking it from space is the far safer option – only way to be sure.
Isn’t it interesting how man can cut its emissions and it has nothing to do with the Atmospheric CO2? We are spending dollars on absolutely no impact on CO2 at all.
That’s the amount of CO2, right? And what’s been slowing down is the acceleration of CO2 emissions (CO2/yr/yr). So CO2/yr is still rising slightly, and may plateau in the next couple years (i.e., the post’s plot).
Does that make sense, why you would still expect increasing CO2 if CO2/yr is still positive, and CO2/yr/yr is also positive? This is so much easier if you’ve seen derivatives before 😉
It’s like the difference between debt and budge deficit – the “CO2 budget deficit” is still growing, but by a smaller amount, and may stop growing in the near future. “CO2 debt” will still accumulate though.
“afonzarelli November 16, 2016 at 6:09 pm HenryS, is there another option besides those three? ”
There is a 4th option : this is just coincidence, a random event, like so many spurious coincidence.
A coincidence that has been happening steadfastly now for well over half a century? (at what point shall we deem it NOT to be coincidence?)
Fonzie,
You can fit every period by changing the baseline and the factor. But if you use a fixed baseline and factor which fits the 1959-current slope, the deviation in the period 1900-1959 is already 20 ppmv, worse before 1900, as the baseline is higher than during the whole LIA…
Changing baseline and factor for every period is just curve fitting, while the deviation from a simple linear relationship between CO2 and T doesn’t deviate more than 10 ppmv over the past pre-industrial 800,000 years…
co2islife,
If you plot both total emissions and total CO2 in the atmosphere, the cause and effect is quite visible. Added the highly variable temperature trend and compare that to the CO2 increase:
http://www.ferdinand-engelbeen.be/klimaat/klim_img/temp_emiss_increase.jpg
Ferdinand, there are infinite number of things on earth that show the same curve than CO2 increase, none of which being cause nor effect of temperature. Your plot only show how poorly temperature correlate with CO2 at this scale of time.
Besides, remember that CO2 is suppose to act by delaying radiative energy loss, which occurs in tiny fractions of second. Using a decade filter to show the supposed effect of a fraction of second process is really bad methodology, no wonder it simply doesn’t work.
Temperatures correlate very, very, very well with CO2. See above.
paqyfelyc,
I meant to show that it is human emissions which are the cause of the CO2 increase in the atmosphere. As temperature goes up, slightly down, up and flat, the correlation with CO2 is far worse than for the emissions.
The averaging was used by prof. Essenhigh (if I remember well) who used the 21-year moving average to show that temperature is the driving force for the CO2 increase, but he showed only the period after 1980…
Bartemis, your assumption is based on trunkated data. It doesn’t work before 1960, doesn’t work on shorter scale of time (<1 year, <1month, <1 day,….) nor on longer (century, eons). It is simply false. cherry -picked coincidence, funny spurious coincidence. Even-though temperature DO drives CO2 (as far as biosphere is involved, this way, not reverse way), correlation is very bad. "correlation is not causation" works both way : sometime (because of reverse causes), things that do have effect on each other don't correlate at all (predator-prey population for instance).
Ferdinand, this is not convincing. Nature process don't know nothing about CumEmiss, it simply make no sense to put them on this plot. Some of these process eat more CO2 when there is more in the atmosphere, but the kinetics are important, depending on whether they can keep up with the pace of emission or not. Strangely enough you plot hint at their being unable to do that before 1940, then being fully able 1940-1960, then somehow tuned to 1/2 emissions since 1960. correlation 0 then 1 then 1/2 in decades ? why ?
Makes no sense to me. Does it to you ?
paqyfelyc –
We don’t really know atmospheric CO2 to any degree of accuracy prior to 1958. If we did, there would have been no reason to set up the MLO site in the first place. Ice core proxies have no independent means of verification.
It is not necessary to worry about it. Since at least 1958, the rate of change of atmospheric CO2 is proportional to appropriately baselined temperature anomaly. As that is the era over which most of the observed rise has occurred, we can say with confidence that the temperature relationship dominates atmospheric CO2 dynamics.
Any denial of the incredibly good correlation between temperature and the rate of change of atmospheric CO2 is akin to denial of elliptical orbits, and appeals to exotic processes to maintain that it is a spurious correlation akin to drawing epicycles.
Bartemis, your correlation is commendable. However, as you are well aware, correlation does not prove causation in either direction.
HenryS – It is a fact that the rate of change of atmospheric CO2 is proportional to appropriately baselined temperature. So, the options are:
1) temperature drives the rate of change of CO2
2) the rate of change of CO2 drives temperature
3) a common impetus drives both
The first option is likely, given that a change of temperature at the surface would necessarily result in a redistribution of CO2 in the oceans all the way down, requiring a time period of centuries to millennia to reach a new steady state.
The second option is absurd – it would suggest that CO2 could rise to any level at all, but once it stopped rising, temperatures would revert to their original level.
The third option is speculative at best.
Bartemis, all three of your options are possible. However the correlation you have provided does not provide evidence for any one of them. You need better evidence than a correlation between two variables.
As I stated, the other options are either absurd, or highly speculative. The remaining one is eminently plausible.
Bartemis, your three statements are nothing more than opinion, and not fact based.
HenryS, is there another option besides those three? There is a school of thought out there that says yes, temperature is driving the carbon growth rate, BUT the rise is still anthropogenic. Higher temps cause an inefficiency in the sinks thus anthro co2 builds up in the atmosphere faster. It’s o.k. to quibble as to why temps drive the growth rate without disagreeing that temps do drive the growth rate…
paqyfelyc,
I need to adjust the curves, as neither the increase in the atmosphere, nor the total human emissions start at zero in 1900…
A better, more detailed plot for the period 1900-1960 is here:
http://www.ferdinand-engelbeen.be/klimaat/klim_img/acc_co2_1900_1959.jpg
The CO2 levels are based on ice core measurements which have a repeatability of samples at the same depth of ~1.2 ppmv (1 sigma) and a resolution of less than 10 years. Before 1910 there was a strong cooling period, which may have inluenced the lack of increase.
As the year by year variability in rate of change is +/- 1.5 ppmv (in current times, but I don’t see a reason why that would have been different in previous periods). The human “signal” in the ice cores is emerging only after a decade or so above the “noise”. That humans are the cause is proven by the opposite change in 13C/12C ratio in the same ice cores and independently in coralline sponges, which grow in the mixed ocean surface layer, which exchanges a lot of CO2 with the atmosphere each year:
http://www.ferdinand-engelbeen.be/klimaat/klim_img/sponges.jpg
While there may have been periods where sink rate was higher than emissions before 1960, the resolution is not enough to give an answer to that question. Anyway, all what the graph shows is that the total of human emissions is larger than the increase in the atmosphere, thus that the sink rate can’t remove all of total human emissions and certainly not even for yearly human emissions since 1960. The sink speed is too slow to remove all human emissions in the same year, despite the increasing CO2 pressure in the atmosphere…
Bart,
You forgot the fourth option:
4. temperature variability drives the variability in CO2 rate of change and a small part of the increase, human emissions drives most of the increase.
Which is perfectly possible and fits all observations:
http://www.ferdinand-engelbeen.be/klimaat/klim_img/had_co2_emiss_nat_deriv.jpg
That is for the HadCRU3 data. Still the full correlation of the variability and a small increase due to warming oceans, the rest of the increase by human emissions minus the sink rate due to the increased CO2 pressure in the atmospher above steady state for the ocean surface per Henry’s law…
Ferdinand,
Can you point me to an explanation (with numbers) of the observation that the d13C content of the incremental atmospheric CO2 since 1750 has been constant (at circa 13 per mil), once you get beyond the timescale of the ENSO fluctuations?
That should, of course, be -13 per mil.
“afonzarelli November 16, 2016 at 6:09 pm HenryS, is there another option besides those three? ”
There is a 4th option : this is just coincidence, a random event, like so many spurious coincidence.
@ Ferdinand Engelbeen November 17, 2016 at 3:52 am
Now, THAT is pretty much more convincing (your second graph, not the first). Not sure it is enough, but much better.
Jim Ross:
Can you point me to an explanation (with numbers) of the observation that the d13C content of the incremental atmospheric CO2 since 1750 has been constant (at circa -13 per mil), once you get beyond the timescale of the ENSO fluctuations?
From 1750 onward would be difficult, as the human use of fossil fuels was too small to have much influence within the natural noise of +/- 0.1 per mil δ13C. What happened is that from ~1850 onward the δ13C drop emerged out of the natural noise and is in a quite constant ratio with the (estimated) use of fossil fuels.
Natural δ13C changes were very small over the past 800 millennia: a change of ~0.3 per mil between a glacial and interglacial period, that is all. That points to the oceans as main CO2 source of the increase. During the whole Holocene, the changes were an increase of 0.3 per mil from 11 to 8 kyr BP, and a decrease of 0.2 per mil over the following 7 kyr. The drop in δ13C since ~1850 is now over 1.6 per mil in comparison…
For the past 1.5 century, I have calculated the drop in δ13C if all human fossil CO2 (at average -24 per mil) would have all remained in the atmosphere. The real drop is much smaller, as the deep oceans dilute the fossil fuel fingerprint and vegetation probably was a small source of low -13C too before 1990. Since 1990 we have better estimates of the latter contribution, based on oxygen measurements. At least since then, the biosphere as a whole is a small, but growing sink for CO2, thus -relative- increasing the δ13C level. See:
http://www.ferdinand-engelbeen.be/klimaat/klim_img/deep_ocean_air_zero.jpg
With a yearly circulation of ~40 GtC from and to the deep oceans, and a rather constant fuel mix and a small increase in uptake by vegetation, it looks like that most of the change in δ13C is explained. Of course, if the fuel mix changed (from coal towards gas/oil), that brings other explanations in sight…
The ~40 GtC/year deep ocean circulation is independently confirmed by the fast decay rate of the 14C increase after the open air nuclear bomb tests before the 1960’s…
Ferdinand Engelbeen @ November 17, 2016 at 4:06 am
“4. temperature variability drives the variability in CO2 rate of change and a small part of the increase, human emissions drives most of the increase.”
Not viable. If temperature related emissions are rapidly removed, so must human input be. You can’t just apply arbitrary dynamics to shape the outcome to your liking. It is drawing epicycles.
paqyfelyc @November 17, 2016 at 9:36 am
“There is a 4th option : this is just coincidence, a random event, like so many spurious coincidence.”
That would be one hell of a coincidink, to match in the long term trend as well as every short term nook and cranny. The odds of it happening by chance are infinitesimal.
Ferdinand,
Thank you for your response. I think you may missed my point. If you look at your plot showing the decline in d13C values of sponge records, the scale on the left for atmospheric d13C is linear. The scale on the right is for atmospheric CO2: it is linear in the reciprocal of CO2. I am sure that you are familiar with the Keeling equation, which tells us that such a relationship reflects a common d13C source (or average value of multiple sources). The relationship between these two scales, adjusted to get the match by the author of the plot, corresponds to a constant d13C of -12.8 per mil.
Next, your plot of “ocean thinning” shows a reasonable match to the actual d13C values, but you will get a much better match if you simply take the atmospheric CO2 values, together with a starting value of d13C of -6.5 per mil, and calculate the d13C profile assuming a constant d13C for the incremental CO2. I got a very good fit using -12.7 per mil. I need to work out how to demonstrate this with a graphical overlay (or perhaps you could advise precisely which source you used for the CO2 and d13C ice core values and I can generate such a plot).
Finally, the actual measurements from Mauna Loa and other stations (including South Pole) show that the d13C content is variable (esp with ENSO) but over the longer term reflect a constant source or average value of multiple sources (just plot the d13C measurements against the reciprocal of CO2 and read off the intercept – best to use the seasonally adjusted data to avoid the annual fluctuations, but not essential as you get essentially the same answer but with an increased R squared). For SPO, I get a value of -13.0 per mil with R squared of 0.98. I need to work out how to post plots, but have not got time right now, I’m afraid. Will try to do so tomorrow.
So, my question is: is this an acknowledged fact that has been published, or I am making a silly mistake somewhere (quite possible), or is this a rather important finding that is being overlooked (intentionally or otherwise)?
OK, let’s try this quickly:
[IMG]http://i66.tinypic.com/160ajgk.jpg[/IMG]
OOPs, try again:
http://i66.tinypic.com/160ajgk.jpg
Bart:
Not viable. If temperature related emissions are rapidly removed, so must human input be. You can’t just apply arbitrary dynamics to shape the outcome to your liking. It is drawing epicycles.
Temperature related emissions (seasonal, year-by-year) are rapidely removed by temperature as that are processes which are directly influenced by temperature: the growth and decay of vegetation. The warming and cooling of the oceans.
Human emissions are (mostly) temperature independent, they only increase the CO2 pressure in the atmosphere. The removal of the extra pressure in the atmosphere is only possible by a pressure related process: the imbalance between CO2 releases and sinks of the oceans, the extra uptake of CO2 by plants. These pressure related processes are hardly influenced by temperature.
While the same exchanges are involved, the reaction to temperature and pressure is widely different:
The temperature related processes give you the residence time of any CO2 molecule in the atmosphere: for 800 GtC in the atmosphere / 150 GtC/year exchanges = 5.3 years. Very little change in total CO2 amount in the atmosphere as long as the fiinal temperature remains the same.
The pressure related processes, remove any extra CO2 above steady state out of the atmosphere. That has a much slower decay rate: with 110 ppmv above steady state, only 2.15 ppmv/ year is net removed by the imbalance between sources and sinks. That gives an e-fold decay rate of 110 / 2.15 = 51.3 years or a half life time of ~35 years.
Your basic error still is that you see the variability and the increase in the atmosphere as one process, while that is proven wrong. Both the seasonal variability and the year-by-year variability are dominated by the reaction of vegetation on temperature changes (opposite to each other!). The increase in the atmosphere is not caused by vegetation, as that is a proven small, but increasing sink for CO2.
Thus your theory is not fitting by coincidence, it is fitting two separate processes with different causes which are largely independent of each other…
Jim Ross,
You have largely answered your own question: indeed the drop in δ13C and the rise in CO2 are directly coupled and point to a continuous release of a CO2 source with a rather fixed low δ13C level compared to the (pre-industrial) atmosphere.
The “consensus” uses that as one of the arguments that humans are the cause of the CO2 increase (which in this case is right). Some sceptics don’t agree, as the δ13C sink rate is only about 1/3 of what is expected if all human CO2 remained in the atmosphere. Of course that doesn’t happen, as some 20% of all CO2 in the atmosphere is exchanged with other reservoirs. That includes human emissions, which therefore spread into the ocean surface (and gives a drop of δ13C in the coralline sponges) and vegetation (measured in leaves). These two reservoirs are rapidly exchanging CO2, including its δ13C drop, with the atmosphere.
The main difference is in the deep oceans: What goes in the oceans is the isotopic composition of today (minus some isotopic shift at the air-water border). What comes out is the isotopic composition of ~1000 years ago (minus some isotopic shift at the water-air border), thus from long before the main drop in δ13C.
That dilutes the drop in δ13C caused by human emissions, as the ocean CO2, including the isotopic shifts, was mainly responsible for the ~ -6.4 +/- 0.1 per mil in the atmosphere over most of the Holocene.
Thus the source of low δ13C must be much lower than -13 per mil to overrule the deep ocean δ13C which tries to push the atmospheric δ13C back to -6,4 per mil…
Most inorganic CO2 (oceans, volcanoes, carbonate rocks) has a δ13C level of around zero per mil. Most organic CO2 is (much) lower: from around -10 per mil for C4 plants via -24 per mil for C3 plants (including coal) to -40 and even -80 per mil for natural gas. Thus the drop since ~1850 is either from recent organics or from fossil organics. As recent organics, the biosphere, is a proven small sink for CO2, human emissions fit the bill…
“If temperature related emissions are rapidly removed, so must human input be.”
Bart, i think that’s the “crux of the biscuit”…
Fonzie,
“If temperature related emissions are rapidly removed, so must human input be.”
Bart, i think that’s the “crux of the biscuit”…
That is Bart’s and yours misunderstanding of what happens in nature:
The largest temperature related processes are seasonal: for local temperature changes of 20 degrees and more, lots of CO2 goes in and out the oceans and vegetation. ~110 GtC/season, but countercurrent for oceans and vegetation and countercurrent for the NH and SH, the net remainder is not more than 10 GtC (~5 ppmv) for a global temperature change of ~1 K.
Humans add ~9 GtC/year. Does that influence the seasonal cycle? Hardly as only half of that amount over a year is absorbed by vegetation and oceans, There is hardly any change in the seasonal cycle over the past 57 year, only a slight increase in amplitude, despite an increase of 80 ppmv in the atmosphere over the same period.
While temperature changes move 110 GtC in and out the atmosphere in half a year, an extra pressure of 110 ppmv above steady state only moves 2.15 ppmv (~4.5 GtC) out of the atmosphere over a year.
The CO2 response to a change in temperature is widely different – and largely independent – of the response to a change in CO2 pressure…
Ferdinand,
Thanks again for your feedback. I remain highly sceptical, however, that the model described in your second paragraph can explain both the consistent long term average d13C content of the incremental CO2 AND the d13C fluctuations seen in association with ENSO (which we have not really discessed here). I am happy to let this rest for now.
@ Bartemis & afonzarelli
I won’t repeat myself, see above paqyfelyc November 16, 2016 at 4:35 am
You have to torture data to make it confess that temperature and CO2 are in correlation. You can do it indeed, but, it remains a spurious correlation at best, an artifact more probably.
Paq, this is not a rough correlation. Temperature and the carbon growth rate actually track with one another for well over half a century. (that ain’t gonna happen by chance) It also matches up perfectly with the shallow ice cores during the period where we would expect to see little to no smoothing, that is to say around the turn of the century. (perhaps ferdinand might kindly show you that particular graph that he has; i’ve tried to link to his graphs of late to no avail)…
Jim Ross,
The problem to explain the increase in CO2 and the decline of δ13C is that there are two main processes at work: temperature and human emissions. All other influences are quite negligible.
Temperature is largely responsible for the short-term CO2 variability and over very long periods for the limited change in CO2 at ~16 ppmv/K.
Human emissions have very little variability and its effect on the year by year variability in CO2 increase is not even detectable. On the other side, the increase in emissions over time is largely respobsible for the increase of CO2 in the atmosphere,
The same for the δ13C changes: the influence of temperature variability on the opposite CO2 and δ13C variability shows that it is mainly (tropical) vegetation which reacts on temperature changes (and rain patterns):
http://www.ferdinand-engelbeen.be/klimaat/klim_img/temp_dco2_d13C_mlo.jpg
The main point is that temperature on short term is largely responsible for the variability in CO2 and δ13C by vegetation, but after 1-3 years, that zeroes out and vegetation is a small, but growing, net sink for CO2, preferentially for 12CO2, thus leaving relative more 13CO2 in the atmosphere and thus not responsible for the CO2 increase and δ13C decline.
Neither are the oceans, as increased temperatures release some more CO2, but that has a slightly higher δ13C level than the atmosphere, thus again not the cause of the δ13C decline, but the main origin of the “dilution” of the human δ13C “fingerprint”…
Fonzie,
What graph do you need? The graph for the past century is here:
http://www.ferdinand-engelbeen.be/klimaat/klim_img/law_dome_co2.jpg
The CO2 resolution for Law better than 10 years, for Siple Dome ~20 years (depends of the snow accumulation rate, which is very high at Law Dome: ~1.2 meter ice equivalent/year).
The Law Dome ice core CO2 has an overlap of ~20 years (1960-1980) with direct measurements at the South Pole.
paqyfelyc @ November 18, 2016 at 3:12 am
“I won’t repeat myself…”
Good plan. Errors do not become non-errors by repetition.
“You have to torture data to make it confess that temperature and CO2 are in correlation.”
Nonsense. A scale factor and an appropriate baseline are all that is needed to get staggeringly good correlation between temperature and the rate of change of atmospheric CO2.
Jim Ross @ November 17, 2016 at 11:53 am
Nice.
Ferdinand Engelbeen @ November 18, 2016 at 1:33 am
This is a veritable catechism of faith, with more logical holes than a Swiss cheese.
Bart:
This is a veritable catechism of faith, with more logical holes than a Swiss cheese.
Is that your answer to my:
The CO2 response to a change in temperature is widely different – and largely independent – of the response to a change in CO2 pressure…
That you disagree only shows that you have a lot of knowledge about high frequency processes, but don’t recognize a simple linear process if it is right before your nose…
To repeat the obvious:
Most of the variability of CO2 in the atmosphere is caused by temperature at a rate of 4-16 ppmv/K
All of the increase of CO2 in the atmosphere is caused by the difference between human emissions and the net sink rate.
The latter in a fixed ratio with the extra pressure of CO2 above steady state according to Henry’s law for the actual ocean surface temperature.
Comparing temperature with the derivative of CO2 is physical nonsense, as you have largely detrended the CO2 change in the atmosphere by taking the derivative. Then you compare the slope of the non-detrended temperature with the slope of the linearized CO2 rate of change. Matching two straight lines is not that difficult, just choose the right factor and offset…
Compare T with CO2 and it is clear that the variability in T is responsible for almost all the (small: +/- 1.5 ppmv) variability in CO2, but that hardly influences the (80 ppmv) trend itself.
Compare dT/dt with dCO2/dt and it is even more clear that dT/dCO2 is responsible for almost all the variability in dCO2/dt, but as dT/dt has zero slope, that has zero influence on the slope of dCO2/dt and a limited influence on the increase of CO2 in the atmosphere…
Bartemis,
Thanks for your comment – did you see my paper reference at Nov 18th 12.47am?
Ferdinand,
I had indicated that I was ready to give this a rest but, as you have posted a further comment, can I ask you this:
Can you please show the d13C response, based on your model, during an El Nino and a La Nina. Thanks.
Sorry (again). What I asking for, Ferdinand, is not your graph of rate of change, but the change in actual d13C content of the incremental CO2 during the ENSO phases. Thanks.
Ferdinand_Asserts = true;
while (Ferdinand_Asserts)
{
printf(“We’ve been over and over this. What you are giving is a storyline you’ve made up, that sounds good to you. There is no evidence to confirm it and it is aphysical. The Earth cannot treat anthropogenic and naturally occurring CO2 inputs differently.”);
Ferdinand_Asserts = true;
}
http://www.ferdinand-engelbeen.be/klimaat/klim_ing/co2_T_dT_em_1900_2011_B.jpg
Sorry about that, ferdinand, i should have been more specific. (not having my best of days today) Click on the little blue question mark and it has part of the web address there. It’s the one where you have atmospheric co2 concentrations as calculated from ice cores, human emissions and temperature (3 plots on one graph). It doesn’t look like paq will be back, but i think it would be nice if bart could see it. (after all he does think that you’re a “good person”… ☺) i fell out when i first saw it. Up until that time i had only calculated the growth rate from temps around the turn of the century using WFT. So to see it all there in ppm was just splendid, thanx…
Bart:
The Earth cannot treat anthropogenic and naturally occurring CO2 inputs differently.
At nauseum:
The earth doesn’t treat human and natural CO2 differently. The earth treats temperature changes differenty than pressure changes, for natural and human CO2 alike.
There is no evidence to confirm it and it is aphysical.
Of course if the observations contradict your imaginary solution, that is “not evidence”.
– Ice cores show that CO2 follows temperature in exact ratio to Henry’s law for a dynamic equilibrium.
– The mass balance shows that nature is a net sink for human emissions.
– The oxygen balance shows that vegetation is a net sink for CO2, thus not the cause of the increase.
– The δ13C balance shows that the oceans are not the cause of the increase.
– The ocean’s pH and DIC show that the net CO2 flux is from the atmosphere into the oceans, not reverse.
– The sink rate is in near perfect ratio to the increase in the atmosphere above steady state with the oceans.
One observation that contradicts a theory is sufficient to kill it. All of the above observations contradict your theory. Not enough to convince you that your theory is stone-dead…
For the interested, see further:
http://www.ferdinand-engelbeen.be/klimaat/co2_origin.html
Fonzie,
Here it is:
http://www.ferdinand-engelbeen.be/klimaat/klim_img/co2_T_dT_em_1900_2011_B.jpg
You typed klim_ing in the reference text i.s.o. klim_img. Stupid computers, never undestand what you mean…
That graph is a back-calculation of my own (incomplete) formula that used a fixed increase ratio for emissions and temperature, and Bart’s formula.
Both are quite good in the 1960-2011 period, but Bart’s formula gives more deviation in the pre-1960 period.
Jim Ross,
Here it is:
http://www.ferdinand-engelbeen.be/klimaat/klim_img/d13c_trends.jpg
Where ALT = Alert (New Territories, Canada), BRW = Barrow (Alaska), MLO = Mauna Loa (Hawaii), KUM = Kumukahi (near sea level, Hawaii), SAM = American Samoa (SH) and SPO = South Pole.
Needs some update for the recent years, but all the data are available for the different stations at:
http://www.esrl.noaa.gov/gmd/dv/iadv/
Seems that the source of low 13C CO2 is in the NH at ground level. Not necessary near the poles, as the Ferell cells transports air from the mid-latitudes polewards…
The Pinatubo increased photosynthesis by scattering sunlight, which is visible in the temporary rise of δ13C The 1998 El Niño had the opposite effect. I don’t know what caused the firm 1987-1989 drop.
No, Ferdinand, that was not what I was looking for. I am familiar with the trends (and the data sources). I was looking for the output from “your” model in terms of the predicted δ13C content of incremental atmospheric CO2 during a strong El Niño and a La Niña.
The reason for the drop in 87-89 is, in my opinion, a direct reflection of the smaller, double-peaked El Niño during 86-88. During this period, the δ13C content was below the average of -13 per mil, more like -22 per mil (at least). See here:
http://i68.tinypic.com/2cni3cp.jpg
The above plot also shows clearly the response to stronger La Niñas, where the incremental CO2 has a δ13C approaching zero (-2.9 per mil as illustrated).
BTW, here is an up-to-date version of your plot using monthly data rather than annualised values. Note (i) the spectacular and near-simultaneous drop in δ13C at MLO and SPO corresponding to the El Niño of 97-98, which can be matched by assuming a content of -26 per mil, and (ii) the periods of flat or increasing δ13C, which match with La Niña phases.
http://i64.tinypic.com/fw0tvt.jpg
Jim Ross,
I haven’t used a model for the δ13C plots, only for the CO2 increase and its derivatives. And I have plotted the CO2 rate of change against the CO2 rate of change at Mauna Loa, which shows that the reaction on temperature changes is dominated by vegetation. I can do the calculations for such a model, but have not much time now…
Anyway it is already clear from the plots that the Pinatubo and ENSO have a huge, short term impact on both the CO2 and the δ13C rate of change, but that seems both to level off around zero impact after a few years and most of the trends is from fossil fuel use…
Ferdinand,
OK, fine. Thanks very much for your time.
ferdinand, it ain’t the computer that’s stupid (c’est moi… ☺). i actually wrote it down correctly on paper first, only to bungle the job when it came to typing it in. i suspect that’s what i’ve been doing all along in my recent attempts. Thanks again, the graph is a gem…
Bart, listen up… Little pressed for time here so i’m kind of winging it. This graph is a biggie! The resultant ppm around the turn of the century, as calculated by temps, is entirely dependent on how much warming we have seen in recent decades. As i said to F, i’ve checked out the growth rate circa 1900 at WFT and got about .2-.3 ppm/year (which is entirely consistent with ice cores in that period). This based on extending the temperature part of your graph back to the turn of the century. If we had seen .1C less warming in recent decades, the resultant calculated carbon growth rate circa 1900 would have been .0 ppm/year. If we had seen .1C more warming in recent decades the result circa 1900 would be .5 ppm/year which would be too much. The decades following the turn of the century comprise greater changes in the growth rate. Less stability means less accuracy due to smoothing. We would, however, expect to see (because of the changes in the growth rate) higher numbers in ice cores than in reality up until around 1940 when the growth rate then stabilizes at about 1 ppm/year staying that way until 1980 — i oft wonder if the 1940s plateau is due to smoothing. And that, of course, is what we do see…
Fonzie,
The graph shows mainly two points:
– Both Bart’s assumption based on a constant ratio with the temperature difference from a baseline and a simple (not even complete) calculation based on human emissions show the same fit 1960-current. That is not decisive for which one is better describing reality.
– For the period 1900-1960, Bart’s assumption differs more (~ -20 ppmv) from reality than the incomplete calculation (~ -5 ppmv).
The reason that Bart’s theory has a stronger dip in the early decades is a strong cooling 1900-1910 (-0.4°C) followed by a recovery 1910-1945, but that only in 1925-1930 surpasses the base temperature of 1900. From then on CO2 starts to increase again.
As my calculation was mainly based on emissions, temperature is a minor player and the temperature dip has less influence…
I consider any calculation based on CO2 concentration pre-1958 to be speculative at best.
I consider the temperature record approaching the turn of the 19th to the 20th century to be speculative at best.
I consider the assumption that the system must have uniform response across centuries to be speculative at best. A massive and grossly nonlinear system typically experiences regime changes from time to time when thresholds are crossed.
It is a moot question. There is no need for speculation on remote and increasingly uncertain data and assumptions regarding the dynamics which held then. In 1958, CO2 concentration was about 315 ppm. Today, it is about 405.
If “pre-industrial” CO2 was 280, then (405-315)/(405-280) = 72% of the rise was seen in the interim. And, within that interval of time, the rate of change of CO2 is manifestly proportional to appropriately baselined temperatures, in both the long term trend, and in the variability. It is grasping at straws to maintain against all rationality that, that phenomenal consistency is a mere product of happenstance.
Bart:
that phenomenal consistency is a mere product of happenstance.
The match of the variability is real, as that is the lagged response of mainly vegetation on temperature variability.
The match of the slopes is pure “curve” fitting by comparing temperature with the derivative of the CO2 changes, which has no ground in any physical process…
The match of the slope caused by human emissions is midst the variability…
Ah, but it doesn’t hurt to speculate! And when we do, we find that the relationship holds true…
Fonzie,
Only for the period 1960-current, as good as the response to temperature variability + human emissions gets all the variability + the slope of the CO2 increase in the atmosphere.
It doesn’t fit for the 1900-1960 period and it doesn’t fit for any other period in the past: not for the MWP-LIA-current change in temperature, not for glacial – interglacial transitions over the past 800,000 years.
The temperature (4-16 ppmv/K) + human emissions holds for every period in the past and present…
The current temperature offset gives ~1.5 ppmv/K/year according to Bart’s formula. It gives 4-16 ppmv/K for a transient response according to Henry’s law 4 ppmv/K on short term (seasonal. year by year), 8 ppmv/K (centuries), 16 ppmv/K (millennia) without time limit.
Using Bart’s formula, you have a different reaction speed for each period in the past and present:
1.5 ppmv/K/year in the current period.
0.00375 ppmv/K/year for the MWP-LIA transition (6 ppmv, 0.8°C, 200 years).
0.00125 ppmv/K/year for a glacial-interglacial transition (100 ppmv, 16°C, 5000 years)
0.00043 ppmv/K/year for the opposite interglacial-glacial transition (100 ppmv. 16°C, 15000 years)
Even Bart’s formula gives an indication that the natural response to a change in temperature in the past was orders of magnitude smaller than the current speed of change of CO2. Maybe because the current speed of change is not natural?
Ferdinand,
I mentioned up-thread that I had obtained a much better match to the ice core δ13C data by assuming a constant value for the content of the incremental CO2. It took some time to get a decent(ish) plot, but here it is. The orange line was generated (by me) by applying the Keeling equation to the CO2 data with a starting point for the δ13C values of -6.5 per mil. All other δ13C vaues are calculated solely from the atmospheric CO2 data (every 10 years) by assuming a constant value for the incremental CO2 of -12.7 per mil. The scales for the orange line are shown at the top and to the right, demonstrating alignment of the two graphs.
http://i68.tinypic.com/alsxeg.jpg
It may seem like I am heading down a different road to the Bart/Ferdinand discussions, but I am not. I am just coming at it from a different direction. The key difference between Bart’s view and that of Ferdinand is (as far as I understand it) that Bart views the atmospheric CO2 data as being consistent with a single physical model, driven by termperature, whereas Ferdinand sees it as reflecting two independent processes: one (longer term growth) correponding to anthropogenic emissions, diluted by deep ocean exchanges, and the other (short term fluctuations) being due to temperature.
My position is that I find it difficult to reconcile a model that is based on two independent processes with the information provided by the δ13C data. I was (and still am) waiting to see numerically-based evidence that the dual-process model is consistent with the δ13C observations.
Jim
when you start boiling a kettle, applying the heat from the bottom, the CO2 dissolved in the water is the first smoke you see coming off, right?
[that should have been your first lesson in chemistry on how to prepare water for a standard solution]
It is the same here, except that you start boiling the water from the top. It is mostly the UV coming through the atmosphere – some of it being hindered by certain gases and clouds: that is the uncertainty factor – and the first smoke coming off from the top layer of molecules on top of ocean is in fact the CO2 (g)
HCO3- => CO2 (g) + OH-
On the poles, or any place where it gets very cold, the opposite process happens
CO2 + H2O => HCO3- + H+
So either T and/or pH of the water in total may shift the balance.
The change in pH measured at a few places in the oceans was in my opinion so small so as to be within error of the calibration….[0.1 is the usual error given for a pH measurement]
so, everything depends on the heat that is being applied from the top, which depends on where you are in a solar cycle.
As it happened, we had 50 or 60 years of warming [since 1950], hence we have found CO2 increasing. Unfortunately I think very soon a time will come where our luck with warming will run out, although I must admit that I found some evidence of entrapment of heat where greening had dramatically increased and some cooling where the trees were cut.
maybe if we continue to green more earth and change the deserts into oases we can avert global cooling. But that still seems to me like a long shot, looking at my results so far.
either way, slightly OT, greening of earth seems to me a much better project than going to mars [without first creating a stable atmosphere]
Jim Ross @ November 20, 2016 at 6:37 am
“The key difference between Bart’s view and that of Ferdinand is (as far as I understand it) that Bart views the atmospheric CO2 data as being consistent with a single physical model, driven by termperature, whereas Ferdinand sees it as reflecting two independent processes: one (longer term growth) correponding to anthropogenic emissions, diluted by deep ocean exchanges, and the other (short term fluctuations) being due to temperature.”
That is a fair description, and thanks for your observations. They are very portentous, as they lend support to the inference that we are dealing with a single, dominant, temperature dependent process.
Unbelievable, ferdinand, unbelievable… The correlation works fine all the way back to when we first hit the ice cores. (maybe there’s something wrong then with ice cores) Going back further, from 1958 back to the turn of the century, is a very volatile period for the calculated growth rate. From being negative circa 1910 to over 1 ppm/year come 1945. If there is any smoothing going on, then the ice cores won’t be accurate. When we finally get to a period of stability with little change in the growth rate, the correlation holds true again. From 1850 to the turn of the century, the calculated rate of carbon growth (from temps) would be consistent with cores, about .2 ppm/year. Now i suspect that you didn’t make your graph go back any further than 1900 because your paradigm would then fail. Human emissions in 1850 were just one tenth of the atmospheric growth rate. Temperature was also flat during that period, so a rise in temperature doesn’t explain the rise either. A temperature slightly higher than the equilibrium state maintained over that period does explain the rise. If we go back even further in the cores we also see a rise from 1750 to 1850 of about 10 ppm. This would mean an extra .6C of warming to add to the .6C of warming post 1850 if your paradigm were true. I’ve never heard it referenced that we have had over 1C of warming since the LIA. (even the most staunch of warmists uses the .8C figure as it would destroy their narrative) Speaking of warmists, if i had a dollar for every warmists who says the MWP doesn’t exist, i’d be rich (☺). Maybe they are right! If so, that would be consistent with temps driving carbon growth as represented in the shallow cores. And lastly, you yourself have stated that there is a lag of 50 years in the shallow cores. This would be consistent with temperature driving the growth rate. Indeed, if temps took a dive now, we would need a drop of .7C (below “the pause”) for carbon growth to go negative. (BTW, that .7C figure, calculated from temps, is also very close to the .8C LIA figure) So, don’t feed me your “it doesn’t fit for any period in the past” crap. i already find you to be a contemptable liar and i don’t need yet another reason to despise you all the more…
Bart,
Thanks again for your comments. I am trying not to take sides here (yet), but there is no doubt in my mind that a single process model (with two distinct end points) is consistent with the d13C observations. However, I will wait to see if numerically-based evidence can be shown to support the dual-process model.
BTW, I am not sure that the short-term variations (and the long-term ones too) are driven by temperature, at least not by atmospheric temperature. I believe that ENSO and related oceanic processes may be the key. We do not know what causes ENSO, but since it clearly does have a direct impact on GLOBAL atmospheric temperatures in the short term, and on CO2 growth rates, you will get a good correlation between almost any measure of atmospheric temperature and CO2 growth, because the driver for both may actually be ENSO.
Jim Ross,
This part of the discission is getting too long and there is a huge risk that the reactions get lost, I am going to move it to the end of the list…
Fonzie,
You stil don’t see the problems with Bart’s theory: for every period in the past, he need a different baseline and factor. That is just curve fitting and has no basis in any known process.
My “theory” needs only two basic assumptions: the dynamic equilibrium between (deep) oceans and the biosphere at one side and the atmosphere at the other side for CO2 with temperature and the speed with which any extra CO2 (humans, volcanoes,…) is removed out of the atmosphere in ratio to the extra pressure above steady state,
Take the MWP-LIA transition: a drop of only 6 ppmv over a period of ~200 years lagging a temperature drop of ~0.8 K with ~50 years. That is only nature at work.
In my theory with 8 ppmv/K
In Bart’s theory with 0.0375 ppmv/K/year.
Take the LIA-current transition after 1816:
120 ppmv over a period of 200 years for an increase of maximum 0.8 K.
In my theory 8 ppmv from the temperature increase, 112 ppmv from 200 ppmv human emissions.
In Bart’s theory with 0.75 ppmv/K/year
The same change in temperature in the same time span gives a 30 times faster rate of change in modern times than in the past for the same baseline (!). That simply is impossible.
See the difference in the Law Dome DSS ice core (20 years resolution, 1.2 ppmv repeatability, 1960-1980 overlap with direct measurements at the South Pole):
http://www.ferdinand-engelbeen.be/klimaat/klim_img/law_dome_1000yr.jpg
And try to fit Bart’s theory with the same rate of change as today for a 5000 years long glacial-interglacial transition: some more fun guaranteed…
Unfortunately, using the GISS temperature farce ruins anything you might want to say about any correlation
Meaninless GIGO !!
“You stil don’t see the problems with Bart’s theory: for every period in the past, he need a different baseline and factor.”
This is standard when you are dealing with a linearized model for a nonlinear process. A commonplace. Absolutely nothing unusual or controversial about it.
And, that is only IF the data are themselves reliable, which they are not.
This is an integral relationship – the rate of change of atmospheric CO2 is proportional to appropriately baselined temperature anomaly, so concentration is proportional to the integral of those temperature anomalies. As a result, the error also accumulates over time. It does not take much error to produce a large error in the integrated result.
If anything, it is remarkable that the signal to noise ratio is large enough that we can integrate to such a good fit over the interval 1958 to present. That shows that it is a very well conditioned relationship.
And what if the MWP doesn’t exist?
Look, ferdinand, i was just countering your “cow pie” argument that “it doesn’t fit for any period in the past”… Coming out of the LIA, from 1750 to 1850 we see a rise of 10 ppm. Unless there is a lot of warming there that no one seems to see, then “temps driving growth rate” is consistent with that period. From 1850 to 1900, we see another 10 ppm. This is entirely consistent with the growth rate as calculated from temps. (your model ain’t even close…) And the decades after 1900 may well be what we expect to see given the substantial changes in the growth rate. If there is any smoothing during that period we would expect slightly higher numbers in the cores and we do. And of course, after the growth rate stabilizes (circa 1940), the relationship begins to hold true again. Once again, if the MWP was not world wide, is underrepresented in the cores or both, then it would also be consistent with temps driving carbon growth. At the end of the day, it may well boil down the validity of the deeper cores verses the high resolution shallow cores. (and from there, the deeper cores verses the relationship of temps to carbon growth rate over the past 58 years)…
Bart and Fonzie,
The MWP-LIA and LIA-current transition has the same change in temperature over the same time span. Using the same baseline, the increase in CO2 is 20 (not 30) times faster in the second period than in the first.
You may have a point if you can explain the difference…
That has nothing to do with “a linearized model for a nonlinear process”, as the CO2 response (of the oceans) to temperature is near-linear over the past 800,000 years for cooling and warming periods alike, including the MWP-LIA period.
Integrating temperature has no bearing in any physical process…
Fonzie, human emissions were already there in the period 1750-1850, not so much in CO2, but more visible in CH4, as that increased by the increasing population herding more cattle and growing more rice:
http://www.ferdinand-engelbeen.be/klimaat/klim_img/law_dome_ch4.jpg
‘That has nothing to do with “a linearized model for a nonlinear process”…’
You misunderstand. For a nonlinear, time varying system, there is no requirement that the system act uniformly over all time periods. E.g., with attractors in chaos theory, there is no way to predict when the transition between different operating conditions will occur, but they do.
Linearized descriptions of the behavior hold within specific time intervals under specific conditions. When those conditions change, the behavior changes. But, that does not make linearized models useless, far from it – they are ubiquitous in science and engineering. They are often used to control a given system and prevent it from switching its operating state.
And, again, there is no way to verify the ice core data. It requires a leap of faith.
So, there are two strikes against you on this question. A) appealing to historical data does not help you, because there is no requirement that the system behavior be uniform over all time, and B) your historical data are very questionable.
The question is moot. The rise in concentration since 1958 is at least 72% of the total observed rise, and within that time, it manifestly is proportional to the integrated temperature anomaly. That’s all you need to know.
“Integrating temperature has no bearing in any physical process…”
Yes, it does. It is what happens when you have a temperature modulated THC.
http://ossfoundation.us/projects/environmental/global-warming/myths/images/mwp/ipcc_6_1_large.jpg
http://ossfoundation.us/projects/environment/global-warming/myths/images/mwp/ipcc_6_1_large.jpg
Methane? (talk about the ultimate “cow pie” argument… ☺)
ferdinand, that’s not the point… this isn’t about whether there is another explaination for it. It’s about whether “temps drive growth rate” is consistent with the data. Let me repeat your quote, “it doesn’t fit any period in the past”. i’m going to walk you through 1750-1850 starting at 1650 (which establishes the equilibrium state temperature). From 1650 thru 1760 there is essentially no movement in the atmospheric CO2 concentrations at all. From 1760 to 1810 temps edge higher and we get a steady increase of 8 ppm. At that point (with the dalton minimum and/or tambora) temps dip and carbon growth actually goes negative dropping 1 ppm. Next, the temperature rises above equilibrium again, carbon growth goes positive adding 3 ppm by 1850 (for the total of 10 ppm from 1750-1850). Add to that the perfect fit from 1850 to 1900 and you have right there that “it fits a 250 year period in the past”. (and i haven’t even tried to go back further!)…
Bart:
there is no requirement that the system behavior be uniform over all time
There is indeed no requirement, but as the system does behave near-linear uniform over all times at least in the past 800,000 years, except in the past 160 years, it is clear that your explanation of a possible non-linear response is simply bogus:
http://www.ferdinand-engelbeen.be/klimaat/klim_img/Vostok_trends.gif
Where most of the deviations from the trend are from the long CO2 lags after temperature changes, especially during periods of cooling which were not corrected for.
And, again, there is no way to verify the ice core data.
There are several proxies which verify the ice core CO2 data, but as that are proxies and not direct measurements, these are more problematic that the ice core data. Further, the CO2-T variability shows a very nice fit with Henry’s law and there is a 20 year overlap between ice core data and direct measurements at the South Pole,
Anyway, as long as you have no indication that the ice core CO2 data are wrong for any reason, that are the best data we have.
Moreover, all historical data show the same point: the current CO2 increase is an anomaly for the current temperature.
The rise in concentration since 1958 is at least 72% of the total observed rise, and within that time, it manifestly is proportional to the integrated temperature anomaly. That’s all you need to know.
The rise in concentration since 1958 is 100% explained by human emissions and the net sink rate caused by the increased pCO2 pressure in the atmosphere against the steady state per Henry’s law. That is confirmed by every single observation, while your theory fits none…
Yes, it does. It is what happens when you have a temperature modulated THC.
That only explains part of the increase: 16 ppmv/K, the rest of the increase is from human emissions and the resulting observed CO2 fluxes are net from the atmosphere into the ocean surface, sinking together with the THC.
Fonzie,
You can fit every period by changing the baseline and the factor. But if you use a fixed baseline and factor which fits the 1959-current slope, the deviation in the period 1900-1959 is already 20 ppmv, worse before 1900, as the baseline is higher than during the whole LIA…
Changing baseline and factor for every period is just curve fitting, while the deviation from a simple linear relationship between CO2 and T is less than 10 ppmv over the past pre-industrial 800,000 years… After 1850, human emissions start to emerge and are definitrly the main cause of the increase since 1960.
“There is indeed no requirement, but as the system does behave near-linear uniform over all times at least in the past 800,000 years, except in the past 160 years, it is clear that your explanation of a possible non-linear response is simply bogus:”
No, Ferdinand. You are only showing positive correlation over the long term. This is indicative of linear dynamics.
“There are several proxies which verify the ice core CO2 data, but as that are proxies and not direct measurements, these are more problematic that the ice core data.”
I.e., they don’t really agree with it, unless you put on your confirmation bias glasses.
“That is confirmed by every single observation, while your theory fits none…”
My hypothesis fits all observations, just not necessarily your interpretation of the observations.
“That only explains part of the increase: 16 ppmv/K…”
That is an invalid, static analysis.
Meant to say: This is not indicative of linear dynamics. Which is to say, it does not establish that the dynamics are linear.
Bart:
No, Ferdinand. You are only showing positive correlation over the long term. This is indicative of linear dynamics.
There is a positive correlation over the (very) short term too:
5 ppmv/K for seasonal changes
4-5 ppmv/K for year by year variability
8 ppmv/K for centuries (MWP-LIA)
16 ppmv/K over millennia…
That is the transient reaction of the oceans and vegetation on temperature changes where seasonal and year by year involves the ocean surface and mainly vegetation while for centuries to millennia the deep oceans are dominant…
The reaction on pressure changes in the atmosphere is opposite to temperature changes and causes a disequilibrium between influx and outflux from/to the oceans. It is suprisingly linear over the past 57 years:
currently 2.15 ppmv / 110 ppmv increased pressure above steady state or an e-fold decay rate of ~51 years or a half life time of ~35 years.
My hypothesis fits all observations, just not necessarily your interpretation of the observations.
Sorry, you may be a master in chaos theory. know everything about high frequency processes, but you have a total lack of insight of what the observations show. Simply ask anybody in biology what the decline in δ13C means for the possibility that the oceans are the cause of the CO2 increase in the atmosphere. Or what the oxygen balance (or the greening of the earth) means for the absorption or release of CO2 in the atmosphere by the biosphere…
Bart, i’m outa here! Have a happy T- giving. And remember, your pain is our gain. i for one really appreciate all that you do. i learned quite a bit this particular go round. (i think the debate went forward a bit into new territory) Keep up the good fight!
Ferdinand, yer good when you sleep. (see ya)…
Happy Thanksgiving to you and yours, Fonzie. See my my last comment on this thread where I think I sew it up into a nice little bag.
Ferdinand makes too many assumptions, without regard for whether a given assumption has any basis in fact. As a result, he has built a house of cards with a very rickety foundation. He essentially assumes instantaneous response of a system that takes centuries, even millennia, to reach steady state. And, that one card brings his whole edifice crumbling to the ground.
And, Ferdinand, though you do not share our holiday, thank you for the discussion. May you have a blessed weekend coming up as well.
Bad link. Fixed.
This just can not be true because a little birdy told me a long time ago that we were well past the point of no return (aka “tipping point”).
Reblogged this on Climatism and commented:
The Paris climate deal and the follow-up climate gabfests such as in Marrakech are merely a ruse to market and promote “climate change” as an imminent and dangerous threat in order to promote many of the Left’s social agendas like wealth redistribution, power, control and the elimination of capitalism as the dominant system of economic freedom and prosperity in favour of a centrally planned system i.e socialism/communism.
The CO2 level is definitely in decline ..
The Liberals have been holding their collective breath for a week now ..
It’s the ICS effect .. Individual Carbon Sequestration
“The CO2 level is definitely in decline ..”
I can just see Mike Mann saying, “All together now…”
HIDE THE DECLIIIINE!
HIDE THE DECLIIIINE!
😉
Perhaps I’ve forgotten how to read graphs, but it appears to me the CO2 emissions chart for China shows a continuing increase and the EU chart shows a deceased. The text, however, says the opposite. What’s up with that?
“Global carbon emissions from burning fossil fuels did not grow in 2015 and are projected to rise only slightly in 2016, marking three years of almost no growth,”
Has WUWT been adjusting the CO2 data downward? (sarc off)
Yep, you just stop making stuff. Worked for the Dark Ages. Those mass immigrations were so much easier in the cool.
So, if I understand correctly, CO2 emissions are accelerating at a slower rate, to the point of possibly not accelerating anymore (within the uncertainties) for the next few years. Word.
I wonder if the powers behind the global warming scam people aren’t pushing all this green stuff , like turbines, solar etc etc, meant for the “greater good” but to cause a greater problem . not because of warming but because ( as the recent grid failure in Oz showed) a failure in case of a a severe COOLING spell as what happened during a cold snap in England a few years ago?
As many of you have said it isn’t warming that should scare the hell out of us . It is cooling that with a “green” infrastructure breakdown we would be left without any real energy infrastructure that we should have with fossil fuel power plants ( and nuclear). That worries me a great deal more than anything. (Reverse psych by these scammers?)
No correlation between emissions and atmospheric CO2 or between emissions and warming. Also, carbon budget accounting taking uncertainty into account does not show a role for fossil fuel emissions.
https://papers.ssrn.com/sol3/papers.cfm?abstract_id=2862438
https://papers.ssrn.com/sol3/papers.cfm?abstract_id=2845972
https://papers.ssrn.com/sol3/papers.cfm?abstract_id=2654191
Jamal,
Since you have detrended the CO2 increase in the first two references, you have removed the main cause of the increase, human emissions. Thus your conclusion that human emissions are not the cause of the CO2 increase is only based on the variability in the derivatives and has no validity for the cause of the increase…
The third reference looks at the sum of errors of all individual natural fluxes, but the relationship is not based on individual natural fluxes, it is based on the calculated net result of all natural fluxes together. That is -4.5 +/- 3 GtC/year. After only 2 years, human emissions already exceed the large variability in rate of change…
TA, Bob Zubrin is otherwise a sensible and intelligent engineer although prone to bursts of enthusiasm (not a bad thing). When you do the numbers there is already 20 to 30 times as much mass of CO2 over each square meter of Martian surface as there is over each square meter of Earth’s surface.
In the past I think Zubrin called for CFC’s to be put in the Martian atmosphere. That might be politically incorrect though as idiots would claim that would destroy the (non existent) Martian ozone layer!
I have followed Zubrin’s career for many years and he is one of the true visionaries as far as space development goes. But he is obviously not up to speed on human-caused global warming.
Zubrin needs to have a long talk with Freeman Dyson.
WTF? How can so many presumably intelligent posters above not recognize that the article being discussed is NOT about a decrease in CO2 emissions, but about the decrease in the RATE of increase? Perhaps the decline of understanding among the newer visitors here is why we no longer get to read the thoughts of some truly informed commentators on the subject. rgb@duke comes to mind, and Leif seems also to have second thoughts about contributing. Please folks, pay attention to what is actually being said. Thanks!
I guess we’re dumber than you think.
Larry,
I fully agree that several very interesting posters don’t come back anymore because they think it is a waste of their time… I really miss RGB and hope he will come back soon…
Larry:
“How can so many presumably intelligent posters above not recognize that the article being discussed is NOT about a decrease in CO2 emissions, but about the decrease in the RATE of increase? ”
Perhaps it’s because of the title of the post ….
“Who needs the Paris climate agreement? CO2 emissions are declining on their own”
Note: “CO2 emissions” when it should have been “Rate of CO2 emissions”
It’s the usual “Dog-whistle” for the faithful.
Mind I suspect most would have misconstrued even that statement.
For someone who understands science, it is very depressing.
I try to point people in the right direction (have here further up).
But truth be told most don’t want to read/listen.
The Blog gets the posters it deserves.
I hate to think what threads about the Sun would come to without Leif.
And he’s one of the very few experts who can be bothered.
Pity about Arctic temperatures remaining so stubbornly high.
Skeptics seems to have moved from:
It’s not declining
to
Well it’s recovering
to
It’s all natural
to
Well it’s a good idea if it does disappear.
Like Brexit, they are supporting something with no idea of what the impact may be.
Remember, if this temperature trend continues, 2017 is likely to be the first mainly ice free summer in the Arctic. Maybe it’s a more important issue than a marginal slowdown in the rate of co2 increase?
http://ocean.dmi.dk/arctic/meant80n.uk.php
Gareth,
DIfficult to say what happens with sea ice. as the satellite measurements are down for over half a year…
In general the sea ice was increasing around Antarctica at about the same speed as the Arctic was melting.
It is hard to find overall temperature data for Antarctica, but here for the relative “warm” Peninsula:
https://www.theguardian.com/environment/2016/jul/20/antarctic-peninsula-temperatures-have-fallen-study-shows.
er… no… they just moved to another satellite which was up and running all year.
Here’s a link showing graphs of the current low extent.
https://seaice.uni-bremen.de/amsr2/index.html
And you might note the current low extent in the antarctic too.
and here’s the NSIDC update on it:
http://nsidc.org/arcticseaicenews/
“After a quick initial freeze-up during the second half of September, ice growth slowed substantially during early October. On October 20, 2016, Arctic sea ice extent began to set new daily record lows for this time of year. After mid-October, ice growth returned to near-average rates, but extent remained at record low levels through late October. High sea surface temperatures in open water areas were important in limiting ice growth.”
A) The data record is very short, but there are other years with large excursions in temperature even in that record.
B) The globe has warmed since the end of the Little Ice Age. Nobody disputes that. That is why they called it the end of the Little Ice Age.
The questions are, did it warm because of human activity, is warming bad, and is there anything we can do about it? The answers are no, no, and no.
But what we will find next is that global CO2 ppm continues to rise just as it has since measurements started….despite the stasis in emissions.
Now, how on earth could that be?
Now, how on earth could that be?”
Well unless you are alluding to conspiracy.
Surely not? (sarc) ….
It will be because we are talking of rate of increase of emissions.
And roughly half of human emissions are still accumulating in the atmosphere, the biosphere unable to sink them.
So ~half of that lovely stuff puthering out of your tailpipe, jet engines and powers stations etc is actually still accumulating, ergo, yes “global CO2 ppm continues to rise”.
Michel,
Because emissions still are above the net sink rate…
So the green things have grown as a result of CO2 fertilization and a new equilibrium has been reached.
They take care of year-to-year changes, yes. But the secular changes depend partly on what happened 800 years ago.
An ancient forest in Alaska has revealed itself. Carbon dating places it ~ 1000 years ago, I read other reports that some have dated back 2000 years ago. These dates fall right into the Medieval and Roman Warmth period respectively. What would be of interest if the stomata can be extracted and use as a proxy for CO2 concentrations at that time.
http://www.livescience.com/39819-ancient-forest-thaws.html
The USA’s switch from coal to natural gas has undoubtedly had an effect too.
Which is why the renewables-promoting NGOs are so fanatically against shale gas, and spend so much of their efforts on obstructing it. It’s the competitor in the carbon stakes that actually delivers the reduction, whilst theirs does not.
“Prof Corinne Le Quéré, Director of the Tyndall Centre at UEA who led the data analysis, said: “This third year of almost no growth in emissions is unprecedented at a time of strong economic growth. This is a great help for tackling climate change but it is not enough. Global emissions now need to decrease rapidly, not just stop growing.””
Translation: We will not be happy until all human beings live in caves and eat dirt. No amount of effort short of this is worth even considering to be taking the situation seriously.
hum … very bad news.
To put down the whole scam we need CO2 human emission to go up and observe temperature go down, stall, or moderately up (the basic physics way, ~1K per CO2 x2).
If CO2 emissions stall (or even decrease !) we are fùcked: should future T go down, greentard will boast of their success, should T go up they will keep saying it would have been much worse with more CO2.
I congratulate Ferdinand Engelbeen on his patient, polite and clear responses to the posters here. Many would not have been required if the posters had read Ferdinand’s responses to previous posts.
+1
Yes thanks Ferdinand for informative responses. Lots to learn from his exchanges with commentors.
Nothing to learn but a pat narrative divorced from actual physics.
and lies…
Actually, it’s Ferdinand Engelbeen who needs to read posts more carefully.
leejack01 shows that, until recently, emissions were increasing the fastest ever. But for the last three years they ground to a halt. Emissions remained constant. As noted by Chris Hanley, Greg, Jurgen, and leejack01, the sharp change of emissions increase had no effect on CO2. CO2 continued to increase, as fast or faster then as when emissions were lower and rapidly increaaing.
Clearly, CO2 doesn’t depend on the increase or decrease of emissions. If it doesn’t depend on the increase or decrease of emissions, CO2 cannot depend on emissions.
Ian,
Emissions were increasing every year except for a few periods where some economic crisis happened. That can be clearly seen in the CO2 rate of change of emissions, increase in the atmosphere and net sink rate.
With ever increasing emissions the resulting increase in the atmosphere increases slighty quadratic over time and as the net sink rate is in direct ratio to the extra CO2 pressure in the atmosphere above equilibrium, the sink rate increases slightly quadratic too. That gives in average a rather constant ratio between increase in the atmosphere and human emissions.
If the emissions remain constant for some period but the sink rate still is less than the emissions, CO2 still increases over time, but at more constant rate (see the period 2001-2013). Over longer periods that will lead to an increase in sink rate, thus what remains in the atmosphere gets smaller but still positive, until sinks and emissions are in equilibrium.
Temperature plays a huge role in the year by year and decade by decade variability but hardly over the full period of Mauna Loa measurements, as year by year variability in CO2 rate of change is mainly the effect of temperature variability on (tropical) vegetation, while vegetation over longer periods is a net sink for CO2, the earth is greening…
“the net sink rate is in direct ratio to the extra CO2 pressure in the atmosphere above equilibrium” seems quite a strong assumption to me.
As far as biosphere is involved, and it is very much so, and as you pertinently pointed out above with actual data, the sink depends on temperature (and solar energy, and water availability, etc.), and don’t care about “equilibrium” (actually that’s even part of definition of life : out of equilibrium chemistry), nor about CO2 pressure in the atmosphere. When CO2 dropped too low, some mushrooms began processing lignin (previously untouched and eventually turning into coal), C4 photosynthesis developed, … Life always find some other way.
Obviously extra CO2 pressure in the atmosphere will stimulate the net sink, but, still, “net sink” is a such a bizarre combination of many sources and sinks following their own different process… I see no reason why the ratio should be direct.
paqyfelyc,
The main sinks are the oceans, which simply react linear to the increased pressure above the dynamic equilibrium pressure (currently ~290 ppmv) for the current area weighted average ocean temperature per Henry’s law.
The reaction of the biosphere is slower, and is much more diversed with the circumstances: not only temperature, also rain/drought, minerals, fertilisers, sunshine, type of plants,… all have an impact on the CO2 uptake. That makes that before 1990 the biosphere was even a slight source of CO2, after 1990 a small, but increasing CO2 sink.
Increasing CO2 in greenhouses helps the growth of many plants, average ~50% faster for a CO2 doubling, but such ideal circumstances of water, temperature and nutrients are seldom found in nature…
That the reaction on the CO2 pressure above the oceans’ steady state is quite linear, at least since 1959 can be seen in the near constant pressure – sink ratio:
In 1959:
25 ppmv above equilibriom / 0.5 ppmv/year sink rate = 50 years e-fold decay rate or a half life time of 34.7 years.
In 1988:
60 ppmv, 1.13 ppmv/year, e-fold decay rate 53 years, half life time 36.8 years
In 2012:
110 ppmv, 2.15 ppmv/year, e-fold decay rate 51.2 years or a half life time of 35.5 years.
Looks surprisingly linear to me, widely within the borders of accuracy of the emission inventories and year by year natural sink capacity variability…
I am essentially saying that we don’t have enough knowledge (sound theory, sufficient data, etc.) to be sure that have to be the case in all instance. More probably this just another coincidence that will be short lived.
As far as i remember, it shouldn’t take so many years for equilibrium to be reached again, that is, for CO2 pressure to return ocean equilibrium value. We have ~50 GtC/year out and in the oceans, but per Henry’s law we could and should have ~55 GtC/year in and ~45 GtC/year out and voila, equilibrium is back if it wasn’t already. So my guess is, it IS indeed at equilibrium, or not far, at least as far as oceans are concerned (that is, CO2 may be not a so well mixed gas, or marine lifeforms are messing by turning CO2 into carbonate and sugar, …). But i confess not being the professional chemist here, so tell us …
paqyfelyc,
The main problem why it costs so much time to reduce the extra CO2 in the atmosphere is ocean chemistry and uptake speed.
The flux between upwelling and atmosphere is directly proportional to the CO2 partial pressure (pCO2) difference between ocean waters and the atmosphere. Wind speed also plays a huge role as diffusion of CO2 in water is very slow. The opposite happens at the sink side near the poles.
The mixed layer has a large interactive surface but its capacity is small due to its limited buffer capacity (still 10 times higher than what fresh water can absorb). That is limited to ~10% of the change in the atmosphere, both in % and quantity.
According to Feely e.a. the maximum pCO2 difference between oceans and atmosphere is ~350 μatm at the upwelling and ~250 μatm at the sink side of the (deep) oceans fluxes. At steady state, both endpoints added/removed ~40 GtC/year as CO2.
If you add 10 GtC as CO2 (~5 ppmv or ~5 μatm) in the atmosphere you decrease the pCO2 difference at the upwelling sites with 5 μatm, or a decrease in upwelling from 40 GtC/year to 39.4 GtC/year. At the sink side the opposite happens: 40.8 GtC gets removed. Or a total of ~1.2 GtC/year out of the additional 10 GtC CO2 gets removed.
Of course, the real emissions didn’t start at 10 GtC/year and meanwhile the extra CO2 pressure in the atmosphere is already 110 μatm above steady state and the surface, including at the sink areas is already a lot more saturated with CO2,… All together the current net sink rate in the ocean surface is ~0.5 GtC/year and some 3 GtC/year sinks extra in the deep oceans than is released at the upwelling zones…
@ferdinand meeus
according to the NOAA link you provided, “The average pCO2 of the global ocean is about 7 µatm lower than the atmosphere”. If i trust NOAA (… no comment …), seems to me that oceans are globally pretty close to equilibrium, they just need to eat 7ppmv CO2 from atmosphere to be. Moreover, taking into account that surface marine life eats CO2 (*), i expect a lower pCO2 in water than in air.
(*) Forgive digression: this makes me wonder why there are no “floating trees”, living things floating , eating atmospheric CO2 and sunlight … I guess neither are limiting factor of marine life.
paqyfelyc,
Apologies if you were being sarcastic, but the floating trees are called phytoplankton.
paqyfelyc,
You need to make a differentiation between the ocean surface and the deep oceans.
The ocean surface layer (~1000 GtC, 800 GtC in the atmosphere), is following what happens in the atmosphere quite rapidly: half life time for any change in any of these two is less than a year.
The net effect is quite modest: due to ocean chemistry (limited buffer capacity), a 100% change in the atmosphere gives a 10% change in CO2 (and derivatives) in the ocean surface. That is 3% for the 30% increase in the atmosphere. That is from 1000 to 1030 GtC in the ocean’s surface.
The average 7 μatm difference in any year pushes some 0.25 ppmv/year extra into the ocean surface. Next year, humans add some 4.5 ppmv into the atmosphere, thus increasing the ppmv’s in the atmosphere more than the ocean surface can absorb. Less than half of that is absorbed by the deep oceans and vegetation (including organics in the oceans), That makes that the 7 μatm difference remains about the same, slightly increasing over the years…
The main sinks are the deep oceans, where the largest differences in pCO2 are seen: 350 μatm at the upwelling sites, 250 μatm at the sink sites. Both move ~40 GtC/year out and in, with ~3 GtC/year more sink than source and growing in direct ratio to the increase in the atmosphere…
Most of CO2 removed by sea plants (plankton), is eaten by other creatures and ultimately mostly again converted into CO2, the same as what happens on land. Some organics and inorganics drop out of the surface layer and enrich the deep oceans – or make layers of organics (-> oil) and inorganics (-> chalk).
There is a small CO2 sink by the total biosphere (both ocean and land), based on the oxygen balance…
jim, i envisioned things that were half atmospheric, like trees are on land. Phytoplankton is fully undersea. But that was digression.
Ferdinand, I simply observe that oceans are and remains more or less at equilibrium, globally. The fact that
the average difference is, and remains, only 7 μatm is a wonder. You have to take it into account.
hum … very bad news.
To properly debunk the whole scam we need CO2 human emission to go up and observe temperature go down, stall, or moderately up (the basic physics way, ~1K per CO2 x2).
If CO2 emissions stall (or even decrease !) we are fùcked: should future T go down, greentard will boast of their success, should T go up they will keep blaming CO2 and saying it would have been much worse with more CO2.
hum … very bad news.
To debunk warmistas we need CO2 human emission to go up and observe temperature go down, stall, or moderately up (the basic physics way, ~1K per CO2 x2).
If CO2 emissions stall (or even decrease !) we are ******: should future T go down, warmistas will boast of their success, should T go up they will keep saying it would have been much worse with more CO2.
Given global demographic trends and the subsequent impact of global economic activity, CO2 has no where to go but down. It is a lagging indicator of population, especially monied population. The adequately monied portion of the population is at or near replacement world wide and its fecundity is not increasing. Its fecundity is decreasing. Some point to the fact that the inadequately monied are not yet down to replacement but they eventually will be, also, they have higher mortality. Furthermore, the inadequately monied barely move the needle on CO2 output. Because they are poor.
So much misunderstanding in this thread. The article says CO2 emissions did not GROW, not that they STOPPED.
Think of a water tap, through industrialisation, we’ve been turning the handle to increase the flow, but recently taken our hand off the tap. BUT THE TAP IS STILL FLOWING. So of course the Mauna Loa measurements will keep going up, for a long time yet.
This analogy also dispels the “96% natural CO2” myth. Think of the bucket with the water in it naturally moving up and down a bit each day. But a constant increase from the tap, even if only 3% of the change each day, will add a huge amount over a year!
“But a constant increase from the tap, even if only 3% of the change each day, will add a huge amount over a year!”
Not when the bucket has a hole in it. And, this bucket does.
If you take a bucket with a hole in it, and you pump water into it through a garden hose, the water will rise to a level at which the pressure above the hole produces as much outflow as inflow, and then you have balance.
Add another source that is 3% of the inflow from the garden hose, and the water level will rise… wait for it.. 3%.
Therefore, if you find the level rose more than 3%, you must conclude that someone turned up the spigot to the garden hose.
“Clearly, CO2 doesn’t depend on the increase or decrease of emissions. If it doesn’t depend on the increase or decrease of emissions, CO2 cannot depend on emissions.”
Obviously the amount of manmade CO2 in the atmosphere MUST depend on emissions.
And has been explained by many above – the issue is one of RATE of INCREASE.
Please note that RATE is the derivative of increase.
Then you must consider how much the biosphere can sink.
It can only sink around half of that.
So we have half still accumulating.
The total emission would have to halve to allow some balance and even then there is still thermal inertia (oceans) acting so a temp respose will lag that.
https://www.ipcc.ch/publications_and_data/ar4/wg1/en/faq-10-3.html
“Then you must consider how much the biosphere can sink. It can only sink around half of that.”
Beware. There is no physical way biosphere can tune its CO2 eating to human emissions, since there is no difference between CO2 emitted by humans, volcanoes, ocean or whatever. Meaning this ~half ratio is just a contingent coincidence. It can and will be otherwise
paqyfelyc,
Agreed, the uptake of CO2 by the biosphere and mainly by the oceans depends of the total increase of CO2 pressure in the atmosphere, not of the yearly emissions…
That it is in average about half the emissions is pure coincidence, as human emissions in general increased linear over time, leading to a slightly quadratic increase in the atmosphere and a slightly quadratic increase in total CO2 absorbed by nature. If human emissions would go flat at about half the current emissions, the result would be zero increase in the atmosphere. In the unlikely case of a real danger from huge levels of extra CO2, all we have to do is halving – or sightly below – the emissions to stop the increase of CO2 in the atmosphere…
“It can only sink around half of that.”
There is no physical law that says it can only sink half of it. There is no limit at all.
if increase in [CO2] is not in pace with ‘human’ emissions
[never mind the variation in earth’s volcanic activity which also affect [CO2] in the atmosphere – can anyone really measure that?]
it means that earth is busy cooling
i.e. the oceans have started to dissolve the CO2
CO2 + 3H2O + cold => CO3 (2-) + 2H3O (1+)
exactly as I have told you
frankly, I don’t trust any of the ‘official’ data sets anymore
because
1) calibration problems
2) insistence on looking at means instead of min. and max.
3) fiddling with original data to make it look like it is still getting ‘warmer’ [politics]
The discussion here relates to points that are irrelevant since I find that CO2 is not causing any warming.To give a summary of all my investigations into climate change starting ca. 2009/2010
Concerned to show that man made warming (AGW ) is correct and indeed happening, I thought that here [in Pretoria, South Africa] I could easily prove that. Namely the logic following from AGW theory is that more CO2 would trap heat on earth, hence we should find minimum temperature (T) rising pushing up the mean T. Here, in the winter months, we hardly have any rain but we have many people burning fossil fuels to keep warm at night. On any particular cold winter’s day that results in the town area being covered with a greyish layer of air, viewable on a high hill outside town in the early morning.
I figured that as the population increased over the past 40 years, the results of my analysis of the data [of a Pretoria weather station] must show minimum T rising, particularly in the winter months. Much to my surprise I found that the opposite was happening: minimum T here was falling, not just in winter months, but any month….I first thought that somebody must have made a mistake: the extra CO2 was cooling the atmosphere, ‘not warming it. As a chemist, that made sense to me as I knew that whilst there were absorptions of CO2 in the area of the spectrum where earth emits, there are also the areas of absorption in the 1-2 um and the 4-5 um range where the sun emits which altogether must be much larger than the energy coming off from earth. Not convinced either way by my deliberations and discussions as on a number of websites, I first looked at a number of weather stations around me, to give me an indication of what was happening:
The results puzzled me even more. Somebody [God/Nature] was throwing a ball at me…..The speed of cooling followed a certain pattern, best described by a quadratic function.
I carefully looked at my earth globe and decided on a particular sampling procedure to find out what, if any, the global result would be. Here is my final result on that:
https://wattsupwiththat.com/2016/11/14/who-needs-the-paris-climate-agreement-co2-emissions-are-declining-on-their-own/#comment-2343066
Hence, looking at my final Rsquare on that, I figured out that there is no AGW, caused by CO2, at least not measurable.
there is something else missing from the comments here/
we can see from the weather reports that most weather systems originate from the oceans/
presumably most evaporation happening around the equator /
the subsequent wind and rain is caused by the T differential between the poles and the equator.
OK?
\so how does this evaporation happen? well, er, we all know that visible light does not heat the water – you can sit on top of a few drops of water with a light torch for as long as you like: it won’t evaporate.
So it must be the UV and IR that does it.
More so the UV, I think, as it carries the most energy…..
So, it is mostly the UV that heats the molecules of water lying on top of the surface to the state where it reaches evaporation [373K]. Now the CO2 is dissolved into the water at a certain pCO2. So as the H2O evaporates, so does some of the CO2, at a certain [predictable?] rate
Now, assuming the post is correct and the rate of increase in CO2 is decreasing, despite humans [growing populations] putting the same or more CO2 up in the atmosphere, it must be that the rate of UV coming through the atmosphere is declining……
That, IMHO, is exactly what is happening: as ozone increases so will the UV coming through the atmosphere begin to decline.
Jim Ross said November 20, 2016 at 4:14 am
Ferdinand,
I mentioned up-thread that I had obtained a much better match to the ice core δ13C data by assuming a constant value for the content of the incremental CO2. It took some time to get a decent(ish) plot, but here it is. The orange line was generated (by me) by applying the Keeling equation to the CO2 data with a starting point for the δ13C values of -6.5 per mil. All other δ13C vaues are calculated solely from the atmospheric CO2 data (every 10 years) by assuming a constant value for the incremental CO2 of -12.7 per mil. The scales for the orange line are shown at the top and to the right, demonstrating alignment of the two graphs.
Jim Ross siad November 20, 2016 at 6:37 am
It may seem like I am heading down a different road to the Bart/Ferdinand discussions, but I am not. I am just coming at it from a different direction. The key difference between Bart’s view and that of Ferdinand is (as far as I understand it) that Bart views the atmospheric CO2 data as being consistent with a single physical model, driven by termperature, whereas Ferdinand sees it as reflecting two independent processes: one (longer term growth) correponding to anthropogenic emissions, diluted by deep ocean exchanges, and the other (short term fluctuations) being due to temperature.
My position is that I find it difficult to reconcile a model that is based on two independent processes with the information provided by the δ13C data. I was (and still am) waiting to see numerically-based evidence that the dual-process model is consistent with the δ13C observations.
Jim Ross,
Very interesting that your fixed low-δ13C source shows a nice fit with the δ13C decline for the measured increase. I had expected more deviation, as the biosphere in the years before 1990 was probably a small source of low-δ13C, while a sink for low-δ13C thereafter. On the other side, there is a shift in δ13C of fossil fuels from mainly coal (-24 per mil) towards oil (~-25 per mil) and especially natural gas (-40 per mil and lower)… may compensate each other to a certain extent.
Have a detailed look at the short term variability of temperature, CO2 and δ13C changes, especially for the 1998-1999 El Niño / La Niña:
http://www.ferdinand-engelbeen.be/klimaat/klim_img/temp_dco2_d13C_mlo.jpg
The increase in temperature rate of change gives a lagged, strong increase in CO2 rate of change and a simultaneous drop in δ13C rate of change. That points to vegetation as the main reactant to the temperature variation. If it were the oceans, the δ13C changes would parallel the CO2 changes, because the oceans have a higher δ13C level than the current atmosphere, even taking into account the isotopic shift at the surface boundary.
Thus the short term reaction of vegetation to temperature changes is clearly the main cause of the CO2 rate of change variability. The problem for Bart’s theory is that vegetation, based on the oxygen balance (*) on longer (1-3 years) term is a proven sink for CO2, at least since 1990.
Thus while (near) all variability in CO2 and δ13C rate of change is caused by the influence of temperature variability on vegetation, vegetation is not the origin of the overall increase in CO2 or overall decline in δ13C.
The process that causes the overall changes still may have been caused by temperature, but that is certainly not by vegetation. Anyway, there are two separate processes at work: one that is mainly responsible for the variability in rate of change of both CO2 and δ13C and one that is reponsible for the total increase of CO2 and decline in δ13C.
Maybe the oceans, as Bart insists, but that has several problems:
– Its δ13C level is too high. Of course, together with human emissions, that may level off to the right δ13C level. That means that both human emissions and ocean emissions remain in the atmosphere in a ratio of about 1:15 (-24 per mil down for fossil fuels, +1.6 per mil up for the oceans, compared to curent atmospheric δ13C). That means a yearly increase of 144 GtC/year in the atmosphere, while the observed increase is only ~4.5 GtC/year wth ~9 GtC/year emissions. Thus all what the ocean fluxes do is “thinning” the human δ13C “fingerprint”.
– Bart’s alternative explanation is that the natural circulation and addition from the oceans is much larger than the human addition. That is theoretically possible, but has one huge problem: all three factors in play: human emissions, increase in the atmosphere and net sink rate increased a fourfold in the period 1960-2013, The sinks in a one-process-fits-all react the same on all CO2, whatever its origin. That is only possible if the natural circulation also increased a fourfold in the same period, for which is zero indication (in residence time or δ13C or bomb tests 14C decline).
As there are clearly two separate processes at work and neither vegetation nor the oceans can explain the drop in δ13C (neither most of the increase in CO2) human emissions fit the bill in all aspects…
(*) see: http://science.sciencemag.org/content/287/5462/2467
and
http://www.bowdoin.edu/~mbattle/papers_posters_and_talks/BenderGBC2005.pdf
Ferdinand,
Thanks for moving the comments down here – it certainly makes it easier to follow. I am not sure if anyone else is still following this, hopefully Bart is, but I certainly appreciate the opportunity to discuss these points with you.
Before I respond directly to your comment above, I should make it clear that I am a firm believer in the data constraining the model(s), not the other way around. Consequently, I have focussed exclusively on extracting information from the data (observations/measurements), since these are the closest we have to “facts”, before I look to see if the “consensus” models really do fit these facts. This is why I prefer not to consider the implications of the oxygen balance model yet, as it may be wrong (as with any model) and that could lead to an incorrect interpretation of the data. I will make a reference to the oxygen balance model later in this comment. I consider the assertion that roughly half of all human CO2 emissions end up in the atmosphere is also a model, requiring validation by the data (not by other models).
So, your derivative plot. I have a somewhat different interpretation. The rate of change of CO2 clearly increases during the 97-98 El Niño. It then decreases as the subsequent La Niña develops. These rates are always positive and hence reflect the rate of increase of atmospheric CO2: CO2 is still increasing during La Niña, it is just increasing at a slower rate than during El Niño. Indeed, it is increasing at a slower rate than the average. In contrast, the rate of decline of δ13C increases during El Niño. This is consistent with the δ13C content of the incremental CO2 decreasing from the average of -13 per mil to circa -26 per mil. However, during La Niña, the rate of decrease of δ13C reduces to the point of becoming positive. At this point, we have a situation where both CO2 growth and δ13C growth are positive, i.e. they are changing in parallel. This relationship shows up in the “raw” seasonally-adjusted data: CO2 growth kicks in at the beginning of 1998 and then from mid-late 1998 through to around the beginning of 2000, it increases at a much lower rate. During this latter period the atmospheric δ13C is increasing, demonstrating a source with a δ13C content higher than atmospheric CO2. The probability that these two sources are independent of each other seems to me to be fairly small, given the linear Keeling plot with an average value half way between the two extremes, but that is why I want to see the numerical basis (in terms of δ13C) for the proposed explanation.
http://i65.tinypic.com/15i5c0p.jpg
The oxygen balance model seems to be widely accepted. However, I feel uneasy, to say the least, when I see a combination of five independent or partially-independent parameters, all known to vary over the relevant timescale, being used in combination to explain a beautiful linear relationship. I immediately wonder if it is not more likely that the correct model is a simpler one. (The variables are: the estimated size of emissions, increasing annually at least until recently; the exchange rate with oxygen, assumed constant, but which must have changed with the balance of fossil fuels; the estimated proportion of emissions absorbed by the oceans, the estimated proportion absorbed by the terrestrial biosphere; and, the “minor adjustment” for assumed oxygen outgassing.) Here is the beautiful linear relationship, R squared of 0.9975:
http://i66.tinypic.com/d9ov5.jpg
” However, I feel uneasy, to say the least, when I see a combination of five independent or partially-independent parameters, all known to vary over the relevant timescale, being used in combination to explain a beautiful linear relationship.”
Yes, it is a clear violation of Occam’s Razor. It is drawing epicyles to make circles into ellipses, when simply admitting ellipses into the realm of acceptable answers both simplifies the math, and clarifies the cause.
true
the equation is simply
[certain] energy in = [certain] CO2 out.
Vary the energy in and you also vary the amount of CO2 coming out of the ocean.
the only factor that is added is the CO2 from burned fossil fuels released into the atmosphere.
Since the rate of CO2 is declining – whilst ‘human’ CO2 is more or less the same,
it follows that earth must be cooling – somewhat –
[I think] there is still more cooling to come
don’t let anyone fool you
go south young man
go south
Jim Ross,
I have the same (practical) man: looking at the data and if they fit the theory, accepting the theory as long as it isn’t contradicted by new data…
That was my viewpoint when I saw the Keeling curve, maybe already 30 years ago and the emissions data: the increase in the atmosphere was only half the emissions. Thus nature was (and still is) a net sink for human CO2 (as mass, not the original molecules!). Step by step that was confirmed by other observations: the drop in δ13C in exact ratio with human emissions, the drop in 14C from the bomb tests, the increase in DIC and decrease in pH of the ocean surface. Every observation fits in the human origin of the increase…
Every alternative I have read conflicts with one or more observations. Bart’s alternative even violates every single observation…
About the oxygen balance, the main input is fossil fuel use. That is based on fuel sales, which is quite strictly followed, due to the large influence on income taxes. Reasonably accurate, maybe somewhat underestimated due to under the counter sales… For each type of fuel the oxygen use when burned is known. Eventual semi-burned fuel (hydrocarbons, CO) are rapidly oxydised in the atmosphere to CO2.
O2 degassing / absorption by the oceans is a matter of solubility with temperature and largely known. The absorption of CO2 and release of O2 by vegetation is in a fixed ratio (1.1:1). With all these elements, one can calculate the CO2 uptake or release by vegetation based on the difference between the measured oxygen use and calculated oxygen use by fossil fuel use, with reasonable accuracy.
Anyway, that the biosphere is currently a net sink for CO2 is independently confirmed by satellites measuring chlorophyl from space: the earth is greening…
The δ13C changes opposite to the CO2 changes during the 1998-2000 episode is clearly the result of the influence of temperature on vegetation. Further investigation (the reference I had doesn’t work anymore) has shown that it was mainly in the Amazon where the largest changes were seen: large parts were drying out with forest fires on many places during the 1998 El Niño. In that year not only there was the ~3 ppmv (6 GtC) release by humans of -24 per mil δ13C, but also some 1.5 ppmv (3 GtC) release from decaying vegetation also around -24 per mil δ13C and near zero net sink, but still ~20 ppmv (~40 GtC) ocean CO2 transfer in and out at average -6.4 per mil…
The opposite happened in the following year(s) with the Amazon recovering from too high temperatures and drought, thus taking in more CO2, preferentially 12CO2 (at ~ -25.6 per mil in the current atmosphere of -8 per mil) leaving relative more 13CO2 in the atmosphere (at +10.2 per mil…) and releasing more O2…
If I have more time available than right now, I will try to make an as complete model as possible for the CO2 changes and δ13C changes together. The 1990-2003 period seems the most interesting part, as that contains the 1992 Pinatubo and 1998 El Niño…
Bart,
You haven’t understood that Jim’s graph of a constant decline in δ13C simply makes it impossible that your favorite theory: the oceans as source is true…
Occam still has some work to do before his razor is sharp enough…
It is more likely, Ferdinand, that there is a lack of imagination. There are any number of reasons that could explain why the decline is occurring. Further investigation is stymied due to a comfortable conclusion having been reached, and a resultant lack of further curiosity. As such, the conclusion becomes an ad hoc fallacy of the Just So Story genre.
Bart,
For the record, I do not agree with Ferdinand that my graph rules out your theory. It simply sets a framework of “facts” which any explanatory model must honour absolutely. So, I shall await Ferdinand’s model as and when he has the chance to prepare it (I am well aware that we all have other things to do).
Ferdinand,
A key reason for me investigating these issues in the first place was reading statements like yours that: “Step by step that was confirmed by other observations: the drop in δ13C in exact ratio with human emissions … ”.
No. What I thought I had demonstrated clearly was that the drop in δ13C is unequivocally NOT “in exact ratio with human emissions”. The average drop in δ13C is roughly half of the value that would be attributable to human emissions alone (or, for that matter, to the biosphere alone).
Jim Ross:
the drop in δ13C is unequivocally NOT “in exact ratio with human emissions”
In my opinion, a drop in δ13C which starts in about 1850, when humans starts to use fossil fuels in large quantities and follows human emissions at roughly 1/3 for its δ13C, if these would all remain in the atmosphere and roughly half human emissions as CO2 mass increase, is in (more or less) exact ratio with human emissions…
Anyway, the oceans can’t be the cause of the drop. They can be (and are) the cause of the fact that the drop is only 1/3 of theoretical.
The biosphere can’t be the cause, as that is a growing sink for CO2, based on the oxygen balance and the earth is greening, based on satellite observations…
Ferdinand,please forgive my ignorance
on what exactly do you base your assertion again that d13C is due to human fossil fuel consumption?
I mean, how does that work out in theory?
Henry,
Most carbon in the world is 12C, atomic weight 12, some 1% is 13C, atomic weight 13. And a very tiny amount is the radioactive variant 14C.
Most inorganic carbon has a 13C/12C ratio which is “neutral” according to a standard. Most organic carbon has a (much) lower 13C/12C ratio. See:
https://en.wikipedia.org/wiki/%CE%9413C
Organic carbon has passed a few biological processes when CO2 is absorbed. Biologiocal processes are quite importantly influenced by even small changes in shape, volume and weight of the reactants. That makes that the uptake of CO2 by plants prefers 12C before 13C and what is ultimately built into the plants is depleted in 13C compared to the standard
In that way it is possible to know the origin of the CO2 which is entering the atmosphere: the atmosphere is slightly depleted in 13C/12C ratio. If CO2 enters from the oceans, that would somewhat increase the ratio. If the CO2 increase is from organic material, that would firmly decrease the 13C/12C ratio… As most fossil fuels were original (land and ocean) plant rests, these have a low 13C/12C ratio too.
The 13C/12C ratio decline effectively excludes the oceans as main origin of the CO2 increase, but you can’t make a separation between fossil organics and recent organics (like wood decay), based on their 13C/12C ratio. There is an alternative way: the oxygen balance. The use of fossil fuels is known with reasonable accuracy and the oxygen use for each fuel when burned is known too. Thus the overall oxygen decline in the atmosphere from fossil fuel use can be calculated. The oxygen measurements give a slightly lower decline than calculated, thus the biosphere as a whole (land and sea plants, bacteria, molds, insects, animals…) produce more oxygen than they use. Thus the biosphere is a (small but increasing) sink for CO2 and preferentially 12CO2, leaving relative more 13CO2 in the atmosphere and thus not the cause of the 13C/12C ratio decline… The earth is greening, thanks ot more CO2 in the atmosphere and higher temperatures…
Rests human induced CO2 from fossil fuel burning as main cause of the CO2 increase and 13C/12C ratio decline…
hi Ferdinand
I don’t think you can use the depletion of oxygen as a factor in your deliberations as it is involved in a number of reactions TOA, protecting us from the sun’s most harmful rays, which is now more prevalent [during a period of lower solar activity].
If you did not know this: there never was an ozone hole. {I think} Above the oceans peroxides are formed more preferentially to ozone, doing exactly the same thing: protecting [human] life. Look at the absorption spectra of both components.
As the lower activity of the sun continues, it spews more of the most energetic particles [because of the lower polar magnetic fields] and therefore ozone, peroxides and nitrogenous oxides will continue to increase [to protect us]. I can prove this {e.g. that ozone is increasing}. That process [of protecting us] is taking away more oxygen from the atmosphere. Unfortunately it also reduces the amount of UV coming through, reducing big T on earth, as can be seen from Tmin and Tmax if anyone would care to look at it.
Anyway, at least we do agree on your final sentence:The oceans sink more CO2 than they release…
that means it is getting cooler.
that process will continue.
winter is coming.
count back exactly 86.5 years, and know where we are, when looking at the sun: 1930.
Go south, young man. Go south.
How long are we going to continue wasting resources on a bogus theory about the climate which was invented to serve ideological purposes and not scientific. We do know however that asteroids and comets will hit the earth and cause severe extinctions; and we should spend money to research how to effectively negate these threats. This is how you prove the existence of phenomena that occur over long periods and then determine the real threat associated with them.