High chance that current atmospheric GHGs commit to warmings greater than 1.5C over land
From the CENTRE FOR ECOLOGY & HYDROLOGY
Current levels of atmospheric greenhouse gas concentrations already commit the planet to air temperatures over many land regions being eventually warmed by greater than 1.5°C, according to new research published today (27 July 2016) in the journal Scientific Reports.
The results of the new study have implications for international discussions of what constitutes safe global temperature thresholds, such as 1.5°C or 2°C of warming since pre-industrial times. The expected extra warming over land will influence how we need to design some cities. It could also impact on the responses of trees and plants, and including crops.
The research was carried out by scientists from the UK’s Centre for Ecology & Hydrology and the University of Exeter, UK.
The research team found two main reasons behind the result.
First, even if it was possible to keep carbon dioxide concentrations fixed at their current 400 parts-per-million concentration levels, then the planet would continue to warm towards new equilibrium higher temperatures. At present, the climate is out of equilibrium, with the oceans drawing down very large amounts of heat from the atmosphere. However this will decline as the planet is bought towards a stable climatic state.
Second, warming rates over land are far higher than those when averaged globally which include temperatures over the oceans. This is a feature observed in meteorological measurements and reproduced across a large suite of climate models.
Lead author Dr Chris Huntingford from the Centre for Ecology & Hydrology said, “It would certainly be inappropriate to create any additional fear over climate change. However, what this paper does is re-iterate that the oceans are currently acting as a very strong sink of heat. Even if carbon dioxide was somehow stabilised at current levels, additional warming will occur as we move towards an equilibrium climate state. Furthermore, both data and computer models all indicate enhanced temperatures over land, compared to global mean warming that includes temperatures over the oceans.”
Co-author Dr Lina Mercado, Senior Lecturer in Physical Geography at the University of Exeter, said, “Our findings suggest that we are committed to land temperatures in excess of 1.5°C across many regions at present-day levels of greenhouses gases. It is therefore imperative to understand its consequences for our health, infrastructure and ecosystem services upon which we all rely.”
Dr Chris Huntingford added, “Central to our methodology is analysis of predictions made by a large number of independent climate research centres from around the world. Although many simulations exist for climate stabilisation, these tend to be at future higher greenhouse gas concentrations. We were able to scale these back to see the warming levels we are already committed to, even if present-day concentrations increased no further. Such computer models capture how the ocean heat sink would be slowly lost as a stable climate is approached, implying that temperatures would continue to increase temporarily even if greenhouse concentrations were fixed at current levels.”
###
…Curious,…why only over land ?? UHI ?
Sort of, thermal mass/capacity. Asphalt in the Sun can easily reach 140F, how warm does water get? upper 80’s?
But it’s all fallacious, The land cools off all of it’s accumulated energy nightly on average. Co2 does not measurably slow cooling on both nightly and yearly time scales.
when I lived in Labrador it was amazing how on cold clear winter nights the CO2 in the air didn’t hold heat worth a darn!
I know, right?
How does this ‘magic increase over time with the same CO2 level’ work. That’s what they are saying. God, keep these morons away from the kool aid!
“How does this ‘magic increase over time with the same CO2 level’ work.”
It isn’t magic. *IF* you buy into the theory that existing CO2 is going to raise temperature by 2.7 degrees before reaching equilibrium, *and* the Ocean is acting as a heat sink, then the rise occurs over time, not all at once. There are two reasons for this:
The Ocean has a lot of mass to absorb energy before reaching an equilibrium with the air, so even if the air is trying to warm up by 2.7 degrees the Ocean is absorbing some of the heat and the air does not rise its full amount. As the Ocean temperature rises, the air temperature eventually raises to its full amount to reach equilibrium – possibly taking many decades to do so. The Ocean delays the total rise, but does not prevent it. (This makes a LOT of assumptions about how the Ocean actually works, but this is what they mean in the simplest terms)
Second, a confounding effect is that as the Ocean temperature raises, it may release additional CO2 into the air, thus the equilibrium is pushed even further up. I say “may” because it depends on what the Ocean does overall – it could store CO2 deeper down where its cold, it could chemically react with CO2 thus storing the carbon in CO2 as carbonates, or it might release CO2 into the air – it likely will do all 3 in different amounts, so I don’t know how scientists can be so certain in their models what it is going to do.
*IF* CO2 is the main driver of climate variability, then their predictions have some low probability of being dead-on right, and a higher probability of being in the ball-park (say +/- 33% which for a 100 year prediction is pretty darn good).
If CO2 is a contributor but not the main overall driver, then their predictions are mostly worthless – climate change will continue (warmer or cooler) despite anything we do about CO2. In this case a doubling of CO2 likely causes less than 1C warming.
I have been following the Global Warming->(Morphed Into)->Climate Change debate since 1988 and I still have seen nothing to convince me CO2 is THE main driver of climate – I think it is a contributor only. I can be convinced if someone will just show me a convincing set of data to back up their theories. I will not accept anything that is tweaked and modified unless it is fully disclosed with raw data, methods, and rationale behind the changes. When I grew up this was called Science. Now it is called being irrational.
Robert of Texas,
You said,
“The Ocean has a lot of mass to absorb energy before reaching an equilibrium with the air”.
Based on the relative heat capacities, the atmosphere reaches equilibrium with the ocean, which reaches its thermal equilibrium with the Sun. Any effects of air heating the ocean is negligible, however; GHG and cloud ‘reflection’ of surface emissions that result by preventing some surface emissions from escaping to space is equivalent on a joule by joule basis to energy arriving from the Sun, both in magnitude and how fast it works. The logical fallacy is considering that these redirected surface emissions are heating the atmosphere first which then heats the surface. In fact, most of the atmosphere (the N2, O2 and Ar) has an emissivity close to 0 (optical depth near 0) across the entire LWIR spectrum, is warmed by convection of surface heat subject to a gravitationally induced lapse rate and is completely transparent to the wavelengths of photons involved in the planet’s energy balance (VIS and LWIR), however; cloud emissions are broad band Planck emissions and subject to subsequent GHG absorption and re-emission both above cloud tops and between clouds and the surface. Note that incremental GHG’s between clouds and the surface have little effect as the clouds would be absorbing most of the surface emissions anyway.
Hi Robert of Texas. It is well noted that you are sceptical of what you have been taught.
Data shows that the surfaces relationship with the atmosphere is one of energy equilibrium. There is no evidence of extra thermal energy where opacity is high. Matter is insensitive to incoherent long wave in which it is perpetually bathed. Heat transfer is about differences that can change kinetic distributions and entropy controls the direction of that exchange.
The main problem with current climatology is assuming radiative importance in the Earth’s liquid or solid surface. The necessary flux balance occurs at a mean altitude and the surface equilibrium is through the gravitationally driven lapse rate, and not influenced at all by long wave radiative exchange internally. Simple application of radiative heat transfer rules illustrates this to the open minded.
nuwurld,
The main problem is NOT considering the radiative properties of the surface as sufficiently important.
The necessary flux balance must occur at all altitudes, otherwise, different altitudes would warm or cool without bound. If you think the LTE radiant balance is altitude dependent, you are not accounting for everything or incorrectly accounting for power originating from the atmosphere itself. You should be able to enclose the radiating surface of Earth, separating it from its radiant power source with an arbitrary Gaussian surface and the integration of the LTE radiant flux crossing that boundary must be zero. It’s often misconstrued that for the planet to radiate 255K, it must be coming from the layer whose temperature is 255K. In fact, the temperature of the N2, O2 and Ar has almost no bearing on the radiant flux anywhere in the atmosphere as those gases are not contributing to the LWIR radiation leaving the planet or absorbing any VIS coming in. The energy emitted by the planet in the transparent regions of the atmosphere comes directly from the Planck radiation emitted by the surface and clouds while the energy in the absorption bands is mostly delayed surface emissions that eventually originate from GHG molecules and are added to what little surface and/or cloud radiation gets past being absorbed.
co2Isnoevil, surface emissions are around 58W/m-2 compared with in vaccuo calculations of 370W/m-2. The Earth’s liquid or solid surface emits very little radiative power. Of this limited power, only around 20W/m-2 is absorbed by the atmosphere.
Agree with most of what you have said.
Btw near zero emissivity has an optical depth (mean absorptive distance) tending towards infinity, not zero. Another fallacy of climatology is assuming that Nitrogen and Oxygen emit nothing. Near zero is not zero, which makes all matter above the surface capable of raising the effective mean radiative height above the surface and thereby increasing the surface temperature, albeit by a limited amount, through the gravitational lapse.
Mars has 5 times the CO2 that Earth’s atmosphere has but zero ‘greenhouse effect’. Our moon at Mars’ orbital distance would be 10K warmer than Mars even though the moon has no atmosphere, never mind the all so powerful CO2. Other physical properties that influence the absorptivity to emissivity ratio, and atmospheric mass and resultant pressures under gravity influence surface temperatures by a far greater extent than internal long wave heat transfer.
This is not a trick question, but please, if you would, what is the mean temperature of the Earth by your own understanding? How do you rationalise your answer?
nuworld,
Optical depth is -lnT, where T is the transmittance. In the LWIR, the transmittance of an atmosphere containing only N2, O2 and Ar is approximately 1, that is, everything that goes in one end comes out of the other, and the log of 1 is zero.
Also, I do not accept your statement that the surface only emits 58 W/m^2. Even Trenberth agrees that the BB emissions from the surface are about 385 W/m^2. Whatever instrument you think measured only 58 W/m^2 is definitely broken.
The definition of the average EQUIVALENT temperature of a body exhibiting a temperature profile is the temperature whose ideal BB emissions are the same as the average emissions of that body integrated across its surface and normalized to its area. It turns out that when this is applied to small regions of the surface, the result is quite close to the near surface temperatures measured by thermometers, and tracks differences even better, thus when averaged over the planet’s emitting surface, the average EQUIVALENT temperature of that surface is completely representative of the average emissions of that surface.
Water does not absorb infra red radiation to greater than 25 microns and immediately emits it according to the linked article. It plays no part in the alleged CO2 warming. The energy is not hiding in the oceans, Those asserting such should describe the physical means of accomplishing that instead of just stating it. Science require proof. Just making the claim that the heat is hiding in the oceans without detailing how it is accomplished is unscientific.
http://www.warwickhughes.com/blog/?p=87
John
co2isnoevil. Hi thanks for the reply.
Nitrogen and oxygen ARE directly heated by incoming solar radiation in absorption bands that are largely locked out of equipartition at Earth’s temperatures. All interacting matter radiates some energy, otherwise nitrogen in isolation would heat up far beyond Earth’s temperatures! At the point of collision two N2 molecules represent a quadrupole and the outer electron repulsion is a perturbation of the near field negative charge density which can result in a spontaneous far field emission. All meta stable thermal states have a none zero probability of decay.
Long wave heat transfer is intensity driven and the 58W/m-2 upward flux from the surface (not 385) is arrived at by line by line subtraction of opposing monochromatic radiative potentials, where at each and every quantum line, Kirchhoff’s Law is applied. This is integrated over the entire spectrum and over all solid angles and yields the radiative loss from the surface in W/m-2. That’s around 17% of the 341W/m-2 incoming solar, and around one sixth of the in vaccuo radiative potential. Massive radiative fluxes never leave the surface nor do massive fluxes come back down. The ‘instrument’ used is every physical thing that emits radiation from the lower troposphere, and the fact that only around 8% of the atmosphere’s energy comes from surface long wave! Massive fluxes never leave the surface.
Optical depth has strange terminology. If something is optically thin, then we can see into it to a large depth. The mean free path is long. The sample is viewable with considerable thickness.
If something is optically thick, then the absorption depth is small, and the mean free path for absorption only allows a small (thin!!) outer layer of the sample to be observed!
I agree with your analysis from the mathematical definition, but worded it is full of contradiction!
nuwurld,
You are confusing measurements at the boundary between the surface and atmosphere with measurements from within the atmosphere itself. The emissions of the surface at the boundary between the surface and atmosphere, that is, before line by line analysis is even relevant, is indeed a nearly ideal Planck spectrum emitting 385 W/m^2 at an average EQUIVALENT temperature of 287K. A question you must ask yourself is what would the surface emit if there was no atmosphere and why would adding a layer of atmosphere between the surface and space effect the emissions at the boundary between the surface and atmosphere given the same average surface temperature?
Also, the heating of O2/N2 by absorption of higher energy photons from the Sun does indeed happen, but the magnitude of this effect is small and is in fact already rolled in to the effective albedo.
When you do the line by line analysis for the clear sky, almost 50% of the energy emitted by the surface goes directly to space and the remainder is captured by GHG’s. In cloudy skies, this asymptotically approaches 0% as the cloud optical depth (despite its name) approaches infinity and cloud absorption of surface emissions approaches 100%
The amount of cooling off depends on how much good-old H2O is in the air at the time. The present of monsoon humidity on the Southwest deserts adds at least 10F degrees to the night time temperatures. Early morning humidity jumps from 20% to over 50% during monsoon season.. It also limits the max temperature by a much smaller amount.
Yes, and Co2 does not seem to make a difference, see how much it cools at night in a desert.
But the water is also a non-linear regulator of cooling rates, and that is completely independent from Co2 as well.
co2isnotevil.
You are confusing radiative potential with heat transfer. Please give one example of anywhere near 385W/m-2 being emitted and absorbed by surfaces at or near 287K. That’s any example from anywhere. Ever wondered why ‘radiators’ are convection heaters? Ever wondered why all industrial coolers use methods other than radiation at low temperatures? The processor in your computer will not use radiation to cool. It will use conduction and forced convection. Yet still you have faith that massive undetectable and unavailable for ‘work or power’ fluxes exist.
Direct thermalisation of incoming solar is never part of albedo. Reflection and scattering are non thermal processes but absorption of solar energy is part of Earth’s energy budget.
You have said,
“When you do the line by line analysis for the clear sky, almost 50% of the energy emitted by the surface goes directly to space and the remainder is captured by GHG’s.”
No it doesn’t, the atmosphere is hardly heated at all by long wave from the surface, because all horizontal components cancel and over spectral bands with high opacity the lack of a thermal gradient kills the heat transferred.
The atmosphere is heated mainly by latent heat transfer from the surface and by direct absorption of incoming solar. It’s total emittance then is a product of other mechanisms. The surface emits around 58W/m-2 as an average as shown by using two back to back pyre-geometers vertically arranged. This gives the total energy lost by the surface. Only a fraction of this becomes atmospheric energy because of the atmospheric window.
The vertical thermal profile of measured tropospheres exhibit no sign of modification by long wave heat transfer.
You seem to place far too much importance upon surface radiative emissions.
I agree.
This not so much, an 85F surface under a -20F Tsky is ~260W/m-2. Now yes you need to add what? a total of 38 W/m-2 for Co2, that’s ~.33F, so the surface emits 222W/m-2.
The surface radiatively doesn’t care about air temps, only the surface it radiates to, and pointed straight up on a clear day that surface is cold. (actually the surface isn’t a uniform temperature, so these rates are higher than I quoted)
Hi micro6500.
I believe you are thinking about ‘photons’ from your answer, and in doing so you believe that an unstoppable stream of photons that ‘do not care’ are emitted from all matter above zero Kelvin. (Please don’t use Fahrenheit as all temperatures have to be absolute to be of value).
Here is something to think about.
A 10W laser is used in conjunction with a Michelson interferometer. The semi-silvered mirror splits the beam into two equal 5W beams. The adjustable path is then set to half a wavelength such that the two beams (of photons? Carrying energy?) arrive 180deg out of phase and cancel on the target.
The target is as if illuminated and heated by by the room only under these conditions. Block either path and the target is illuminated by the 5W beam remaining.
Where does the 10W go when destructive interference occurs?
There is only one answer.
nuworld,
It’s really quite simple. Photons are EM energy and since EM energy consists of equal and opposite parts acting against each other (+q vs -q, N vs S and E vs B), complete phase cancellation is theoretically possible, but not practically because of this little thing called time. Photons exist simultaneously across a small region of space and a small amount of time, corresponding to its wavelength and period, but to shift half of one beam 180 degrees means to advance or retard it in time relative to the other, thus they will not cancel across both space and time, but will sum into an interference pattern containing the original amount of power. This is why interference patterns exhibit both light and dark bands.
So, when I did my work with stripline attenuators, we changed the impedance of the stripline creating a reflection, then reflected some of the input into a dummy load.
There is no dummy load, and what that would have done is created a standing wave (SWR), and it is effective dissipated in the source, so that’s my answer, I think you’ll find the laser 10W’s warmer. Purely idiots guess (since educated doesn’t really fit).
co2isnotevil. The interferometer can be accurately adjusted with a piezoelectric crystal to give no bright bands at the target.
co2isnotevil. Perhaps you would like to elucidate why climatology considers Watt per Watt or joule per joule (to quote you) how the solar averaged flux over the Earth’s surface at 168W/m-2 which is available to focus and condense to create temperatures to 5800K, is available to directly heat matter by spontaneous process, can be used to produce photovoltaic energy and produce chemical changes like photosynthesis, but is dwarfed in ‘energy’ terms by downwelling long wave at 340W/m-2 which is unavailable for work or power or any spontaneous physical change?
How can solar be less than this ‘nothing’?
co2isnotevil, when you speak of ‘time’ wrt ‘photons’ exacted how much time does the photon experience travelling at light speed. How fast does the external clock tick?
nuwurd,
You should already know that time doesn’t pass in the photons time frame relative to ours, at least according to special relativity. Time itself doesn’t really even exist for the photon from within its own reference frame, nor does space, at least as we understand space.
The average solar flux heating the surface is about 240 W/m^2. You must consider energy absorbed by clouds as contributing to the radiance heating the surface of the Earth since clouds are tightly coupled to the oceans via the hydro cycle and about 3/4 of the planets radiating surface is ocean. Notice how this differs from Venus where its clouds and surface are completely decoupled thermodynamic systems. The planet wide emissions and incident energy are the 2 most directly measured attributes by weather satellites and these values are well known and established. Give the warmists some credit as they do have a few things right.
Wherever you got 340 W/m^2 of ‘down welling LWIR’, it’s absolutely wrong (probably Trenberth). There is about 240 W/m^2 equivalent visible radiation and only about 145 W/m^2 of downwelling IR to add to the average of 240 W/m^2 from the Sun to offset the average 385 W/m^2 emitted by the planet whose EQUIVALENT temperature is about 287K. What goes up as the latent heat of evaporation returns to the surface as liquid water heated as vapor condenses on it before falling as rain. What goes up as thermals comes down as down drafts. Whatever effect the cycle of latent heat up, rain down and vertical circulations has, its already accounted for by the LTE average temperature of the surface and its consequential emissions. And BTW, we do tap some of what you are calling ‘downwelling’ as hydroelectric power. To capture the power of the surface heat this generates, you also need a source of cold which makes it difficult. IR solar cells are theoretically possible, but to capture a tiny fraction of a couple of hundred W/m^2 of IR returning from GHG’s and clouds is hardly worth it. It’s barely worth it to capture a small fraction of the peak noon summer time solar power of about 800 W/m^2, reaching to near 1300 W/m^2 at the equator.
micro6500. Thanks for the reply. Spot on. Under these conditions the energy never leaves the laser (surface). In line by line analysis the surface net losses are arrived at by looking at each and every spectral line over the continuum such that the radiative potential for each can be simply subtracted as radiation is a vector quantity. The only energy that leaves the warmer surface is the ‘difference’ in intensity at each monochromatic line.
This calculation has to be repeated for all angles available to the radiating surface which attempts to radiate over 2π steradians. Intensities are purely temperature dependent for LTE where absorption resonances are a fully normalised part of equipartition, and less than Planck levels for non saturated bands ie those bands whose energies are not very compatible in terms of eigenvalues with the kinetic distribution.
For high opacity bands the only driver of heat transfer is temperature, and over short mean free paths no sustainable temperature difference exists so very little heat is transferred. Also all horizontal vector components cancel (4/6 of all directions in space) as no horizontal gradient exists over mean free paths except the horizontal is a tangent for a surface on a sphere. Near horizontal atmospheric paths always have high opacity and therefore similar intensity to the emitter and kill heat transfer. All that is left is the vertical components near to the surface normal which are in the atmosphere’s transmission band and can ‘see’ short atmospheric paths. Couple this with average global cloud cover and the net radiative losses from the surface, the ‘only’ energy lost by radiation from the surface, is around 58W/m-2 on average.
https://goo.gl/images/5v6HLE
17% of the incoming 340W/m-2 is 57.8W/m-2
The 5% long wave that contributes to the atmosphere’s energy is 17W/m-2 from a surface radiative potential of 385W/m-2!!!!!! ( actually 370W/m-2 as ε=0.95 is significant ).
co2isnotevil. Thanks again for the reply.
Yep em radiation from matter fills space and does not appreciate time or distance. The overlapping fields from matter carry information about the surrounding world, but not necessarily energy.
You have said,
“Wherever you got 340 W/m^2 of ‘down welling LWIR’, it’s absolutely wrong (probably Trenberth).”
Well, to quote you again,
“The necessary flux balance must occur at all altitudes, otherwise, different altitudes would warm or cool without bound.”
Perfectly true. That’s where the 58W/m-2 comes from and your 385W/m-2 generates from ‘thin air’ (sorry about that) a requirement for 325W/m-2 downward flux to balance to zero!!!!
The globally averaged solar flux is (all in W/m-2) 340×0.71 (post albedo) minus 78.2 (atmospheric absorption), which gives 163W/m-2 input solar to the surface.
That’s the total real energy input.
Latent heat transfer coupled with convection transfers as moist convection 102W/m-2 from the surface to the atmosphere. Evaporative losses and condensation heating at 2230J/g transferred.
The only flux value left to balance fluxes to zero at this Gaussian surface is the difference of around 60W/m-2 (163-102) which is left to radiation and calculable from line by line analysis to a similar value.
If you think 385W/m-2 goes up then 325W/m-2 must come back down to balance the surface fluxes.
1) Half of the temperature change occured before 1945 which is when we more than tripled CO2 production. Why they choose 1.5C and 1800 is non-sensical since half cannot be attributed to man. Presumably it’s harder to get people worked up over 0.75C then 1.5C. Oh 0.75C the world will end seems a tad sensational whereas apparantly 1.5C seems like a scarier number. But for anyone who thinks about it one should wonder if temps went up 0.75C before we started pumping CO2 could it be the other 0.75 has nothing to do with CO2 or little to do? Also, there is this well known thing since 1650 or so the Earth has been recovering from the little ice age. I still think they should stick to after 1945 because before 1945 brings up these other questions that confuse people but I guess 0.75 just doesn’t sound scary enough.
2) They have no basis to say anything is locked in. The comment ” the oceans are currently acting as a very strong sink of heat” also brings up a nasty problem with this theory. They didn’t know this heat sink would happen, no model predicted it, they don’t know what caused it, what is happening or why it is happening or when it will stop or if it will stop. They actually don’t know if the heat in the deep ocean has anything to do with CO2. They simply assume it does. They didn’t know 10 years ago that there are 1000 times as many deep sea fissures as we know now. They didn’t know that movement of the glaciers would affect the opening and closing of fissures as we know now or that simple things like the mooon or other planet orbit fluctuations can change the fissures. In short we know precious little about the ocean prior to 15 years ago which is reflected in their collective ignorance of their models and formulas about ocean dynamics.
Please check out my blog: https://logiclogiclogic.wordpress.com/category/climate-change
In short there is NO WAY they could say that there is any “Locked in” anything from 1800 or 1945 or any point. Anything they say at this point is speculation because by their own admission their theory didn’t understand and still doesn’t understand a major factor that is blowing all their predictions out of the water.
Because humans live on land, and it’s “all their fault.”
Didn’t you know that?” 🙂
If we lived in the sea, we would be melting the ice and endangering
all those large fluffy white quadrupeds.
If the land and/or oceans responded as slowly to change as they need in order to support any significant ‘future’ effects from current conditions, the planet would respond too slowly for us to notice any difference between day and night, or for that matter, summer and winter. The AVERAGE temperature of the global oceans varies by about 2C during a year. The N hemisphere oceans vary by nearly 6C from winter to summer and globally, are only partly offset by a 4C change in the S hemisphere. Where does all this heat hide in the N winter ?
Surely, if the average ocean temperature can swing up and down by 2C in 12 months (including land, the swing is even greater and per hemisphere is much larger), the planet responds fast enough to change that nearly all the effect of all CO2 ever emitted is already accounted for, except for the equivalent of less than 1/2 the final effect from all new emissions in the last 12 months.
Wonder where they think the heat is being hidden today. If someone proves that them maybe I will listen. Joann’s favorite question!
and weren’t the ocean temperatures all “made warmer ” by ignoring the accurate buoy measurements and basing everything on the highly inaccurate ( but conveniently warmer ) intake valve temperatures ??
co2isnotevil. Thanks again for the reply.
Yep em radiation from matter fills space and does not appreciate time or distance. The overlapping fields from matter carry information about the surrounding world, but not necessarily energy.
You have said,
“Wherever you got 340 W/m^2 of ‘down welling LWIR’, it’s absolutely wrong (probably Trenberth).”
Well, to quote you again,
“The necessary flux balance must occur at all altitudes, otherwise, different altitudes would warm or cool without bound.”
Perfectly true. That’s where the 58W/m-2 comes from and your 385W/m-2 generates from ‘thin air’ (sorry about that) a requirement for 325W/m-2 downward flux to balance to zero!!!!
The globally averaged solar flux is (all in W/m-2) 340×0.71 (post albedo) minus 78.2 (atmospheric absorption), which gives 163W/m-2 input solar to the surface.
That’s the total real energy input.
Latent heat transfer coupled with convection transfers as moist convection 102W/m-2 from the surface to the atmosphere. Evaporative losses and condensation heating at 2230J/g transferred.
The only flux value left to balance fluxes to zero at this Gaussian surface is the difference of around 60W/m-2 (163-102) which is left to radiation and calculable from line by line analysis to a similar value.
If you think 385W/m-2 goes up then 325W/m-2 must come back down to balance the surface fluxes.
[dupe? .mod]
Oh, look – another “ignore all of our previous failed predictions, we’ve discovered some new science that shows things are going to be even worse than that” press release.
What equilibrium are they talking there? Are they highly delusional? It cannot be a thermodynamic equilibrium, for obvious reasons. It cannot be even a dynamical equilibrium, for some similar reasons but probably harder to understand by some. I would really like to see their definition of ‘equilibrium’, seems to be a highly equivocated one and possible undefined.
Exactly …the climate is out of equilibrium?
“At present, the climate is out of equilibrium, with the oceans drawing down very large amounts of heat from the atmosphere. However this will decline as the planet is bought towards a stable climatic state.”
and what does a “stable climatic state” look like? (whether or not it can be bought)
“very large amounts of heat”, is that a scientific quantity?
“… warming rates over land are far higher than those when averaged globally which include temperatures over the oceans.”
And I can refine that even more with:
warming rates over pavement are far higher than global averages which include temperatures over glacial ice
Good one, Tom. I immediately noticed the words, “a stable climatic state.” Are these people living on planet Earth?
Tom,
I believe the oceans absorb heat from the sun not “very large amounts of heat from the atmosphere”, which has a low heat capacity compared to water. Surely, the authors’ statement is incorrect.
TOA will not be in equilibrium, the length of day changes through out the year, and the northern hemisphere’s surface is not symmetrical with the southern hemisphere, so on a daily basis, it will never be in equilibrium.
This is what I was thinking when I read the paper because I seem to recall (although I may be wrong here) Dr. Richard Lindzen stating once that the planet is never in equilibrium…..that it only tends toward equilibrium. Correct?
https://wattsupwiththat.com/2010/04/09/lindzen-earth-is-never-in-equilibrium/
..1) ” At present, the climate is out of equilibrium, with the oceans drawing down very large amounts of heat from the atmosphere….”
..2) ” Second, warming rates over land are far higher than those when averaged globally which include temperatures over the oceans….”
…Isn’t this a contradiction ?
obviously not…..
In climate science you can model something you do not understand at all….and come up with a prediciton that you are sure is right…
One word, ENTROPY!!
Enthalpy actually.
Micro65 – I think you’ve got a cause and effect issue there. Since temperature sets a limit on how much water air can hold, temperature is the control knob on dew point. Other than that limit, temperature does not dictate how much water is actually in the air. And though certainly water vapor is a greenhouse gas, your chart does not show that water vapor is a “control knob” on temperature. You can be in Arizona in 95 degree weather and have virtually no moisture in the air, while be in Nebraska in the summer and walk outside in 95 degree weather and think you’re breathing water.
But the water itself is carrying heat from the tropics.
I started wondering why 2 clear days, 3 days apart could have a different in max temp of 15 to 20F. The solar forcing didn’t appreciably change, weather was the same. What was different was where the air came from (tropics or Canada ), and how much moisture it carried.
I also found that at night it cools quickly until air temps get near dew points, which limits cooling of this carried water vapor. And the water doesn’t cool as fast as the air carrying it.
So no, cause and effect are not backwards.
micro6500 July 27, 2016 at 9:17 am
ShrNfr is correct it is enthalpy that matters. You are using the wrong units to measure heat. Temperature is the wrong metric – you cannot ‘trap temperature’. You should be measuring atmospheric heat in kilojoules per kilogram you will find that all the ‘warming’ claims suddenly become baseless and wet and dry lapse rates make more sense.
,,My understanding is, that as “global ” land temperatures increase, the Oceans become less of a heat sink, so how could they be gaining heat as it gets hotter ? Time difference ?
Where do these guys come up with this stuff??? CO2 produces NO HEAT .. and therefore whatever eventual temperature that the atmosphere attains will be a function of incomming, stored, and outgoing energy. The only relevant storage capacity on earth resides in the ocean, and I don’t see any empiric data indicating that the ocean is going to heat the atmosphere by an additional 1.5C.
This all goes back to the flawed way in which models handle incomming energy. TSI at the top of the atmosphere is not the same as SW reaching the surface, which accounts for over 99% of ocean heating. If SW reaching the surface decreases, the temp will drop, regardless of the increase in CO2.
Dr. Deanster. Who says that CO2 produces heat? I think that this claim is only in your head. Nobody among those in favor of AGW theory claim that CO2 produces heat. CO2 acts like insulation in a house. If you increase insulation in cold climate, there will warmer inside, if the heat input remains constant as well the outside temperature (the Sun has almost constant heating capacity).
The right question is: How much the increased CO2 concentration increases the global warming i.e. what is the rightr value of climate sensitivity. Do you know any other research result than that of Myhre & al.? I do not know and I think it is wrong. I have also scientific results and not only my opinion.
..If CO2 caused any warming, REAL Green Houses, with 8,000 PPM CO2, would be raging inferno’s !
CO2 is a gas. It expands when heated. No?
Insulation is a solid.
Is it not true that CO2 absorbs LWIR at a certain wavelength; thermalizes; expands; rises and re-emits at all LWIR wavelengths?[or most].
Thus, any weak “down-welling” lwir is overwhelmed [jammed like radio signals] by the constant higher powered LWIR from earth.
No measurable heating of the atmosphere occurs and the CO2 acts more like a coolant than an insulator. IMO.
Edmonton Al July 27, 2016 at 9:17 am
CO2 is a gas. It expands when heated. No?
Insulation is a solid.
My windows use Argon gas as an insulator.
Is it not true that CO2 absorbs LWIR at a certain wavelength; thermalizes; expands; rises and re-emits at all LWIR wavelengths?[or most].
No, that is not true.
Marcus …
https://www.hydrofarm.com/resources/articles/co2_enrichment.php
“CO2 acts like insulation in a house.”
RUBBISH !!
Since the Earth has been warming since the minimum temperature of the last glacial period, and similar interglacial periods were warmer than it is now, that it will _eventually_ warm 1.5 degrees is probably a pretty safe bet, with or without anthropogenic warming. It’s probably true, and completely beside the point.
And unstoppable! And beneficial! Even the IPCC says so!
I am sick of climate science, the data sets show (for better or worse) 1.2 so these fn geniuses say 1.5, the same morons were saying much more a mere few years ago.
Junk junk junk sick of it. This is not science. I’m done
When more rain, more rain is the projection, less rain, they project less rain, 1.2c they project 1.5c
Linear pseudo think, I am sick of it.
I have never before seen such large-scale corruption in science. I hope I never see it again. But in the menatime, these sick puppies have to be removed from the scientific arena, and the ones to do it are the established genuine scientists. The ones who have for several decades kept their traps shut in spite of very extensive and convincing evidence – from Climategate onwards, and perhaps even earlier.
Unfortunately, while good men do nothing, evil prevails.
Let’s reiterate and focus…
Apparently we don’t even need to look at any real data or real physics anymore in the area climate science. Who knew?
What climate science predictions have been accurate so far… zero.
Garbage.
e’nuff said.
They take current assessments and add a bit and go in that direction, moronic nonsense
They can dress this cack up as science all they want. It rubbish
The collection or morons when we get to 1.2 assume 1,5 and then make up science to support it. JUNK
It’s nothing but betting on the winner of a marathon as runners enter the final straight
Its akin to betting on who wins a marathon as runners enter the final straight, then they make their “science” match the situation and will all pat themselves on the back
I am tired of this pseudo science nonsense based on models tuned to give them what they want
Rant over
Claims of committed warming on a decadal scale can be easily dismissed by the existence of the Pause. The accumulation of committed warming since CO2 emissions started to increase in the 1950’s would make a long period of little or no warming extremely unlikely. On the other hand it should cause an acceleration of the warming that has not been observed. If there’s any committed warming it has to be very little as to show no discernible effect.
“reproduced across a large suite of climate models.”
gigo. Post modern science.
That all have the same fundamental equations at their heart, how they treat CO2 is the same.
The gigo assessment is appropriate…”Central to our methodology is analysis of predictions made by a large number of independent climate research centres from around the world. “…in other words, they took the models that have been dis-proven, modified them, and appended additional modeling. Oh my. This would not pass muster in a junior high science fair.
I just don’t know how my region is going to cope with another degree of Celsius warming. It really scares me. As it is, in my region, every year, from January to July, we rise from -10 degrees C to +27 degrees C. A rise of 37 degrees C every freaking year. That extra one degree C rise is going to kill us all in my region. Should I beg the UN to do something for us?
My poor kids were playing outside yesterday morning. Then the climate changed in the afternoon and they had to stay inside. But it’s back to normal today!
Smile!
Demand ‘Thermal Safe Spaces’ for everyone!
Oh good. More “the heat is hiding in the deep oceans” nonsense. That never gets old.
Heat is due to Cthulhu. It is true because all of my models say that it is so.
“First, even if it was possible to keep carbon dioxide concentrations fixed at their current 400 parts-per-million concentration levels, then the planet would continue to warm towards new equilibrium higher temperatures. ”
But it isn’t possible. There is no correlation between our emissions and the rate of change of CO2 in the atmosphere (Salby, Munshi). Basically, as I see it, even with the huge increase in human CO2 emissions they are so small in comparison to the natural emissions that we can’t detect them in the record of atmospheric concentration.
Unless this changes all the arm waving and demands for control of the climate are so much sound and fury signifying nothing.
Not true. Quite nicely since 1956 in average 55 % of human fossil fuel emissions have stayed in the atmosphere and the rest has disappeared to somewhere.
How is that possible when the residence time for CO2 is less than 30 years? How can we tell that the increased CO2 in the atmosphere is ours and not naturally emitted?
The point is that we have almost no control over atmospheric CO2 content and it hasn’t changed global temps for about 20 years so all the admonitions that we must control the climate by reducing our emissions are meaningless.
DMA asks:
And the answer is, to wit:
The CAGW secret they don’t want you to know.
There is a nasty ole Anthropogenic Global Warming secret about CO2 that the proponents of CAGW are not telling you. Surprise, surprise, there are actually two (2) different isotopic types of CO2.
There is both a naturally occurring CO2 molecule and a hybrid CO2 molecule that has a different physical property. The new hybrid CO2 molecule contains an H-pyron which permits one to distinguish it from the naturally occurring CO2 molecules.
The H-pyron or Human-pyron is only attached to and/or can only be detected in CO2 molecules that have been created as a result of human activity. Said H-pyron has a Specific Heat Capacity of one (1) GWC or 1 Global Warming Calorie that is equal to 69 x 10 -37th kJ/kg K or something close to that or maybe farther away.
Thus, said H-pyron is very important to all Climate Scientists that are avid proponents of CO2 causing Anthropogenic Global Warming (CAGW) because it provides them a quasi-scientific “fact” that serves two (2) important functions:
1) it permits said climate scientists to calculate an estimated percentage of atmospheric CO2 that is “human caused” …….
and 2) it permits said climate scientists to calculate their desired “degree increase” in Average Global Temperatures that are directly attributed to human activity.
As an added note, oftentimes one may hear said climate scientists refer to those two (2) types of CO2 as “urban CO2” and ”rural CO2” because everyone knows “it is always hotter in the city”.
And there you have it folks, the rest of the story, their secret scientific tool has been revealed to you.
Yours truly, Eritas Fubar
aveollila on July 27, 2016 at 9:38 am
Not true. Quite nicely since 1956 in average 55 % of human fossil fuel emissions have stayed in the atmosphere and the rest has disappeared to somewhere.
_______________________________________
Needless to add since 1956 in average 55% of reindeers and polar bears exhaled CO2 has stayed in the atmosphere and the rest has disappeared to somewhere.
Nick’s right. Plus, I seem to remember reading that CO2 has a signature isotope, and that the satellites have been measuring an increase in the proportion of CO2 in the air with that particular isotope.
“There is no correlation between our emissions and the rate of change of CO2 in the atmosphere (Salby, Munshi).”

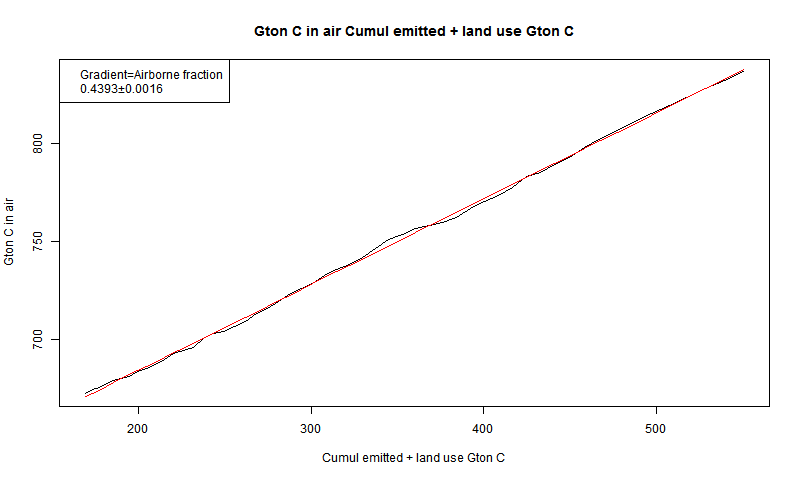
Just untrue. Here is a plot of cumulative emissions vs mass of C in air over time:
And here is a plot of mass C as a function of cumulative emissions. Very high correlation:
The only problem is that you cannot measure the heating. I think I saw the word “model” in the paper. That is all I need to know.
Any idiot that said there is “C” in the atmosphere , isn’t worth even talking to.
WHAT A LOAD OF RUBBISH !!
Do another graph with the rate of growth of co2 by year and the change in temperature by year. In spite of constant increase in anthro co2, the growth of co2 follows temperature. All the way back to 1960. Your analysis is wrong.
Rishrac said:
Yup, but not the near-surface temperature of the atmosphere, to wit:
http://i1019.photobucket.com/albums/af315/SamC_40/1979-2013UAHsatelliteglobalaveragetemperatures.png
“Your analysis is wrong.”
My analysis said nothing about temperature. The claim was that there is no correlation between CO2 emissions and CO2 in the air. I showed how wrong that was.
Samuel you are overlaying the the total of co2 not the growth per year. The growth per year follows temperature. Temperature controls co2.
Rishrac, said:
Rishrac, ….. GIMME A BREAK, ….. the yearly increase (growth rate) in atmospheric CO2, …. from May 1979 to May 2013, ….. is specifically plotted on the above graph via those little black “stars” that appear from the lower-left corner of the graph to its upper-right corner..
And the month of May atmospheric CO2 ppm quantity is plotted thereon because the yearly maximum CO2 ppm occurs 98% of the time in mid-May of each calendar year, See KC graph below ….. or NOAA’s complete monthly average Mona Loa CO2 ppm data via the url link cited below.
And “YES”, temperature does control the outgassing/ingassing of CO2 into and out-of the atmosphere.
And the bi-yearly (seasonal) near-surface air temperatures are only a “bit player” in the aforesaid outgassing/ingassing of atmospheric CO2. And I say that because there is NO “near-surface-air-temperature” signature ….to be found anywhere on the above posted graphic ……. OR …. to be found anywhere within the 58 years of the Mauna Loa atmospheric CO2 ppm Record, …. which you can check for yourself, @ur momisugly to wit: ftp://aftp.cmdl.noaa.gov/products/trends/co2/co2_mm_mlo.txt
The temperature of the ocean surface water(s) is/are the primary driver of atmospheric CO2 ppm, …… both the bi-yearly cycling of average 6 ppm …….. and the yearly increase of average 2 ppm, …. as denoted on this modified copy of a Keeling Curve Graph, …. to wit:
http://i1019.photobucket.com/albums/af315/SamC_40/keelingcurve.gif
And the above are “plain and simple” scientific facts that one should not be averting their eyes and their mind away from recognizing as factual proofs and evidence.
Cheers
That annual cycle, just for reference looks a lot like the day to day change in temp in the northern hemisphere
The day to day change in F, for either the US or Northern Hemisphere with multiple years superimposed on each other.
And ps, Rishrac, …. don’t respond with that “junk science” claim that it is …. “the greening of the Northern Hemisphere that is responsible for the 6 ppm average bi-yearly ‘summertime’ decrease in atmospheric CO2” …….. because that claim is a biological impossibility.
No finer example of confirmation bias than this conversation…. plot this my graph won’t load.. I’m giving you 25 years of numbers from NOAA. I have at least 50 years. If you would like more Ill provide it. All your graphs prove is that it is warmer and co2 has increased. Breaking the yearly co2 increase in growth associated with temp, there is no reason for a decline in ppm over several years in spite of increased anthro co2 as predicted by AGW. Temperature definitely controls co2.
year co2 temp C
1970 1.06 0.07
1971 0.85 -0.03
1972 1.69 0.06
1973 1.22 0.19
1974 0.78 -0.05
1975 1.13 0.02
1976 0.84 -0.07
1977 2.10 0.18
1978 1.30 0.10
1979 1.75 0.19
1980 1.73 0.23
1981 1.43 0.27
1982 0.96 0.16
1983 2.13 0.32
1984 1.36 0.13
1985 1.25 0.11
1986 1.48 0.20
1987 2.29 0.33
1988 2.13 0.35
1989 1.32 0.27
1990 1.19 0.41
1991 0.99 0.38
1992 0.48 0.24
1993 1.40 0.27
1994 1.91 0.33
1995 1.99 0.45
This is basic.. overlying this is solar activity that influences cosmic ray activity which also has an effect on co2 and/or temperature . Whether it has an effect on temperature is unknown at this point. A case can be made for purely solar and cosmic ray and co2 levels as well. There isn’t a well documented record of TSI, but it looks like small changes in TSI cause small change in temperature. You can’t see this unless you plot it. The solar signal is an inverse where declines or increase in cosmic ray are definitely influencing co2 levels in addition to temperature. Its not a mistake. !962 and 1963 are case points for cosmic ray influences on co2. This path has opened a Pandora’s box of questions. You aren’t doing any real research, you are cutting and pasting. … You know what scares me more than knowing something….. not knowing.
It’s a multi variable calculus problem.
If it can be believe that it takes about 12 billion metric tons of co2 with about half that gets sunk, 6 bmt net, With constant production upwards, it makes no sense that we could loose from 1987 to 1992 about 21.7 bmt in the difference { (2.29 – 0.48) * 12 = 21.7 bmt } 1987 and 1992. And declines of 2.4, 1.4, 9.6, and 2.0 bmt for each year lost from respective years 1988 thru 1991. Do you understand what I’m saying? Production didn’t decline. If you are saying that carbon has a +/- of 0.5 Gct. error range, then then numbers get even more dramatic because the change in temperature and co2 is, lets say, actual.
It’s worse for them than this, the step in 97-98 happened in only 2 area’s weather stations, and they happened at different times, 20-30 N Latitude the temp in the US went up first, and then it went up in Europe. And it went up because the wind changed where all the water vapor was blown to.
If I can get the chart up, everyone will see that temperature controls co2. And if somebody else gets it up, that’s ok.
And micro6500 —- replied:
Yup, except for the fact that “the day to day change in temp in the northern hemisphere” is nigh onto being 180 degrees out-of-phase with the day-to-day change in atmospheric CO2 ppm.
Iffen you could find a similar graph that depicts “the day to day change in temp of the ocean surface waters in the southern hemisphere” …. then I am confident that it would be exactly in phase or sync with the afore noted (CO2) “annual cycle” depiction.
The ocean surface area is far GREATER in the Southern Hemisphere than it is in the Northern Hemisphere ….. and thus the bi-yearly (equinox seasonal) ingassing/outgassing of CO2 is far greater in the SH, …… and thus the reason atmospheric CO2 ppm decreases during the SH winter (NH summer) ….. and increases during the SH summer (NH winter).
Samuel, I know the surface temperature is the opposite sign, I just never made the pretty picture. It’s also not as well measured, so there more “weather” in the signal. How far south is Hawaii ? If it’s in the tropics, the signal from the other hemisphere starts getting added with it, at the equator it’s a sine wave with two periods 8n stead of one as the extra tropics have. This is why I don’t take the seasonal slope or cs in the tropics, the amplitude of the signal is far smaller than for the extra tropics.
So sayith: rishrac – July 29, 2016 at 9:19 am
Well now, rishrac, …. even iffen I look “cross-eyed” at your …… “25 years of numbers from NOAA”, ….. I was still unable to see any correlation, association, insinuation or potentiation between your posted figures of “year co2” and “temp C” from one year to the next …. or any year to any other year.
For example, to wit:
“DUH”, please explain the dramatic difference between year 1972 and 1976.
To wit: 1.69 CO2 per 0.06T ….. verses …… 0.84 CO2 per 0.07T
Or year 73’ and year 75’, to wit: 1.22 per 0.19T ….. verses …. 1.13 per 0.02T
Richrac askist:
Actually, …. “Yes”, I do.
You are saying (mimicking) a lot of different things about the subject of “natural science” in general and/or about “climate science” in particular that you are severely miseducated therein ….. in a futile attempt on your part to preserve and/or justify your religious beliefs about CAGW (CO2 caused Anthropogenic Global Warming Climate Change).
Richrac, I earned my Degrees in both the Physical and Biological Sciences … so don’t be blowing “junk science” smoke in my direction, ….. OK.
micro6500 asks: “How far south is Hawaii”?
Mauna Loa, Hawaii is north of the Equator and is located precisely at latitude 19.4721° N ….. and longitude 155.5922° W.
But why did you ask that question given the fact that Mauna Loa, Hawaii has nothing whatsoever to do with the measuring and/or recording of near-surface air temperatures?
Because I take the slope of the change in temperature as it changes from March to September and then September to March, and have a well defined solar input over the same period, so I can measure the efficiency of that solar for each surface station, climate sensitivity to solar.
And since the sun zigzag over the equator twice a year, that method will not work, and I’ve not worked out a good solution yet.
And micro6500, therein is your problem.
Using temperature data obtained via those “surface stations” will not aid you one iota in your quest to determine “the slope of the change in equinox seasonal surface temperatures”.
But now iffen all those “surface stations” had always been using “liquid immersed” thermometers for measuring and recording near-surface air temperatures you might have better luck in determining your “slope of change” quest.
For the extra-tropics, it’s a nice strong signal. Individually they have weather, but spatially weather averages out.
Nick’s right. Plus, I seem to remember reading that CO2 has a signature isotope, and that the satellites have been measuring an increase in the proportion of CO2 in the air with that particular isotope.
Of course Nick is right…
http://cdiac.ornl.gov/trends/co2/iso-sio/iso-sio.html
“The 13C isotope is stable and heavier than the normal form of carbon (12C), and plants tend to selectively assimilate the lighter isotopes during the photosynthetic process. This results in the following features of the 13C/12C ratio in the atmosphere: (1) a seasonal cycle occurs with the heavier isotope at relatively high concentrations during the summer, as plants selectively remove the lighter isotope from the atmosphere, and (2) a general decrease with time, as more fossil carbon (which originally was plant material, and consequently biased toward the lighter isotope) is injected into the atmosphere from the combustion of fossil fuels. Additionally, about 95% of fossil-fuel carbon emissions are from the Northern Hemisphere, and there is a 6-12 month time lag before this material is transported by the atmosphere to the various stations in the Southern Hemisphere. The seasonal cycle reverses and its amplitude decreases in the Southern Hemisphere, where the seasons are opposite those in the Northern Hemisphere and there is much less land area to support a terrestrial biosphere.”
http://cdiac.ornl.gov/trends/co2/iso-sio/graphics/isomlogr.jpg
Kurt said:
Shur nuff, Kurt , and me thinks that signature isotype is called the H-pyron isotope.
For details about that isotope ….. see the above post @ur momisugly https://wattsupwiththat.com/2016/07/27/claim-ghgs-have-us-committed-to-greater-than-1-5c/comment-page-1/#comment-2266794
More researcher bafflegab and mystical mumbo jumbo.
A) By their own models, the Paris accord fails utterly.
B) This represents a double triple quad quintuple down position using the models.
• a) Erroneous models? Focus on modeled numbers and shout loudly.
• b) Formerly claim 3°C – 6°C increases, settle for 1.5°C;, maybe no one will notice.
C) Obviously there is some groveling going on for dwindling green dollars. Bringing out the drama queens performing their versions of CAGW death scenes.
Clearly much more research money is needed by these guys
I will go on record once again by saying not only will global temperatures going forward will not rise any higher then they currently are but they will be falling and this fall should last for decades.
Mass of the Atmosphere: ~5.1×10^18 kg
Specific heat of air: ~1.0 KJ/Kg
Specific heat of water: ~4.2KJ/Kg
Mass of the oceans: ~1.35 x 10^21Kg
The oceans hold about 1,000 times as much heat energy as the atmosphere does. The oceans are the dog, and the atmosphere is the tip of its tail. No matter what the CO2 content of the atmosphere is, the climate will be controlled by the energy content of the oceans. The atmosphere is driven to equilibrium with the oceans, not the other way round. Given the disparity in mass and heat content, almost all of the oceans energy content is supplied by direct solar radiation, not conduction from air.
The impact of the CO2 content of the atmosphere, no matter what the sensitivity of the atmospheric temperature to it is, on the heat contnet of the oceans is close to nothing.
It is not a measurable amount and therefore a convenient fantasy of the warmist agenda. Much like ocean acidification, it is the opposite of science
Still the GH phenomenon is true and it controls the surface temperature of the Earth. Or in which way the surface temperature stays in the present about 15 C degrees? The time constant of the mixing layer of the ocean is about 3 months and it means that it comes to a new balance state in one year only, if the energy balance of the Earth has changed permanently.
I don’t think the GH is real. Throughout production of co2 has been upward. If you overlay the co2 record of growth with the increase in temperature it is easy to see that temperature controls co2. Co2 increases decrease with temperature despite increasing amounts produced. It is not random or variability. Further another player is solar activity and the inter play of cosmic rays.
Anybody that looks at this will see that if it gets cold enough, for any length of time, there will be no increase in co2. 1992 is a good example, temperature declined 0.3 K. Co2 increased only 0.48 ppm that year down half of 1991 and a 4 fold drop from 1987 which was 2.29 ppm. 1987 was an el nino year and a solar min as was 1998. Peak to peak values 2.29 to 2.93 over 11 years. The pattern is fairly consistent until very recently when the sun went quite. The current el nino happened on time, however the longer solar cycle has us going into a min instead of climbing into a max.
You can also get a good overlay of the solar cycle with cosmic rays and co2 growth.
I am interested to see which one has a greater affect, temperature or solar activity in the next couple of years, provided that the sun does a repeat and stays quite for an extended period of time. A volcano could alter those results, but only confirm what happened with Mount Pinatubo.
While some of these things are clear, that does not mean I have a complete idea of how this is actually working. I am, however, fairly certain co2 does not control temperature. No scientist in their right mind would say for certain when all of the conditions are not known.
“Still the GH phenomenon is true and it controls the surface temperature of the Earth.”
Not if the oceans have anything to say about it. And they are the 1000 lbs. gorilla in this picture.
“The time constant of the mixing layer of the ocean is about 3 months”
Surface layer mixing is irrelevant to atmospheric temperatures. The Ocean heats and cools air by evaporation.
The average Enthalpy over 75.6million station records from 1940 to 2015 is 38kJ/kg at daily max temp, and drops ~10kJ/kg that night to the next days min temp.
Cooling rates can easily be over 4F/hour under clear skies, but drops to under 1F/hour later in the night due to temps approaching dew points. Any warming from Co2 would be lost during the high cooling rate early in the night, because the reduction of cooling is due to a drop in temperature, so any temperature change from Co2 would have to be gone before cooling rates slow.
Then climate sensitivity to SW is < ~0.02F outside the tropics.
If Co2 is as efficient as SW at warming, how much of a temperature increase does that make from Co2 that has to be cooling at the high cooling rate portion of the nightly cooling cycle?
Less than 0.1F
should be:
SW is < ~0.02F/Whr outside the tropics.
The more I read my own comment, the more disturbed I get. I am not a “climate scientist”, and I have never seen an explanation of the the internals of the GCMs that the “climate scientists” use to make their divinations and to say sooth.
Do the GCMs account for the heating of the oceans?
Do any of you know?
Bueller? Bueller? Bueller?
The models say the warming is coming, and the models have never been wrong.
Coffee sprayed on screen, thanks a lot Bruce!
Tom, you really need to work on your drinking problem. 🙂
Let’s take the “worst case scenario” and assume that their predictions about temperature come true.
This is a good thing!
All the gloom and doom prophecies come from broken computer models.
Walt,
This was going to be my comment as well. If they are right then night time temperatures in the arctic and subarctic zones will rise about 8F while everywhere else will see very little change. This means that the Canadian Prairie will be able to produce more crops with a longer growing season. The same would be true for the Siberian territory in Russia. The world would be able to more easily feed itself under such a scenario without much if any negatives at all. No money would be needed for adaption at all!
Cooler over the sea than over the land! Oceans acting as heat sinks! Climate will reach equilibrium??
Eminent PhD’s??? Permanent Head Damage, I suspect!
BS = Bull Sh*t
MS = More Sh*t
PhD = Piled Higher and Deeper
Why do they constantly publish stuff like this. When it doesn’t happen, they can’t be found. And others just keep coming up with new things that might, just might happen. Do they realize its been almost 20 years now when they first went off the deep end, and we had to do something drastic then because by now there would be millions upon millions of climate refugees and untold suffering 5 years ago that never happened? How many stories have been reported on Whats Up that have the words could or might and have actually happened? The average is zero. We can guess about something we truly don’t know, like black holes in space, and have a better record.
In any world, the current state of climate science is very strange.
I agree, it’s weird. You’d have thought they’d have backed away from this nonsense years ago. My guess is that they honestly don’t realize that the masses are waking up and getting angry at being given endless guilt-trips over nothing at all – and being charged hefty fees for it, all while the anti-human criticism continues and the doom-and-gloom keeps rolling in. People are fed up with it. More and more are getting angry at being lied to. It’s these “scientists” with these panic-stories who will be held accountable. They don’t realize that either by the looks of things. I sometimes think it’s going to need a mob on the doorstep to wake them up!
Your air conditioner is more evil than ISIS… for example. Do know why Bernie Maddof is in jail? To keep him from being lynched. There were people openly calling for him to be publicly executed in Central Park by hanging.
http://m.phys.org/news/2016-07-high-chance-current-atmospheric-greenhouse.html