UAH V6 Global Temperature Update for March, 2016: +0.73 deg. C
by Roy W. Spencer, Ph. D.
The Version 6.0 global average lower tropospheric temperature (LT) anomaly for March, 2016 is +0.73 deg. C, down a little from the February record-setting value of +0.83 deg. C (click for full size version). This makes March 2016 the warmest March in the satellite record (since 1979), and statistically tied with April 1998 for the second warmest month.
![UAH_LT_1979_thru_March_2016_v6-1[1]](https://wattsupwiththat.files.wordpress.com/2016/04/uah_lt_1979_thru_march_2016_v6-11.jpg?quality=83)
The global, hemispheric, and tropical LT anomalies from the 30-year (1981-2010) average for the last 15 months are:
YEAR MO GLOBE NHEM. SHEM. TROPICS
2015 01 +0.30 +0.44 +0.15 +0.13
2015 02 +0.19 +0.34 +0.04 -0.07
2015 03 +0.18 +0.28 +0.07 +0.04
2015 04 +0.09 +0.19 -0.01 +0.08
2015 05 +0.27 +0.34 +0.20 +0.27
2015 06 +0.31 +0.38 +0.25 +0.46
2015 07 +0.16 +0.29 +0.03 +0.48
2015 08 +0.25 +0.20 +0.30 +0.53
2015 09 +0.23 +0.30 +0.16 +0.55
2015 10 +0.41 +0.63 +0.20 +0.53
2015 11 +0.33 +0.44 +0.22 +0.52
2015 12 +0.45 +0.53 +0.37 +0.61
2016 01 +0.54 +0.69 +0.39 +0.84
2016 02 +0.83 +1.17 +0.50 +0.99
2016 03 +0.73 +0.94 +0.52 +1.09
I suspect that February and March represent peak El Nino warmth in the lower troposphere, and the rest of the year will see cooling. Whether 2016 ends up being a record warm year will depend upon just how fast global temperatures fall as La Nina approaches, now forecast for late summer or early fall.
The “official” UAH global image for March, 2016 should be available in the next several days here.
NOTE: This is the twelfth monthly update with our new Version 6.0 dataset. Differences versus the old Version 5.6 dataset are discussed here. Note we are now at “beta5” for Version 6, and the paper describing the methodology is in peer review.
The new Version 6 files (use the ones labeled “beta5”) should be updated soon, and are located here:
Lower Troposphere: http://vortex.nsstc.uah.edu/data/msu/v6.0beta/tlt
Mid-Troposphere: http://vortex.nsstc.uah.edu/data/msu/v6.0beta/tmt
Tropopause: http://vortex.nsstc.uah.edu/data/msu/v6.0beta/ttp
Lower Stratosphere: http://vortex.nsstc.uah.edu/data/msu/v6.0beta/tls
Added by Anthony
Dr.Ryan Maue on Twitter reports this about the surface temperature record.
March 2016 temperature anomaly +0.63°C [Feb 2016 was +0.70°C & YTD now 0.64°C]

fascinating! thanks as usual Dr. Spencer. Will be interesting to see if we start to fall next month…and, if so, how far?
Is this going to be the start of the cooling, where the ocean burped up it’s supercharged heat? We’ll see.
Shucks; just when we thought we had a good run of superlative Temperature (anomalies) going, somebody has to go and publish a diminutive runt of an anomaly.
Aren’t the measurements supposed to conform at least roughly to the models, to be valid ??
G
Anyway, I’m glad it is Dr. Roy (and Prof. Christy) who claim that, because anybody else is low credibility.
As most of the statistical ‘warming’ took place in the Arctic and Siberia in February it got there in the form of water vapour carried from the oceans by the wind.
Now bearing in mind that the ‘warming’ was in the range of MINUS 30 to rising to a balmy MINUS 15˚C in these regions you would have to ask yourself what happened to all that water vapour when it got to the polar regions?
Greenland seems to be trending above its mean rate of ice gain, and I suspect that there’s a lot more snow around in Asia and Canada. That should keep things cool for a while!
Lots of warming in central north Africa too, according to Ryan’s chart. Probably not much snow there though.
DWR54
Well l doubt there was a lot of snow in north Africa during the ice age. But that did not stop the climate from getting colder.
Dew?
This is where the extra snow buildup comes from in Greenland….http://earth.nullschool.net/#current/wind/surface/level/overlay=total_cloud_water/orthographic=-38.70,60.27,1348
When a warm moist surface wind is pushed into Greenland, then you can bet that the next day DMI page will show an increase in the snow pack.
charles if you google “Arctic sea ice graphs” it gives you lots of useful info all on one page.
Warm and dry in Western Canada this winter and Spring is early. Not sure about the North and I think Eastern Canada is mostly fairly average snowfall for the winter as I believe they were very mild in the first half with some major storms from Christmas on. Weather (as opposed to climate) is extremely variable in the West. We had winters like this in the 80’s and I suspect the 30’s were similar. Our all time high was 47C in1937.
Snow doesn’t keep anything cool. Places that already are cool keep snow !!
Ahhh now I get it “since 1979” I should have known when our BOM said warmest march on record.
And what if we go back to 1900 and don’t use fudged (homogenised) data ?
We seem to be in an era where if today is hotter than yesterday it’s proving that Co2 is causing warming !
Go back to 1900 and use honest data??? Are you mad? How can we keep the CO2 scare story alive if you do that?
by using adjustments? they do this already now 🙂
Robert, when they call something the “warmest March in the satellite record”, they are using all of the existing satellite data – which only started in 1979. How are you going to find satellite data back to 1900?
If you want honest data back to before 1900, from thermometers – not from IR brightness readings – you can take your pick of Japan Meteorological Agency back to 1891, NASA or NOAA data back to 1880, or the Hadley/CRU data back to 1850. All of them show the warmest years in their records have been since 1998. More to the point, they all show the most recent decades have been consecutively the warmest in the record, and the 2010s are well along in continuing that trend.
Here’s Japan’s: http://ds.data.jma.go.jp/tcc/tcc/products/gwp/temp/ann_wld.html
But if you want satellite, it’s UAH or RSS. RSS hasn’t released their March figures yet, but like UAH, they showed February to be a record high TLT since satellite records began in 1979.
http://images.remss.com/msu/msu_time_series.html
Heave Ho, and away we go, back to normal again. Thank you for your diligence Dr. Spencer. We follow your every word on these matters.
‘Back to normal’ as in 0.21C warmer than any previous March in the satellite record?
It certainly was pretty cold here in upstate NY last month and this month, April, is opening with blizzards coming in and daytime highs below freezing. So much for ‘early spring’.
Sadly, we are still 2 to 9 C short of a Climatic Optimum…
https://en.wikipedia.org/wiki/Holocene_climatic_optimum
El Nino IS normal. And 0.21 degrees is a statistically small fluctuation in 35 years, not inconsistent with the conjectured hiatus or small rise in TLT.
Pretty short record. I sure wouldn’t read much into it. It’s a statistic, not a temp. Won’t melt ice anywhere.
Just don’t now how we cope with a whole 0.21C of extra warmth. Not that I could tell since I can’t actually measure 21 hundredths of a degree on my thermometer. My part of the UK has seen what I would say was a below average March but then there is reality and the Met Office’s dataset.
Roy, thanks for the timely update. A minor nitpick, but I’m guessing that March 2016 is statistically tied with April 1998 for the second highest temperature anomaly, rather than temperature (since globally April is typically higher in temperature than March and thus if the anomalies are the same, then the April 1998 temperature will be higher than the March 2016 temperature).
Here’s how the 2015-2016 trend compares with 1997-1998:
It will be interesting to see what happens the next several months.
Oz:
But is the trend as plotted for 97/98 using the same version of UAH (V6.0), as I presume is 15/16?
Are we comparing apples with apples?
Why don’t you check for yourself?
Incapable?
“Why don’t you check for yourself?
Incapable?”
Quite capable – but thanks for asking.
However unless I trawl through Roy’s data-set and plot the graphs, it is a tad tricky because the OP has not included any attribution.
“Quite capable – but thanks for asking.”
Then why haven’t you?
Seems you are not !.
excuses excuses..
Toneb, the graph shows UAH V6b5 for both periods shown. I also have a graph of the NOAA MEI values that has not yet been updated for March which shows that MEI values were higher at the beginning of 2015 than at the beginning of 1997, which could explain much of the higher global temperature anomalies at that time: https://oz4caster.wordpress.com/enso/
yes, you are right.
Astonishing number of similar inflection points. Based on your analysis, we predict a month 17 uptick, no?
gymnosperm, every El Niño event is different so I would not necessarily expect an uptick in April. The evidence I see in SST anomaly data suggests that this event may end a bit quicker than the 1997-98 event. Regardless, there will likely be some random ups and downs that are easily in the noise range of uncertainty of the estimates. I will be most interested to see the strength of the following La Niña and if there seems to be another baseline rise in global temperature as has happened after most other large El Niños in the satellite era. The latter question may take a several years to verify but we should know about the La Niña by next year.
oz, I was assuming you drew the inflection point connections. If not you, then I will boldly predict some April uptick based on the pattern. Wish I had time to dig up 1983.
TLT is not often used as a nino gauge. More often TLS for its dramatic spikes. The pattern seems way too close to be chance.
gymnosperm, the 1982-83 El Niño event was very intense, but its effect on global temperature was delayed an muted by the El Chichón eruption in early 1982 that had lingering effects into 1983.
True, but I’m still stuck on those inflection points. Some day I’ll have the time to see if 1983 also shows them.
This may be another nitpick, but Dr. Spencer said “Whether 2016 ends up being a record warm year will depend upon just how fast global temperatures fall as La Nina approaches, now forecast for late summer or early fall.”
BOM and NOAA March assessments each put chances of La Niña at 50% at best, so all that can be said with confidence is that ENSO-neutral conditions approach.
BOM: “While some criteria have been met for a La Niña WATCH, model outlooks are evenly split between ENSO neutral and La Niña by the end of winter. With model skill generally low at this time of year, the situation will be monitored closely over the next few weeks as we enter the traditional ENSO transition period.”
http://www.bom.gov.au/climate/enso/tracker/
NOAA: “While there is both model and physical support for La Niña following a strong El Niño, considerable uncertainty remains. A transition to ENSO-neutral is likely during late Northern Hemisphere spring or early summer 2016, with close to a 50 percent chance for La Niña conditions to develop by the fall”
http://www.cpc.ncep.noaa.gov/products/analysis_monitoring/enso_advisory/ensodisc.html
The Dr.Ryan Maue map is a cylindrical projection which tends to exaggerate the areas at an increasing rate as one moves N and S away from the equator.
(That comment is just in case there are any kiddies watching).
but since its a constant background since the late 1970s, it is simply a measurement that is consistent with itself. In other words, using that projection, the number is the number against the same projection over the past 35 years, and hence the warmest march on that projections record. I make this clear with all my tweets and posts, that I am using that record against itself. 5 of last 6 months warmest on record, according to that projection. So its apples against apples and hence is accurate.
Lets quite denying for now the earth is frying ( but not for long) We expected this, but also the fall coming as the la nina is coming on. Consequently the projection used will show that, as it did before
Nevertheless, the projection amplifies the the red in excess of true area. It would do the same with blue were that the case.
The important question is why is it just the Arctic? Enso is a SOUTHERN oscillation.
We have an opportunity to actually learn something here rather than ram the information into half baked preconceptions.
“The warmest on record” is a matter of fractions of a degree when diurnal variation is always two and sometimes three orders of magnitude greater, and it is gauged, by chance, from a starting point that was a natural oscillatory nadir.
+0.73C nominal is frying, will not be seen as cooliing at -0.73C come 2017, by some
I strongly agree with gymnosperm that a more complete study of this phenomena is important. The el nino/la Nina cycles are manifestations of the earth’s heat transport system and potentially a window into so much that the models have incorrect. Additionally, these weather events directly affect the agricultural areas of North America and thus the world’s food apply. There would be huge benefits to a better understanding of these patterns and improved predictability.
understandable,
Lets quite denying for now the earth is frying ( but not for long)
-> Lets quit denying
Thanks – Hans
Good post. It looks like the same pattern as the last major El Nino.
“I suspect that February and March represent peak El Nino warmth in the lower troposphere, and the rest of the year will see cooling.”
Indeed. Cooling is already underway. Feb HadSST3 and OHC were down from Jan, and UAH is now down from Feb.
“Whether 2016 ends up being a record warm year will depend upon just how fast global temperatures fall as La Nina approaches, now forecast for late summer or early fall.”
2016 WILL NOT be a record warmth year, because TSI in 2016 won’t support it this year like it did last year, the highest TSI year since 2002.
http://climate4you.com/images/TSI%20LASP%20Since2003.gif
The SC24 TSI spike last Feb/March kicked off the El Nino. TSI then dropped in 2015 until the fall, then went back up pre-winter, peaking in November, keeping temps up through this February, as TSI was still high enough. That has all changed.
F10.7cm solar radio flux was at 82 sfu today, March averaged less than 92 sfu/day, much less than the SWPC “low” forecast of 97, and next 45 days F10.7cm is expected by the USAF to only average 82 sfu/day, the same as it is today! This month TSI is dropping along with the F10.7 flux, and I think it is the reason why March ended cooler than February. TSI will not be reaching 2015 levels this year. Not a chance.
http://lasp.colorado.edu/data/sorce/total_solar_irradiance_plots/images/tim_level3_tsi_24hour_3month_640x480.png
There’s much more evidence in support of this view, to be discussed at a later date.
Bob:
“2016 WILL NOT be a record warmth year, because TSI in 2016 won’t support it”
OK, and let me be generous here.
Taking an ave TSI of 1361.2 for this year, and of 1361.5 for 2002 (0.3W/m2 and 0.075 W/m2 at TOA) we have a % diff of 0.001.
And that’s going to stop 2016 being a record warmth year?
Really?
That’s not how you do things with TSI to get real results. It’s that kind of thinking that’s kept people from progressing in climate science, and I don’t blame you for it at all. You’re just a victim of it.
The first thing is to find out is what is “enough” TSI to warm the earth, and then to figure out what happens when there’s more than enough or not enough TSI for warming. If I’ve lost you, I’m not surprised – and don’t take it personally. My solar article is coming out soon, somewhere, when you can find out all about it.
Challengers to this idea would need to have a more potent attribution source of energy than solar variation. Do you know of one? If so, where is the evidence, data, and the logic that makes it work?
Bob:
“Challengers to this idea would need to have a more potent attribution source of energy than solar variation. Do you know of one? If so, where is the evidence, data, and the logic that makes it work?2
No, of course you are correct – ALL energy (bar neg geo) comes from the Sun.
However you neglect the important part of it having to leave to space at the same rate it is absorbed by the climate system.
The back-radiating properties of atmospheric GHG’s is the biggest attentuator of that.
What back radiation properties.
CO2 does not re-emit below about 11km.
AndyG55 April 2, 2016 at 1:27 am says:
CO2 does not re-emit below about 11km.
I am inclined to believe you but can you refer me to evidence of the claim?
http://s19.postimg.org/6bv57dpo3/stratospheric_cooling.jpg
Roger, look up the difference between temperature and heat. Then look at what happens radiation emission at higher colder altitudes. 🙂
Bob, there just isn’t a solar cycle imprint in the numbers. This is as close as I can get to modelling where you would see a solar cycle (the residual temperatures after taking out the ENSO, AMO, Volcanoes, and the CO2 warming trend) and it is not really there.
http://s21.postimg.org/o2xv3wwxz/UAH_RSS_Residual_vs_Solar_Cycle_Mar16.png
Now there is room for the Sun having an impact over many decades. The solar cycle changes are too small and too short-lived to have the impact.
But, let’s say the Sun ramped up over several decades; let’s say by 0.6 Watts/m2 from 1918 to 1950 (which it actually did). The extra energy received by the Earth (is actually a small number when you include 30% Albedo and divide by 4 because the Earth is a sphere) but it could accumulate at something like 0.3 X 10^22 joules/year (which is a reasonable figure for how much the Sun’s extra wattage could accumulate in the Earth system – this is more-or-less as much as one could expect).
Over several decades, this accumulation rate would add about 0.4C to 0.5C to the Earth’s average surface temperature, maybe 0.2C to the deep ocean temperatures. Viola, that is more-or-less what happened and it would be a good analogy for the Maunder Minimum and the Little Ice Age. One would see something like 0.8C of cooling in a Maunder Minimum scenario.
Now you have some realistic physics theory and numbers to work with.
Andy, The Clough graphic shows areas where radiation is escaping to space and causing cooling in 10 to the minus 3 degrees according to the LBLRTM. CO2 is back radiating at the surface as evidenced by instruments looking up. They see the surface blackbody temperature in CO2 bands as departure from a higher altitude (cooler) background.
The amazing thing is that CO2 extinguishes all the OLR in its fundamental bending bands within a few meters of the surface. That’s why you see the slot in those bands from near the surface to the tropopause in the graphic. They begin to register again weakly at about 5km, I suspect from kinetic interaction with near IR activated water. The CO2 bands begin to radiate strongly at the tropopause, I believe due to kinetic interaction with solar energised ozone, and continue to do so to the mesosphere at the top of the graphic. They appear to be still going strong even as the lapse rate goes negative again at the stratopause.
Bill Illis says “Now you have some realistic physics theory and numbers to work with.”
Thanks Bill. You’re going right where I am with your thinking, except for using the Lean/Kopp solar cycle impact method, which I think doesn’t get to heart of the matter.
Solar energy accumulates in the oceans during high TSI periods. SSTs are very sensitive to TSI. Both ideas can be discerned in the image below.
http://climate4you.com/images/SunspotsMonthlySIDC%20and%20HadSST3%20GlobalMonthlyTempSince1960%20WithSunspotPeriodNumber.gif
Study this image closely and see how SSTs rise during each solar max, only to fall again during the subsequent minimum, whereafter there’s always an ENSO at the start of the next cycle, which I think is an albedo effect. Notice the many instances of direct correspondence of SSTs to solar activity spikes.
I used this image as a basis to determine that SSTs either warm or cool at an solar radio flux (F10.7cm) level of ~120 sfu/day at medium to long term scales.
Ocean heat content is measured in joules. Solar flux units, ‘sfu’, are related to joules: SFU = 10^4 Joule = 10−22 Wm−2Hz−1. When F10.7cm rises above 120 sfu, more joules than necessary to keep SSTs flat are pumped into the ocean, and it warms (OHC increases). The converse is also true, ie, when F10.7 is below 120, SSTs cool.
http://www.nodc.noaa.gov/OC5/3M_HEAT_CONTENT/heat_content55-07.png
I extended the method to TSI and get great results daily. The earth warms and cools when TSI either is higher than ~1361.25, or lower, respectively. 1361.25 is the SORCE TSI statistical equivalent to 120 sfu in F10.7cm.
That’s what I mean when I rhetorically ask ‘is TSI high enough for warming’? If someone can’t get even that far in their thinking they won’t get anywhere, as has been the case until now.
Bill, thanks for your input, and as you will probably see, your thinking does line up with mine. I also go back to the Maunder in my analysis, applying the solar sensitivity and accumulation principles just discussed.
We WILL all be on the same page together on this because the data supports it. After I show my work, everyone can then confidently follow along in real-time to see the Sun’s real daily influence on the Earth.
“The amazing thing is that CO2 extinguishes all the OLR in its fundamental bending bands within a few meters of the surface.”
Yes, it absorbs to extinction within about 10m of the surface in it 15μM band
Convection and conduction “rule” within this part of atmosphere, so there is no warming from this CO2 energy absorption.
As we see, it doesn’t really start re-emitting until the tropopause, almost certainly because below that height all energy is transferred to other atoms and dealt with by the normal convective processes.
Only once the atmospheric density decreases enough to reduce major energy loses by collision/conduction does the CO2 get a chance to re-emit.
Bob Weber, anyone with undergrad level statistical acumen would have subjected your two variables to significance testing (I assume you could use a simple t-test since you have one independent variable and one dependent variable with lots and lots of data. Since this is your theory and you propose we, “Study this image closely and see how SSTs rise during each solar max, only to fall again during the subsequent minimum, whereafter there’s always an ENSO at the start of the next cycle, which I think is an albedo effect. Notice the many instances of direct correspondence of SSTs to solar activity spikes…”, I am assuming you put it through a significance test, which would include all points along the graph, not selective points. Did you? Which kind? And what was the result?
If you did not subject your data to such a test, you are attempting to get people to “Study this bottle of snake oil…” and should be called on it.
I do not sell snake oil. Being just a smart aleck will only get you so far Pamela.
You haven’t even demonstrated that it is that – you’re like a narcissistic abuser just throwing around unsubstantiated insults – I think they call that ‘gaslighting’. I see enough of that in politics and science and here and I’m sick of it. I don’t deserve that and nothing I said remotely resembles snake oil.
When did you even seriously critique what I said here earlier in my previous comments?
People often ask me questions here after I post what I consider to be the bare minimal info needed to make a point, and while I’ve reticent to spill all the beans at once w/o my graphic support, I do respond to questions even from warmists (and I try to be nice to them) and tell people what I do a little bit at a time. Since nature just keeps on giving, every month there’s new data, every month there’s always more to talk about, and I’m not going to keep quite about it. Why? It’s very exciting for Penelope and I to watch my science grow and be confirmed daily. I try to pass that enthusiasm on because it’s real.
Pamela, the first thing that must be done is investigation, then discovery, then modelling, testing, and finally publishing. I basically have gone through the first four steps – testing my own way – comparing to what nature actually did wrt the underlying principles I’ve established through the research, thinking my way through as an engineer and following the energy, ending up in this place now where I’m going to open it up to others for I hope honest and forthright evaluation.
You will be in better position to offer good constructive criticism after seeing what I’ve produced. I expect multiple lines of testing methods can be applied to it, and will be by others, and myself. I expect that you might possibly identify something I should be aware of – hey, after participating here for a few years, no one gets away scot-free, LOL!
So many times, a paper is just about a simple, single discovery. My work is different. There are multiple discoveries and lines of evidence wrt the effects of variable TSI and IMF, and each of them has it’s own support in the data.
Statistics? I used scatterplots to investigate several relationships, and then produced a good R value from a few correlations. I expect the statistically-oriented will find all kinds of ways to analyze my findings. That’s good. I’m not worried about that. I encourage it. There’s always more to learn.
Bob, and when you do publish, you might want to call it “The Last Leif Falling: Global Cooling in the Near Future”…
The actual figure for the average difference for the comparable 15 months is just under +0.25C. This corresponds to 1.38 degrees per century.
I do not believe that is a fair comparison since apparently all of 2015 at one time would have been an official El Nino, but missed out when one of the numbers was downgraded from a 0.5 to 0.4. See:
http://www.cpc.noaa.gov/products/analysis_monitoring/ensostuff/ensoyears.shtml
However using the numbers in the above site, the average for 1997 was 1.04, but the average for 2015 was 1.26.
As a result, I feel that a comparison for January to March of 1998 versus 2016 is more meaningful.
The January to March average in 1998 was 0.536.
The January to March average in 2016 was 0.702.
This is a difference of 0.166 C over 18 years or 0.922 C per century.
The utter stupidity of taking a 15 month period, and stating it as a per century rate……. says all !!
The difference of the current El Nino’s satellite-measured global tempefature from that of 1997-1998 seems to me as mostly less than .25 degree C, and the difference seems to me as slight majority in favor of decreasing as the months of the current El Nino go on. I think April 2016 will probably register as cooler than April 1998, and the whole year 2016 will be in a close race with 1998, maybe beating 1998 by .1-.15 degree C (maybe less) according to UAH TLT v.6.0 and RSS TLT v. 3.4. I am even uncertain that 2016 will win this race.
And this week in Antarctica, it is going to be -55 F and it is still Autumn there, not even winter yet. And the NYT has a big story about how Antarctica is melting fast and we are all going to drown.
The melting is taking place around the periphery of the continent via warmer sub-surface waters on the undersides of grounded ice sheets.
The surface air temp has no bearing.
Toneb, the melting is from the Southern Ocean which is cooling? The warmer sub-surface temperatures is coming from sub-sea volcanic vents?
The melting is occurring in models of models based on models. There is no data in any of the reports.
But it makes a really bad science fiction movie (my apologies to those three people in the world who thought “Water World” was a good movie!)
So when the periphery melts the ice extent becomes greater? Wow! This really is complicated. Can you explain that for me toneb?
Lee:
I said “sub-surface” waters are warming.
The surface layers are indeed pretty static, maybe cooling, but melted ice is less saline and would be buoyant. You need to consider the thermodynamics of the oceans re the thermocline/halocline
And no it’s not because the “The warmer sub-surface temperatures is coming from sub-sea volcanic vents?”
I note the ? BTW.
That would be evident in convection currents in the ocean and geothermal is …
From:
https://en.wikipedia.org/wiki/Earth%27s_internal_heat_budget
“Earth’s internal heat powers most geological processes and drives plate tectonics.[2] Despite its geological significance, this heat energy coming from Earth’s interior is actually only 0.03% of Earth’s total energy budget at the surface, which is dominated by 173,000 TW of incoming solar radiation.
Toneb, “From:
https://en.wikipedia.org/wiki/Earth%27s_internal_heat_budget”
‘This page was last modified on 13 March 2016, at 09:11.’
You rely in wiki?
Am expecting a sharp drop in temps during April.
Over the next two weeks areas of high pressure look to be forming over the NE Pacific/NW USA. Leading to out brakes of cold air pushing down across NE USA. Also over the northern Atlantic areas of high pressure will tend to push colder air down across europe. Across the NH there looks like there be lot of air mass movement between the Arctic and the warmer south. Which will help to keep the Polar jet strong. Plus there seems to be a rapid cooling of the nino1+2 and 3 areas of the Pacific in the 7 day forecast.
Likely too fast there is a lag and April should be near the warmest on record, though not as warm as Feb or March. You must compare month against month ( April vs April not April vs March as due to seasons different months have different warmest ever) The April number to beat I believe is .434C against NCEP records and that looks very likely to me
Yes it was a large drop in the graph above was what l meant.
Its a nice graph showing a steady average temp increase over 36 years as well showing up the 18 year hiatus diversion trick.
Eeeeeek everybody! WFT says the earth’s temperature has increased over 36 YEARS!!!
…that’s it then…it’s just going to keep increasing…we’re doooooomed!
Well make up your collective mind guys, is it cooling/, warming or is there a hiatus ?. Or maybe the global scientific community know what theyr’e talking about and your’e stuck in amateur world ?.
WTF
Or maybe the global scientific community know what theyr’e talking about
I’m sure they do. Per my comment at 11:23, if they could just make up their mind what that is and all get on the same page so the rest of us know what it is they are talking about….
“Well make up your collective mind guys, is it cooling/, warming or is there a hiatus ?. Or maybe the global scientific community know what they’re talking about and you’re stuck in amateur world ?.”
The question that you pose, is it cooling, warming, or holding steady, depends on time frame and data quality. If one were looking for a real answer rather than looking through observation bias or outright cooking-the-books then we would first admit that one number (average worldwide temperature) is not even possible and would be meaningless if we could find it. But if we continue anyway, we would see that there is nothing going on but a recovery from The Little Ice Age which was a brutally cold period of time that all humanity should be glad is long gone.
I would also point out that there are many people who post here and who comment here who are not amateurs. But since Einstein worked for the patent office when he shook physics to its foundation, being an amateur is not disqualifying in science now is it?.
Without going so far as to violate site policy, I will state that we are in a natural climatic period of time and that CO2 from man (or any other source) has nothing to do with climate. (perhaps a very slight cooling impact) Only a complete idiot or a totally deluded person, or one whose paycheck comes from the CO2 scam would believe that CO2 is the driver of climate. (it is not even a backseat driver)
I am a fan of global warming. I hope it comes and melts all the ice, but I am afraid that our interglacial has reached its old age and we should be hoping that we do not see cooling. When it comes the cooling will kill billions more than likely.
Markstoval. “one number (average worldwide temperature) is not even possible and would be meaningless if we could find it. But if we continue anyway, we would see that there is nothing going on but a recovery from The Little Ice Age ”
Are you saying that it is sensible to discuss whether the world is warming or not? Either “one number” has some meaning or it does not. If it does not then it is meaningless to discuss whether warming has occurred.*
To clarify your position, you believe the globe is warming but it is because of “recovery” from LIA. The rise in temperature has nothing to do with CO2, but you acknowledge that the rise is continuing and has not stopped.
Whatever the reason for the warming, it must have a cause. Where does the energy causing the rise come from?
*I don’t see why it is a meaningless concept. It is like a house with many rooms. The temperature of all the rooms may go up and down, but the concept of the “average” temperature of the house is meaningful, although clearly not the only important number.
Nonono. Showing accelerating surge in temperatures, showing without doubt the glaciers will drown New York in 40 years ending in 2026. And the North Pole is already ice free since 2000/2013. And superstorms and criminals loom over devastated islands left from the UK.
Its a nice graph showing a steady ZERO TREND interrupted by an El Nino peak.
Andy,
Nice cherry picking, look at the post indusrtial trend
You mean since the LIA, or from the Holocene optimum.?
Or are you IGNORANT of both?
ZERO Trend? Looking at the entirety of the Holocene shows this in Greenland: http://jonova.s3.amazonaws.com/graphs/lappi/gisp-last-10000-new.png
or at that other pole: https://www.bing.com/images/search?q=Epica+Ice+Core+Chart&view=detailv2&id=45F6598FA213A471ADA9FB8CBEF42ED747DC7DB1&selectedindex=6&ccid=Q6Mh7VuH&simid=608024184312693707&thid=OIP.M43a321ed5b87f178fb62ae1801309ca7o0&mode=overlay&first=1
or comparing both: https://www.bing.com/images/search?q=Epica+Ice+Core+Chart&view=detailv2&id=F3923598B970A78298CB3D355F668B401E641E52&ccid=geO7fl5y&simid=607990756631973340&thid=OIP.M81e3bb7e5e723ada3895c5d617931fa4o0&mode=overlay&first=1&selectedindex=34
Someday it will dawn on the “True Believers” the focusing on short term data is counter-productive.
Its a nice graph showing a steady ZERO TREND interrupted by an El Nino peak.
And which started with an el Nino peak. One of the strongest on record.
Or is it a terrifying zero trend?
the 18 year hiatus diversion trick.
OK, I’m having trouble following the warmist narrative WTF. I think the following sums it up, perhaps you can add some relative context?
o If there’s no warming for 10 years, it means the models are wrong (Jones)
o no, no, no, it’s 15 years (Santer)
o well we think we’ve found the missing heat in the (pick one of 60+ papers)
o well we decided that the argo buoys should be adjusted to match buckets from wooden sailing ships
o hiatus? Oh, that was just a diversion by the skeptics…
Look at the graphs
Yes WTF, Its a nice graph showing a steady ZERO TREND interrupted by an El Nino peak.
WTF April 2, 2016 at 1:18 am
Look at the graphs
Ah, presented with an actual discussion of the warmist position over time, all WTF can do is come up with look at the graphs?
Your cover is blown WTF. You’re the very simplest of trolls.
Posted a point by point reply to davidmhoffer (here). It contained some links, so may have got auto-rejected for some reason. Could a mod pls retrieve it if possible?
(2nd attempt)
davidmhoffer,
I’m having trouble following the warmist narrative WTF. I think the following sums it up, perhaps you can add some relative context?
I’m very familiar with the following issues. I’ll try to provide context and info to help.
o If there’s no warming for 10 years, it means the models are wrong (Jones)
Jones meant until at least 2019. The email you are referring to was written in 2009. The reply he got from Mike Lockwood confirms.
Phil Jones: the no upward trend has to continue for a total of 15 years before we get worried. We’re really counting this from about 2004/5 and not 1998.
Mike Lockwood reply: …I came to the same conclusion in that I estimated that we’d need 10 more years of decline from now on before it was really significant…
IOW, ‘pause’ would need to last until 2019 before it became a significant issue according to Jones.
The exchange has been distorted in reporting on it. Here’s the copy of emails to check for yourself.
http://www.burtonsys.com/FOIA/4199.txt
o no, no, no, it’s 15 years (Santer)
Santer’s paper examined observed and simulated TLT data (with trend and without) over a range of periods to test when a anthropogenic (warming) signal could be detected. The abstract of Santer’s paper said “at least 17 years” (not 15), but it’s clear from the whole paper that this is not an inevitable or standard time-period. For some tests they were able to glean a signal after 17 years, but not for all tests. The conclusion of the paper said:
The clear message from our signal‐to‐noise analysis is that multidecadal records are required for identifying human effects on tropospheric temperature.
Multidecadal = at least 20 years, but greatest confidence for discerning signal in TLT trends was found in 30+ year time periods.
Original paper can be accessed here:
http://wattsupwiththat.com/2014/10/03/ben-santers-17-year-itch-revisited-he-and-a-whole-stable-of-climate-scientists-have-egg-on-their-faces/
o well we think we’ve found the missing heat in the (pick one of 60+ papers)
Other components of the climate system were warming (upper oceans, for one) during the supposed ‘pause’ in TLT products (or trend ‘slowdown’ in surface records). Various theories were tested to see if these warming parts of the climate system could account for ‘missing heat’ in the TLT records.
o well we decided that the argo buoys should be adjusted to match buckets from wooden sailing ships
No. Transition from bucket measurements of SSTs to engine intake measurements occurred decades before the first ARGO buoy was launched.
Side note: the ‘bucket’ adjustment cased a very slight increase in trend in the latter decades of the SST record, but caused a huge adjustment – the largest single adjustment to SST trend in the record – that actually lowered the centennial trend quite significantly.
o hiatus? Oh, that was just a diversion by the skeptics…
The supposed ‘hiatus’ or slowdown in global temps was broadly discussed in the literature. Different conclusions were reached. The majority of published papers acknowledged that the time period was too short to make absolute claims about a pause.
Any absolute claim of a ‘pause’ was devoid of a trend analysis. Always. If you’re interested I can show that the data did not allow for an absolute claim of a ‘pause.’ It’s not a complicated argument, only requiring the most basic understanding of statistical uncertainty.
Barry -an excellent, comprehensive and well referenced response to Davidmhoffer’s points.
Barry
’m very familiar with the following issues. I’ll try to provide context and info to help.
Apparently you both missed the sarcasm and that my comment was directed to WTF. It exposed him as a lightweight troll as intended.
seaice1 April 3, 2016 at 5:20 am
Barry -an excellent, comprehensive and well referenced response to Davidmhoffer’s points.
Well actually it isn’t. Jones comments are out of context, Santer took two cracks as the falsification issue, one at 15 years (which I referenced) and one at 17 years (which I didn’t reference because it is much more vague and not as readily applicable, but Barry used it anyway instead of the one I DID reference) and the argument about the argo buouy adjustment goes much deeper than Barry’s explanation in that he is correct that it lowered the centennial trend while glossing over that the total result was to “pop” the current zero trend in a blatant attempt to end the pause via a justification that simply doesn’t hold water. Rather than an excellent response, Barry just muddied the waters with typical half truths and misdirection.
Bottom Line – it was the warmists who claimed that CO2 sensitivity was so high that it could not possibly be overcome by natural variability. Then when it was, rather than admit that they were wrong, they came up with endless explanations and excuses that contradict each other and don’t stand up to scrutiny. Now they’re trying to claim they never said that in the first place.
Could you cite a reference for Santer and 15 years, David? I wondered if you’d confused that with the 2008 BAMS report, which is another point that is often distorted (the period is based on ENSO-removed trends).
The Jones email is quite clear. Were you thinking of a different reference?
I realize now you were referring to Karl et al. There was already a warm trend present before the adjustments. That trend was an order of magnitude larger than the current RSS trend since 1998, which is only 0.002C/decade. This small trend has skeptics saying that the pause is over, so I don’t understand how it could be held that the old NOAA trend, which was larger, was a pause in the first place. Perhaps the current RSS TLT trend and the old NOAA trend are judged to different standards?
The sarcasm was clear enough, but your points were still incorrect as I understand them. They are old canards that I’ve seen floating around for years (except Karl et al, of course)
barry asks:
Could you cite a reference for Santer and 15 years, David?
I don’t know about 15 years, but here’s a Santer reference:
IPCC lead authors can totally change what the scientists under them write. Ben Santer was lead author for chapter 8 of the 1996 IPCC Report.
Each of the statements below are from the experts’ ‘reviewed and approved’ language in that same Chapter 8. But they were deleted by the lead author, Ben Santer:
1. “None of the studies cited above has shown clear evidence that we can attribute the observed [climate] changes to the specific cause of increases in greenhouse gases.”
2. “While some of the pattern-based studies discussed here have claimed detection of a significant climate change, no study to date has positively attributed all or part [of the climate change observed] to [man-made] causes. Nor has any study quantified the magnitude of a greenhouse gas effect or aerosol effect in the observed data-an issue of primary relevance to policy makers.”
3.”Any claims of positive detection and attribution of significant climate change are likely to remain controversial until uncertainties in the total natural variability of the climate system are reduced.”
4.”While none of these studies has specifically considered the attribution issue, they often draw some attribution conclusions, for which there is little justification.”
5.”When will an anthropogenic effect on climate be identified? It is not surprising that the best answer to this question is, “We do not know.”
Ben Santer deleted those comments, and inserted his own language:
“The body of statistical evidence in Chapter 8, when examined in the context of our physical understanding of the climate system, now points to a discernible human influence on the global climate.”
It is now twenty years later. Santer’s inserted language pushed the IPCC in a direction totally contrary to what those scientists intended, changing the entire meaning of the chapter.
When you try to defend Santer, keep in mind his devious wordplay. He plays a scientist, but he’s really a propagandist. And what the real scientists had written 20 years ago is still valid. We still don’t know how much, if any effect human emissions have on “the climate” (by which they mean “global temperatures”).
But based on all available evidence, the answer has to be: “Not much, if any”.
It’s interesting that a reprobate like Santer is hero to the alarmist cult. Skeptics have plenty of great role models who are ethical and follow the Scientific Method. Alarmists have people like Santer and Mann.
Draw your own conclusions.
db, that’s yet another distorted narrative. Santer and the lead authors were required to make changes after the plenary session in Madrid accepted chapter 8 SAR. A month later the entire SAR was reviewed again by a plenary session in Rome, including the revised chapter 8, and subsequently accepted.
[LINK]
barry,
Thank you for your link, which corroborates everything I wrote. Furthermore, it is a steaming pile of cow manure.
Santer did exactly what I said he did, as your self-serving ‘report’ acknowledges. He unilaterally changed the meaning of the findings from “We don’t know”, to “human influence”. In other words, Santer LIED. And you perpetuate Santer’s lies.
Therefore, YOU are trying to pass off a ‘distorted narrative’. Really, the despicable lies told by climate alarmists like you and Santer are so easy to prove that you must have no conscience at all.
We can continue this discussion whenever you want. But if you post links proving what I wrote is factual, don’t be surprised when I show conclusively — using your own links — that you are just parroting the IPCC’s propaganda.
Really, have you no shame at all?
What time is the freedom clock at?
Why wouldn’t temperatures be down? The El Niño impulse is wrapping up. The energy released from the ocean is headed to a place where stars and worlds are born, never to return. The energy level of the earth will return to pre-El Niño levels and trend, we will make a note of it in our records, and life will go on. Earth has coughed up a climatic hair ball and will quickly resume where it left off just as happens at the end of all El Niño events.
“Earth has coughed up a climatic hair ball and will quickly resume where it left off just as happens at the end of all El Niño events.”
Except it wont by instrumental record standards. The neutral trend overall has been tilted upward by the background AGW trend of rising GHG’s – with of course the expected modulation of that trend in the short-term, of natural ocean climate cycles
OK then, Tone B, how about this:
Roy Spencer’s recent adjusted data set now fully vindicated in comparison with high altitude balloon – mounted thermometers. Note the blue data points are prior to adjustment while the red data is post-adjustment. As has been stated many times, Roy’s new data agrees really well with ACTUAL TEMPERATURE READINGS.
or to https://twitter.com/BillHartree/status/716154153731371008
So which is correct then Bill UAH or RSS ? and prior to the latest “adjustments” RSS was NOT agreeing with the RATPAC data-set.
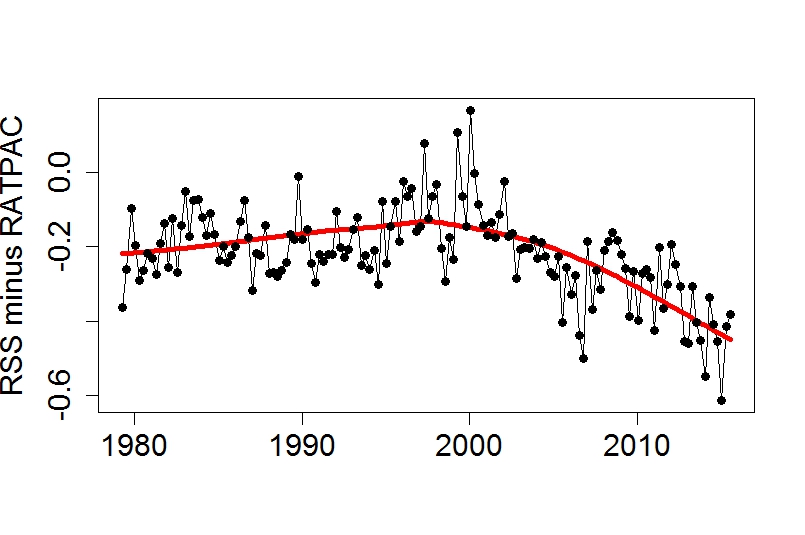
And UAH was in close agreement with RSS before their new version.
RatSac.. the balloon equivalent of GISS !!
Selected
Adjusted
oh look … a warming trend.
Tony what do you attribute as the cause of the cooling period that lasted until SC21 in the 1980s all the while when CO2 concentration was rising? I’m also curious as to how you think heat gets into the ocean.
Bob:
The most likely explanation of that is “global dimming”
https://en.wikipedia.org/wiki/Global_dimming
Heat gets into the ocean 24/7 and should exit at the same rate 24/7 on average but of course dependent radiative conditions locally.
It is well known that PDO/ENSO has the biggest influence on atmospheric temp as it cycles though -ve/+ve.
The La Nina part of the cycle, reveals cooler waters to TSI near the surface and thus having a smaller deltaT twixt SST and atmos, is bound to reduce convective (sensible + LH) addition to the Trop. But it can absorb TSI at the same rate – the differential in to out means that heat will be added to the upper ocean layers in excess of normal. The situation is reversed for a Nino.
“Heat gets into the ocean 24/7 and should exit at the same rate 24/7 on average but of course dependent radiative conditions locally.”
I’m intrigued what you said Tony. You do know that sunlight penetrates at least 100′ deep at the strongest solar wavelengths? How do you know or why do you assume the heat on average always leaves at the same rate? That’s one helluva assumption.
http://www.whyistheskyblue.co/solarradiation.gif
http://www.seafriends.org.nz/enviro/plankton/phdwg34.gif
Bill H – that graph is not of Spencer’s UAH data set, it’s RSS. You’re showing that the new RSS adjustment for TTT (total troposphere temperature) is a better fit to RATPAC balloon radiosonde record.
AndyG55,
RatSac.. the balloon equivalent of GISS !!
Selected
Adjusted
Please tell us which of the balloon radiosonde data sets is not selected/adjusted.
And would UAH then be like ‘RatSac’ and GISS – illegitimate because it has undergone many revisions, like every other data set?
Or do some adjusted data sets get a free pass for some reason?
Don’t want to speak for Toneb, but heat entering and leaving at the same rate is simply describing equilibrium conditions. He did say “on average”. This not really such a huge assumption. If you put energy into something at a constant rate it will heat up until the energy leaving is the same as the energy entering.
Well then, I’ll speak for Toneb. His charts don’t have the RSS version, while Bill H’s does:
I’m always skeptical when someone tries to pull a fast one. Especially any chart fabricated by Tamina.
Poor Barry, doesn’t seem to understand the difference between adjustments for genuine scientific and physical reasons,..
and adjustments to fit an agenda.
Keep trying, Barry….
Poor Barry, doesn’t seem to understand the difference between adjustments for genuine scientific and physical reasons,..
and adjustments to fit an agenda.
Before you explain that to me, could you advise which of the balloon radiosonde data sets have not been adjusted?
I’ll make an educated guess on your new point, though. Any adjustment that results in a lowering of the temp trend would be “genuine scientific and physical”, and any adjustment that raised the trend would be for political reasons.
If you have a more nuanced explanation I’d be interested to hear it.
Actually, the energy will probably be feeding the Asian monsoons. Earlier this week we had our first torrential downpour for months at 100 kilometers or so south of Thailand, at this time of year near the present center of the ITCZ, which is displaced a few degrees north of the Equator.
I have not done any number crunching, but based on general experience I think the rate decline of El Nino conditions will be typical.
We are now overcast and humid with only faint breezes, and hotter than usual for these conditions. So I expect heavy rain tonight and that would confirm the arrival of the Indian Monsoon, though it won’t arrive to the Indian subcontinent for several weeks yet.
Frederick: looks humid to me, too.
http://tropic.ssec.wisc.edu/real-time/mimic-tpw/global2/main.html
The big question for me is whether there is a step up, as Bob T has mentioned occurred in recent el Nin˜os, or wherhter it is even, or a step DOWN. Watching and waiting…
precisely. I suspect a slight step down, evident by maybe August…
then a gradual cooling for several years at least….
time will tell.
What will cause the cooling to occur?
Chris, seriously ????
You haven’t been paying even the slightest attention, have you. !
Of course I have. Are you saying that the oceans will start absorbing heat from the atmosphere? That’s the only way it could happen, unless there is a change in insolation, orbital change or volcano/pollution.
Your continued ignorance astounds even me. !
And I have worked trying to teach low IQ 15 year olds.
Another content-free reply from Andy, why am I not surprised. Keep avoiding the question, you may as well be consistent at something – and it surely isn’t the scientific knowledge you are bringing to this thread.
Yawn.. go and learn something
“Another content-free reply from Andy”
Its pointless putting any content in a post aimed at you.
I don’t have time or patience to start at kindy level for you.
Yeah, I can see how you don’t have a lot of time to substantiate your point. You’re too busy posting literally thousands of mostly snarky comments on WUWT.
In the absence of global warming from CO2, we would expect conditions to return to pre-El Nino quite soon. In the long term, I understood we were on a slow cooling trajectory. If there were no such thing as AGW, it would seem quite reasonable to believe we would see downward temperatures quite soon. Indeed, we should have seen them already as we return to the pre-1998 El Nino temperatures.
precisely. I suspect a slight step down, evident by maybe August…
then a gradual cooling for several years at least….
What else could one possibly expect after a super strong el Nino than cooler years for a while after?
I’ll bet anyone $500 that the mean trend in both the satellite records since 1998 will be one of warming by December 2020. Bets would only be off if there was a Pinatubo-sized eruption before June 2020. If no eruption like that, I will honour the bet.
That means that only one of the satellite records has to show a mean zero or cooling trend for me to lose. Happy to limit the bet to the UAH record, if that is preferred. I’m sure I’ve seen a few people predicting a cool turn and a return of the pause….
AndyG55 – want to take me up?
Which ‘trend’, barry? The raw data? Or the ‘adjusted’ numbers?
If you can link me to the raw data for UAH or RSS, I’ll consider them. Would you not accept UAH, adjusted as it has been many times? I thought skeptics approved of that data set.
Lots of folks would like to see the raw data for RSS and UAH.
We know the temperature data for surface stations is NFG, no matter what the latest talking points are.
A massive step down.
Fascinating year ahead! If ENSO transitions to La Niña by this Fall, the Global Cooling could obviously be immense.
Also, if the associated westerly stratospheric wind shear decreases…Hurricances could return to their traditional tracks through the Caribbean Sea and Gulf of Mexico?
It’s been over 10-years now without a Major land falling U.S. Hurricane.
OT (might be of interest)
A celestial object crashed into Jupiter 17/03/2016. Amateur astronomers have filmed a collision between an asteroid and the largest planet in the solar system. Impressive.
http://www.sciencealert.com/something-just-smashed-into-jupiter
Very nice – thanks. And all done with an 8″.
I don’t suppose we could stop talking like there’s a single climate for the entire globe….some places are colder. some warmer. I still say the “global temperature” (which isn’t a temperature) is pretty meaningless.
Of course you are correct. The weather station for my university indicates that March 2016 was the 30th warmest over the last 127 years. Not one of the top ten warmest March temperatures have taken place since 2000.
This site is in a rural location and the weather records have been meticulously gathered by university employees over the last 127 years.
It’s the reason why the G is there in AGW.
The first graph suggests that there was a stepwise temperature increase with the 1997/98 El Nino. So it is theoretically possible that we do have significant global warming going on long term — but that the temperature goes up in steps. The next five to seven years should give us some idea whether the current El Nino caused another step up in temperature. So the whole game should be answered empirically over that time frame. Patience.
As a Canadian, it is pretty obvious that Northern temps have risen recently. I don’t see any convincing evidence for the “higher CO2/ warming globe” narrative so I would like to know what the cause of these very beneficial changes are.
The climate debate has brought to light real problems that must be dealt with. The internet has damaged the importance of peer review as a gatekeeper to publishing. Politics has intruded into this area of study, corrupting everything it touches.I doubt if anyone would seriously argue that radical environmentalism doesn’t coexist in many people with politically leftist ideology. These people are typically not very analytical. They usually value feelings over facts and just believe what they want to believe. If the sciences, individually and collectively, fail to “fix” peer review, then political intrusion will continue and worsen, expanding into other areas of research.
As things stand today, Western governments are a factory for research that is faulty, doctored, inadequately reviewed and protected from reasonable reexamination even though it was paid for with public money. This is akin to government telling newspapers what to print. The digital era of newsbites and internet “snapshot” news is tailor made for manipulation by special interest groups. How do we fix it?
I’m sorry John, but to me this comment “so I would like to know what the cause of these very beneficial changes are.”
Is NOT the way a GLOBAL problem should be viewed.
You may personally prefer a warmer climate but there are many parts of the world where higher temps would created problems for society.
And in the longer term, YES, LONGER …. not now, next decade or even before most of shuffle off this mortal coil … but eventually…. SL rise – that will mean either vast expense to move our coastal populations or to shore them up.
AGW has NEVER predicted any catastrophic near term problems – they have been predicted to lie well into the future.
Any denigration of climate science because you think this is the case is erroneous or fueled by headline seeking media (much as the IA scare of the 70’s which had no basis in the predominant thinking of the time.
Also;
“….. in many people with politically leftist ideology. These people are typically not very analytical. They usually value feelings over facts and just believe what they want to believe. ”
I would say that right-wing people are typically reactionary. They usually value beliefs over facts and just believe what they want to believe.
And so it goes on – the human condition one extreme v another and never the twain shall meet.
Meanwhile the vast majority exist in the middle.
Yup my winter fuel bill got some relief this year.
Time for canadians to get serious about climate change, we need to construct a giant mirror fixed in orbit above Hudson Bay.
By focussing additional sunlight into that water body, we can improve our growing season and test run the technology we will need to keep Canada habitable when the next ice age begins.
As for the advice from Toneb .
What is wrong with accepting the blessing wrought on us by a milder than average winter?
Of course all the “projected” catastrophes are way off in the future, they don’t sell so good when easily testable in time.
So far the Cult of Calamitous Climate has got nothing, just endless speculation from chicken little types.
Typical “leftist factoids”.
Sure the “sky will fall” if you wait long enough.
Same as life is a sexually transmitted terminal disease.
Here is my model of UAH-RSS-HadAT lower troposphere temps based on the ENSO, AMO, volcanoes, Solar Cycle (which is not significant) and the Ln(CO2) warming trend and then my forecast going out one full year.
I can’t quite get up to the numbers that are experienced in the big El Ninos (1972-73, 1997-98 and 2015-16) as there is a extra dump of energy into the atmosphere from these big events (the 1877-78 and 1942-44 El Ninos would count in here as well) but the rest of the moderate ENSO events are close.
Temps are going down now and a La Nina is coming. We will be back down to about 0.1C by this time next year.
http://s28.postimg.org/oxze0tbil/UAH_RSS_Had_AT_Model_Mar16.png
The residual warming trend is only 0.043C per decade even after this Super El Nino.
http://s14.postimg.org/u5ksq9ztd/UAH_RSS_Had_AT_Warming_Trend_Mar16.png
NIce
Except the part about solar. You could still just be curve fitting! 😉
What is the approximate portion assigned to CO2 as a % – I’m ready for a laugh tonight.
Bill, you double counted solar and apparently don’t realize it!
ENSO is a solar process, as I explained above regarding the one ending now. When you look back over the record at previous ENSOs, they either start just after a solar minimum during the onset of the TSI rising phase, or after sufficiently high solar periods that drive short-term OHC accumulation. That’s part of my supersensitivity package. I’ll bet you assigned a high proportion in your model to ENSO.
What is your rational for the cooling period that lasted until SC21 started in the 1980s while CO2 was rising?
So we had a month of global cooling. The assertion that the presence of C02 causing warming is falsified.
Andrew
Of course not, silly. The assertion of the presence of CO2-caused warming has never been thruthified.
Some months CO2 causes warming, then CO2 feels guilty and causes cooling. CO2’s not bad, it’s just hooked on publicity.
No global warming for… 1 month!
Vu
Depends on how many hiroshimas that is.
Looking at the data for the North Hemisphere where most of the global population is based, it appears that the latest el Nino was a bit of a washout.
http://www.vukcevic.talktalk.net/NH-UAHt.gif
Latest sunspot data (March 2016 = 39.2) is out. Unfortunately the Brussels officialdom doesn’t publish any more the ‘classic’ series of SSN numbers (still available here ) quoted in all science papers to date, with the exception of the document describing newly redesigned data.
Observation: despite SC24 being weak cycle the monthly average for the last 5 years stayed consistently above SSN=40 line.