GISS and NOAA to Announce 2015 “Record High” Global Temperatures in Joint Media Teleconference Today

Guest Post by Bob Tisdale

SEE UPDATE 1 AT END OF POST: I’ve provided a link to the slides from the teleconference and updated monthly and annual graphs.

# # #

On January 15th, NOAA Communications notified the media Wednesday: NOAA, NASA to announce official analyses of 2015 global temperature, climate conditions.

WHAT: NOAA, NASA media teleconference call announcing 2015 global climate analyses – brief summary remarks – questions and answers
WHEN: Wednesday, January 20, 11:00 a.m. – 12:00 p.m., Eastern Time (U.S.)
WHO: Thomas R. Karl, L.H.D., director, NOAA’s National Centers for Environmental Information, Asheville, N.C. and chair of the Subcommittee on Global Change Research, U.S. Global Change Research Program

Gavin Schmidt, Ph.D., director, NASA’s Goddard Institute for Space Studies, New York, N.Y.

See the NOAA webpage for links to the live audio, etc.

We already know NOAA and GISS will tell us that their much-adjusted surface temperature data showed record highs in 2015. We discussed and illustrated this in the recent post Meteorological Year (December to November) Global Temperature Product Comparison through 2015. There may be some minor differences, but the calendar year results won’t be noticeably different than the meteorological year data shown in Figure 1.
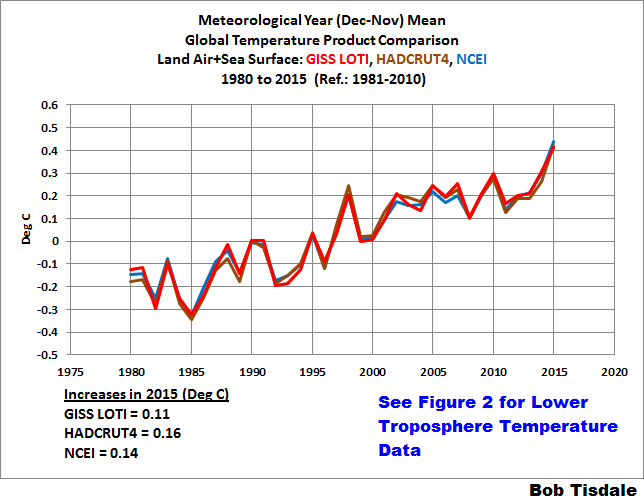
Figure 1 - LOST Comparison

Figure 1

I suspect Tom Karl and Gavin Schmidt won’t bother to tell the public that lower troposphere temperature data were far from record highs in 2015, as we presented in the post Annual Global Lower Troposphere Temperature (TLT) Anomaly Update – Distant Third Warmest for 2015. See Figure 2.
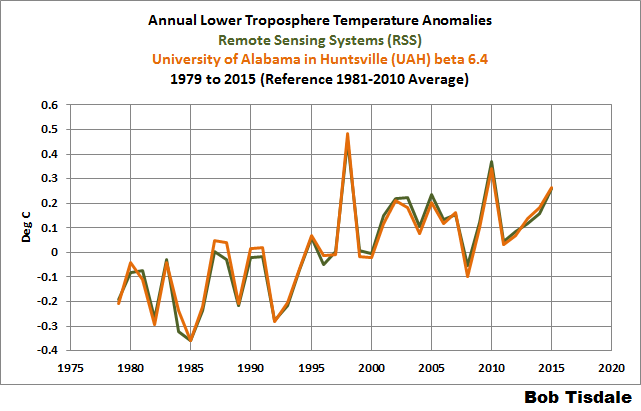
Figure 2 - TLT Annual

Figure 2

And just in case you missed it, because GISS and NOAA both use NOAA’s ERSST.v4 “pause buster” sea surface temperature data, today I also published The Oddities in NOAA’s New “Pause-Buster” Sea Surface Temperature Product – An Overview of Past Posts.

I’ll update this post today as GISS and NOAA release their data and slides. So stop back regularly.

UPDATE 1:

The GISS LOTI data rose 0.07 deg C in December, 2015.

Figure 3 - Monthly GISS LOTI

Figure 3

Not to be outdone, the NOAA NCEI data jumped a whopping 0.15 deg C last month.

Figure 4 - Monthly NCEI L+O

Figure 4

Figure 5 is a comparison of the annual GISS LOTI and NCEI data, referenced to the base years of 1981-2010. The upticks in 2015 are listed on the illustration.

Figure 5 - Annual GISS and NCEI Comparison

Figure 5

The NOAA/NASA Annual Global Analysis for 2015 is here in .pdf form.

I’ll provide a full update for December, 2015 in a few days

0 0 votes
Article Rating
301 Comments
Oldest
Newest Most Voted
Inline Feedbacks
View all comments
emsnews
January 20, 2016 4:57 am

You mean they will all lie AGAIN??? Will wonders never cease in this Age of Miracles!
On the other hand, if they announced this last month, they would have been applauded. But this month in New York has been very, very cold and we are facing a blizzard this weekend. People who thought we are warming up are switching to thinking another Ice Age is here.

emsnews
Reply to  emsnews
January 20, 2016 4:58 am

Oh, by the way, NYC is considered the Center of the Universe mainly by our media giants who feed us information. So if they are freezing cold, the entire planet is cold unless they run off to the Bahamas, etc. every weekend in private jets which they love doing as our President is so fond of doing, too.

Reply to  emsnews
January 20, 2016 7:41 am

Hey – but they still have those “New York values” they can cling to ..

E.M.Smith
Editor
Reply to  emsnews
January 20, 2016 10:18 am

Clinging to their New York Values and cell phones?

Bryan A
Reply to  emsnews
January 20, 2016 10:18 am

One thing is certain though, We all know that these current temperature values aren’t correct (no more so than the temperatures were correct last year) and will be subjected to further data rape in the future.

getitright
Reply to  emsnews
January 20, 2016 10:54 am

Like Bill Clinton ad his friend who jet off to the island of lost boys.

George Tetley
Reply to  emsnews
January 20, 2016 11:21 am

Y’all talking bout that Heat-island NYC?

Mike the Morlock
Reply to  emsnews
January 20, 2016 2:17 pm

emsnews January 20, 2016 at 9:22 am
One word. Buffalo.
michael

Bryan A
Reply to  emsnews
January 20, 2016 2:21 pm

Are Gavin Schmidtcomment image
and Michael Manncomment image
related

Reply to  emsnews
January 21, 2016 11:30 am

Brian,
It’s like in a marriage, if you live together and do a lot of things together, both partner’s appearance will get more and more similar…

Phil.
Reply to  emsnews
January 20, 2016 7:03 am

Actually for most of this month NYC has been significantly above average, it has not been ‘very, very cold’! Yes a Nor’easter is forecast for the weekend with the first significant snow fall of the year, not surprising for the second half of January (the coldest month of the year). What was surprising was over 70ºF record temperatures over Christmas! Last January we had lows below 25ºF on 11 days (lowest 8º), this year on 6 days (lowest 11º).

Reply to  Phil.
January 20, 2016 7:45 am

Elaine (for which ’ems’ stands for in part) can be a little ‘loose’ with the facts …

emsnews
Reply to  Phil.
January 20, 2016 9:22 am

Note to people who cannot read, I mentioned that NY STATE is cold as hell. Below zero at night. I live upstate. DUH.

emsnews
Reply to  Phil.
January 20, 2016 9:24 am

BTW, NYC is on the ocean and thus has a different climate mode whereas 90% of the rest of the state which also borders on Canada and Vermont, have a much more severe winter climate and more snow. This is why all the ski resorts in NY are upstate where I live like Jimminy Peak, for example.

george e. smith
Reply to  Phil.
January 20, 2016 10:44 am

Duzz ” we ” translate as NYC ??
g

emsnews
Reply to  Phil.
January 21, 2016 5:44 am

Reading comprehension time: one poster remarked that it is sort of warm in NYC and I explained patiently that 90% of the state is not in the southern corner on the ocean but rather the opposite, next to Canada.
What is saddest here is why anyone is attacking me for saying the obvious. I strongly suspect that right wing political posters here have this desire to attack anyone in the middle who happens to disagree with the occasional discussions about politics here.
There are a lot of right wingers at this site. And won’t win many arguments if they mindlessly attack anyone who is even in the middle, much less, left side. I, after all, have since day one, talked about how the global warming business is senseless and I keep pointing out that our main danger remains Ice Age conditions in the probable future.

Reply to  emsnews
January 21, 2016 11:13 am

Thought provoking comment.
The PERCEPTION (and I have means to verify it) is correct. If the skeptics momentum is to quicken they’ll have to adjust this pov.

Reply to  emsnews
January 21, 2016 11:15 am

Sorry … I meant to say NO means to verify.

Reply to  Phil.
January 21, 2016 8:04 am

Elaine – making ‘friends’ and influencing people, one “right wing” website at a time. Elaine, are you a Bernie Sanders-class socialist … or worse? One is prone to properly conclude you are decidedly ‘leftist’ given your tack above … only making an observation here …

george e. smith
Reply to  emsnews
January 20, 2016 10:30 am

So I guess we can deduce/speculate/postdict/wag/whatever, that in 2015 the Antarctic highlands very likely (>50.1%) did not ever go below -93.5 deg C (179.66 K); because of the CAMMGWCC that threatened the survival of life on earth.
Those scientists that are entrapped with all that ice at Vostok Station should be airlifted to safety, before the whole place falls into the lake.
Yeah ! Russians are people too.
G
PS Just where would life be safe these days ??

jadamlangley66@yahoo.com
Reply to  emsnews
January 20, 2016 11:08 pm

The satellite data are more erratic than the ground temperatures, but the trends from 1978-2015 in Figure 1 and Figure 2 look very similar. Am I missing something?

Reply to  emsnews
January 21, 2016 6:25 am

I think you’ll find my article I just published: https://logiclogiclogic.wordpress.com/2016/01/21/48-inconvenient-truth-nytimes-lies-2015-wasnt-the-hottest-year-on-record/
and my reference article: https://logiclogiclogic.wordpress.com/2015/12/21/failures-of-global-warming-models-and-climate-scientists/
Interesting. The claims by Hansen and Mann finally put to rest the fact of the tampering with the historical record they have done.

Reply to  logiclogiclogic
January 21, 2016 2:02 pm

Thanks L3.
Good stuff. Well written.
Saved for future reference.
Since you have such a deep interest I wonder if you know of an approved quality assurance project plan that uses agreed upon temperature adjustments methods … specifically published by NOAA and NASA. I haven’t been able to locate such and of course it piques my curiosity.

Reply to  knutesea
January 21, 2016 5:25 pm

I think trying to adjust thermometers is a losing proposition. There are so many problems and lack of metadata is huge. The distribution of them is terrible. It wouldn’t take that much money to rectify the situation but the historical record is what it is. Without metadata it is hard to know the answers to lots of questions. Why would we spend the effort anyway when the satellites are 1000 times better more redundant and verified by radiosondes. Hansen would like to focus on surface temperature but it is not clear to me why it should be different or why it is better to have that. It is a meaningless number. The surface of the ocean 1 meter above the ocean is meaningless. Nothing lives there. If the idea is to know how temperature change affects living things then it is the sea surface temperature or the temperatures of the entire ocean that is of importance where life lives just as above ground is where trees and humans and animals live. So giss throwing out sst and extrapolating 1m air temperature is pointless. If we are looking got energy balance then we should be using the broad volumetric satellite measurements.

Reply to  logiclogiclogic
January 21, 2016 5:40 pm

Why would we spend the effort anyway when the satellites are 1000 times better more redundant and verified by radiosondes.

I don’t know but perhaps:
1. Because however inaccurate compared to satellites it continues a centuries long traditional method ?
2. Minimizes the error of comparing data from different methods ?
3. Is spuriously chosen to support ones case ?
I can see your point though.
One of the arguments that believers ascribe to is that there is NOT a borglike allegiance among scientists to corrupt/bend their data and it is the skeptic who is overeaching.
I think it may be that the acceptable procedures for data adjustment are not well defined and this allows multiple variations of what is acceptable.
I’ll keep searching around. There’s bound to be an approved procedure for such adjustments.

Reply to  knutesea
January 22, 2016 4:52 pm

Knutsea, the thermostats are missing a lot of metadata which makes it hard to adjust them. I don’t believe there could be any standard ways. There is for instance consensus around time of observation. Even that is quite controversial. The biggest issue arises around when a station reports data that is different than is expected. This happens remarkably often. In fact it seems maybe 50-70% of the data faces this issue. This seems unbelievable but apparently so many devices are reporting bad values they have to be adjusted. That seems bizarre. Anyway they look to surrounding thermostats to “homogenize” the temperature. Sometimes these close by thermostats are 1-2 thousand km away !! You may know that stations as far as 100 feet away can report 2 degree variations due to microclimate differences. I think the whole network needs to be trashed and a new network of similar devices measured in a laboratory to produce similar results with redundant thermostats at least 3 so they can vote. Completely automated with their own independent power supply, gps and cameras so they can observe tampering or damage of movement. We built such a network for the oceans with ARGO. We have such a network with satellites. However if you want to use land records I think the only solution is this kind of solution. I am surprised we haven’t already done this. Why are we living with such ridiculous stupid antiquated stuff. They have to be deployed in a uniform manner around the globe regardless of population centers. Trying to “fix” the data is hopeless. All you can do is to make the data seem better but in fact any adjustments will increase the uncertainty as each adjustment has its own error. There is also the issue of overlapping adjustments. 5 adjustments are applied. Do these create duplicity? Also there should be a rule that any adjustment which changes the record needs to be backed up with forensic data that validates the adjustment is valid. Maybe not on every case but I don’t believe they ever check to see if the adjustment actually is justified. If you compute that a station is reporting temperatures a degree too cold then someone needs to go out there and see the thermostat, calibrate it against known reference. Determine if a move of the device has actually occurred. They assume when there differences that the station was moved and apply an adjustment on the assumption it must have been moved. Can someone please go and check if that actually happened? For past data they throw out vast amounts of data once they don’t like data from a unit. Is that really necessary?

Reply to  logiclogiclogic
January 22, 2016 7:47 pm

L3
Pretty much in agreement.
Satellites are far more reliable and verified but its not what is being used by the people in authority.
Meanwhile back in land based temperature land ole Dr Spencer recently voiced his frustration and evidently had to do it through Homewood’s site. His site was under attack. Swarmy behavoir. I hope Dr Spencer is grooming a protege. His work is good work.
https://notalotofpeopleknowthat.wordpress.com/2016/01/22/roy-spencer-on-that-2015-record-warmest-claim/
I’ve been rooting out sources for approved methods for land temperature adjustments and as you image they are pretty much left to the professional judgements of the reviewers. Holms gave a couple of links upthread. It’s a situation ripe for bias and warrants an independent and transparent review. Demanding such review is warranted since the taxpayer has paid for the collection of that data. Raw data is public record.
This is all a little suspicious to me because congress has the power to request this information and has the resources to ferret out the poor quality controls that are being used to make multi billion dollar policy decisions.
The question becomes … why are they not more aggressive in doing so ?
They were hot on the trail but have slacked off. The answer I’ve been given the most is that the GOP doesn’t want to make a big deal over a low voter interest issue in a Presidential election year. Actually makes sense.
Meanwhile science is dying under a corrupt peer review process that quells actual real science while promoting dogma. It’s a broken system and it will need some creative thinking to resurface as a credible means of promoting excellence in the scientific method.

Reply to  knutesea
January 24, 2016 9:11 am

I could not agree more. My biggest concern from the beginning of the climate debate was the science was poor. Things were being said without the evidence. Hansen and folks made it almost a religious crusade. The idea was if there is any chance they are right then the consequences would be so severe we need to lie and cover up so we can get our mission to save the world from itself. The same logic seems to apply to a lot of environmental research. The idea is to come out with scary prognosis whether justified by any real science or not based on the idea that tampering with nature is inherently bad and if they don’t have the science to back it up lets just pretend we do. I am as much of an environmentalist as anyone but I am evidence based not religious about it. I also feel no matter what science can’t be compromised. I guess I am more that science is my religion rather than the environment. I get that fossil fuels are dirty and kill. Producing them has many negative consequences environmentally and politically. I am fine with some level of effort to move away from fossil fuels but not because of global warming. We don’t need to wait till 2100 to see the consequences of our dependence on fossil fuels. Millions die every year from the byproducts of every phase of fossil fuel usage. Far more than will ever be affected in any way by global warming 100 years from now. We don’t need to corrupt our science to come up with reasons to switch from fossil fuels.
It’s clear to me there is a lot of really bad stuff going on with this “science”. It is clear to me that there is zero chance these adjustments are valid. I don’t see how anyone cannot see that. 4 different ways we have of validating the satellite record and the damning evidence that when you remove the adjustments the raw data looks like the satellite data shows clearly the adjustments are tampering with reality. Looking historically the adjustments make the 30s and 40s look like cool times when they were NOT. It is obvious the MWP and LIA were not regional and literally dozens of papers confirm this. How they could be regional seemed unbelievable to start with. How could regions of the earth be warmer of cooler by degrees for hundreds of years? What mechanics could do that? That’s harder to explain than global warming. How could they assume the ocean was static? Why do they keep insisting it’s all settled and anyone who has an idea whose consequence might be that temperatures would not go up 3 degrees in 2 weeks then they were called antiscience and ejected from their tenured positions and fired or threatened with lawsuits and RICO statutes. It’s crazy. Every paper always has the required sentence something along the lines : “while this paper might suggest the impact of the amount of warming might not be as bad we aren’t saying that. We believe that global warming is catastrophic. Please publish our paper.” Reading those caveats always gives me the heebeegeebies like we are in a 1984 novel. I fear for science and where it is going.

jpatrick
January 20, 2016 4:59 am

The timing is interesting, as the east coast may soon be buried in 20 inches of snow. That aside, I do regard all these arguments on “the temperature” to be a distraction. I am supposed to accept the premise that higher temperature caused by rising CO2 in the atmosphere is “bad” and that “it must be addressed”. I reject that premise, and for that reason, I’m jaded when I see a big media event about “the temperature”.

Dawtgtomis
Reply to  jpatrick
January 20, 2016 10:09 am

They’re having their day in the heat of the son,
‘Til this baby boy dies and his new sister comes.
When the ice caps have grown
They’ll panic and moan:
“Just look at what mankind has done!”

January 20, 2016 5:01 am

They simply have no shame. There is not one honest person working at NOAA or GISS as far as I can tell.
~Mark

Paul
Reply to  markstoval
January 20, 2016 5:57 am

“There is not one honest person working at NOAA or GISS as far as I can tell”
You just can’t tell, you’re only exposed to a few individuals. When working at a large corporation everyone follows what management says. Over a beer, you’d likely get the real story from the underlings.

michael hart
Reply to  Paul
January 20, 2016 8:44 am

Perhaps if Lamar Smith had taken Tom Karl out for a beer then he would have willingly handed over the emails that Smiths’s committee subpoenaed. Then again, perhaps not.

Christopher Paino
Reply to  Paul
January 20, 2016 12:06 pm

No. They are ALL complicit. Ok, maybe the secretaries and the executive custodians are innocently ignorant, but everyone else is a knowing and willing partner in deception.

Reply to  Paul
January 20, 2016 1:06 pm

In the USA, if a person is part of a criminal gang he is guilty of the crimes they pull. As an example; the driver of the getaway car in a bank robbery is guilty of murder if there is a murder inside the bank during the robbery even though he was outside and did not pull the trigger. Even worse, the heist planner who did not even go with the gang to the bank is also guilty of murder. (as explained to me and a class by a defense lawyer in our town)
For this reason, all at NASA are guilty of the great temperature con job.

Harry Passfield
Reply to  markstoval
January 20, 2016 1:42 pm

Mark: When it comes to GISS and NOAA, all I can think about is how, no matter the differences they have, they always GISS and make up.

Kalifornia Kook
Reply to  markstoval
January 20, 2016 4:12 pm

It’s not just Government. i worked for a big defense contractor. It was not unusual for upper management to flip the results of engineering studies. When engineering protested, they were told to stand down and shut up – and consider looking for a position elsewhere. (Frequently, there would be large talent transfers at that point to other projects.) Management was just trying to satisfy our Government customer. It always amused us (engineers, lower management) when the government screwed us over anyway!
But the ‘official’ study results stood – as re-labeled by upper management. Big, fat, official lies.

Marcus Holm
Reply to  markstoval
January 21, 2016 11:42 am

This obviously can’t be true. It’s not just NOAA and GISS, either, for this to be lies you need the entire international climatological scientific establishment to be dishonest, including PhD students and post-docs without long-term loyalty commitments, as well as consultants like mathematicians and computer experts whose paychecks aren’t tied to climate research. I’m employed in the latter category in Sweden and personally know both young and established Swedish climatologists and geologists.
I just don’t see how dishonesty can even be a factor, scientists *love* nothing more than poking holes in each others’ papers. The climate and weather guys that I know are exactly like the cancer researchers and materials scientists with whom they share the computer systems I help manage.

Reply to  Marcus Holm
January 22, 2016 2:23 am

Marcus,
It has been known for eons that men will follow the group-think if their well being (grants, jobs, prestige) depend on following the party line. I am surprised you know so little about human nature.
By the way, I have seen the proof of these liars “scientists” changing the past on a continuing basis. The GD 1930s can not be changing daily for God’s sake. Why is the past continually being “adjusted”?????
Note: I just used the 1930s as an example, the whole past is continually being “adjusted” to meet the needs of the latest lie.

Marcus Holm
Reply to  markstoval
January 22, 2016 3:06 am

Markstoval, if you think that 99% of the scientists in any discipline would rather toe the line and follow the group than point out a glaring flaw in someone’s method or results, then you know very little about the sort of people attracted to science. Climate scientists are a very heterogenous group of people in many different disciplines, they are not more susceptible to group-think than any other group of scientists.
“Changing the past” isn’t something bad, it’s something they should be doing. The raw data has all sorts of inherent problems which need to be addressed somehow. The data comes from unevenly arranged sources with unknown biases, and teasing out the truth from it is a necessarily complex task. Wouldn’t you rather they improved their methods of dealing with bad data instead of sticking with an older, inferior method?

Reply to  Marcus Holm
January 22, 2016 8:56 am

In a transparent spirit, I would like to see their approved methods and the process with which they arrived at those methods.
If you have a link to that please share.

Marcus Holm
Reply to  knutesea
January 22, 2016 9:23 am

A link for the Hadcrut4 dataset: https://crudata.uea.ac.uk/cru/data/temperature/#faq3
GISS has the following page: http://data.giss.nasa.gov/gistemp/updates_v3/
Couldn’t find a good page on the NOAA website, but there are references in the released data.
This probably isn’t enough to make you happy, but like I said above, it’s a complex problem. You wouldn’t expect to have a good time figuring out how physics data from the LHC is analysed, and this is analogous.

Reply to  Marcus Holm
January 22, 2016 12:40 pm

Thanks Marcus.
I had to laugh out loud concerning happiness. The establishment of facts that require action is a serious business esp concerning billions of people. I relegate terms like happiness to food, sex and heartfelt emotions.
I read the 2 links. My first impression is that given all the adjustments and conditions for adjustments, it is highly unlikely that “experts” can summon a united call to action unless those “experts” can subject themselves to a credible independent review.
Peer review is a broken process. There are many examples of its failure esp in the public health sciences. In order for CAGW to ameliorate the growing status of its skeptics, it will have to subject itself to a higher level of methods review, replication of data and experimental design.
It can also choose to not do so, but it running out of time. The public senses something is wrong and the global economies are beginning to shift into a deflationary cycle. CAGW is missing the window of opportunity as serious doubt continues to linger.

Reply to  Marcus Holm
January 24, 2016 3:24 am

Marcus,
You wrote: “Markstoval, if you think that 99% of the scientists in any discipline would rather toe the line and follow the group than point out a glaring flaw in someone’s method or results, then you know very little about the sort of people attracted to science.”
Obviously you know nothing about human nature or the sorts of cowards who become “scientists” these days. The “scientist” will not go against dogma in any meaningful way or else his whole world is at risk, and scientists rarely risk all. There are not a lot of Tim Ball types in science — especially now that the government funds all of science directly or indirectly. Notice that almost all of the skeptical scientists are retired or towards the end of their careers. That is not a coincidence.

“It is difficult to get a man to understand something, when his salary depends on his not understanding it.”
― Upton Sinclair

Marcus Holm
Reply to  markstoval
January 24, 2016 8:29 am

Great, now you’ve called my friends and colleagues cowards as well as liars, claiming you know them better than I. You’ve convinced me!
“Notice that almost all of the skeptical scientists are retired or towards the end of their careers. That is not a coincidence.”
Yeah, they’ve lost their edge or need the petroleum dollars to extend their meagre academic pensions. A young scientist would *make* their career if they constructed a climate model that didn’t include AGW. To succeed where others have failed is pure gold and to fail where others have failed is no risk at all. Contrary to what you claim, a young scientist has everything to win and nothing to lose by trying to overthrow the dogma, and you are dead wrong if you think that today’s scientists are cowards.
Lastly, if you think that government funding somehow drives scientists to be more biased than any other funding source, you’re also wrong. At least in Sweden, where I know the processes for our version of the NSF.

Reply to  Marcus Holm
January 24, 2016 8:41 am

…you are dead wrong if you think that today’s scientists are cowards.
Well, I’m still alive and today’s scientists are cowards. I’ve said that before.
There are exceptions. But most scientists know that the AGW scare is nonsense, but they keep quiet about it.
Not a single alarming prediction has ever happened. Not one. When one side of the debate has been consistently and completly wrong, what does that tell you about them?
Climate alarmism is an emotional issue. But looked at objectively, it’s bogus. There’s nothing unusual or unnatural happening. The story of Chicken Little comes to mind: the sky isn’t falling. It was just a little acorn.
The climate scare isn’t even an acorn. The whole thing is preposterous to rational folks.

Reply to  dbstealey
January 24, 2016 9:42 am

All men are afraid of something.

Reply to  Marcus Holm
January 24, 2016 9:44 am

I would like to believe that is true. I think eventually the truth will come out. I have never met anyone who isn’t part of this “cabal” i.e. Someone who gets paid to believe this crap who will say that they believe it and can back it up with any actual knowledge of the subject. Everytime I bring the subject up with someone intelligent they almost all are clueless. They spout the “common belief” as if they just practiced the lines from their Sunday preacher. I’ve never been able to have an honest scientific debate about any of these points.
I took a class at Stanford on global warming. The 2 professors teaching it never tried to prove there was any significant warming going to happen nor did they make any conclusions about catastrophic results. They knew they couldn’t defend those points. They brought in the head of LLNL climate modeling group who presented the models. He said the models were crap repeatedly. When the class looked stunned he repeated and said yes the models are crap. They are almost completely without any real effectiveness in predicting anything over almost any time frame. Nevertheless he repeated the same crap about the mwp and Lia were regional. When I asked how that was possible he shrugged his shoulders. When I asked about pdo amo cycles he said they stopped. The models don’t show them. It will stop. On the one hand I was blown away by how honest he was but on the other he still believed in these indefensible positions and could offer no scientific basis for his beliefs. I believe it’s because the mwp and Lia put the science in question so they must be regional. The amo and PDO can’t be modeled so since I can’t put them in the model they don’t exist. Nonetheless my point is that I had to go to the head of the climate modeling group to ask my questions and they were clueless. If I talk to my liberal friends who are all smart with degrees in sciences they haven’t looked into it. No interest or just willing to believe that the liberal scientists must be good people who have done it right. I don’t need to actually understand this at all. I got the impression they actually didn’t care about global warming really which is astounding because this is something that is supposedly going to practically destroy the earth and half the species. You’d think they would be interested in the science. I wonder if subconsciously they worry it is a bunch of crap and don’t want to have to face that.
The fact is I have never met a smart person who believes this stuff who can explain any of the points I bring up. This is opposite of what happens in every other science. If I say something stupid in physics to my physics professor he has an answer and is completely upfront about what we know or don’t know. There is no defensiveness or shut up you imbecile. If they spout a belief in something they are clear that it is their belief and is not proven. They never say things are settled.
The point is that for some reason there is a loud silence about the papers. They never admit being wrong. There is a protectiveness that is weird.
The adjustments are on the face of them defensible. They worked on that a lot. Many people have pointed out they clearly introduce a warming into the record that is significant. That’s doesn’t bother them because they need the warning for the models to be at all plausible at this point. They need to be able to scream it was the warmest year ever hoping that most people have no knowledge of the 1930s or 1940s and no memory of 1998 and don’t bother to look at how the record continues with each amazing iteration of adjustments look more and more like a perfect linear curve upward matching co2 to within 1% regardless of what satellites ocean buoys radiosondes or even common sense say. There are all these articles that show that the adjustments are making many station records into a joke. stations which have reported perfectly are situated perfectly and show a flat or declining trend in temperature for 50 years or more suddenly after adjustment show up to 2c change upwards. It’s shocking how blatant it is and yet that doesn’t bother your friends? I have simply asked. If you adjust a station significantly can we have some forensics to see if the station is wrong. Somebody go out there see if it was moved. Calibrate it against reference. At least some of them. This is all done abstractly as if it were even remotely possible that stations would show the results they posit. How could a station have a systematically growing error over 50 years? I’ve never heard of thermostats doing that. So many other points could be made but that would be a starting point. Can someone validate these adjustments have any reality in fact that can be shown to be something that actually happened.

Reply to  logiclogiclogic
January 24, 2016 9:52 am

logic,
The question implied in your last sentence is answered here:
http://www.surfacestations.org

Marcus Holm
Reply to  logiclogiclogic
January 24, 2016 12:20 pm

LogicLogicLogic, you wrote a long post and I only have time to respond to some of it.
Regional MWP+LIA: I thought it pretty well established that something was happening with the currents in the North Atlantic, with other effects (both heating and cooling as well as other aspects) happening elsewhere.
Shortcomings of the models: My field is scientific computing. As a PhD student, when I learned that the “state of the art” meteorological models used for weather prediction in both the US and Europe (which form the basis of… I forget which *big* climate simulation) don’t even have the basic property of energy conservation and unphysically spiral out of control after just a couple of weeks, I was appalled. From a numerical analysis standpoint, the methods used are embarrassing and lack the theoretical support that I’d expected. I would never send a probe to the moon using an integrator that didn’t conserve energy, and I sure as hell didn’t want to guide the future industrial activity of humankind on a shoddy algorithm either. So I did the obvious thing and asked quite bluntly (to the guy responsible for Swedish weather and climate simulation), so how can you even use this code if you know it doesn’t behave? I’ve forgotten the details, but I received a convincing answer, the gist of which is that they had a “fix” which they’d been able to test against other, less developed but theoretically well-supported codes. Theory, it turns out, wasn’t everything, which is a lesson I’ve since seen confirmed in a variety of computational sciences. So yes, the models are crap theoretically and the models lack the resolution for modelling some important phenomena explicitly, but that doesn’t mean that they’re good enough. From what I’ve seen and heard, I think they are.
“The fact is I have never met a smart person who believes this stuff who can explain any of the points I bring up. This is opposite of what happens in every other science.”
As I illustrated above, this doesn’t match my experience. I think one issue is that climate science is so big, complex, and multidisciplinary that hardly anyone has all the answers. Since I primarily deal with the people who do the simulations, which are usually PhD students and other junior staff, I often get “I don’t know” when I ask a question that strays too far from the bit that they do know. The computer stuff they do seems to make sense, and my experiences with these people contradicts the talk about lies, fraud, and groupthink. To me the skeptics seem far more unscientific.

Reply to  Marcus Holm
January 24, 2016 11:59 am

Marcus,
You wrote: “Great, now you’ve called my friends and colleagues cowards as well as liars, claiming you know them better than I. You’ve convinced me!”
I doubt seriously that one such as you could ever see what a bunch of cowards and liars the so-called “climate scientists” are. The CO2 controls climate speculation has failed over and over and over yet we hear nothing from your “colleges”. You think that people keeping their mouth shut about the truth is not cowardice. It is just like your crowd to redefine English words to try to keep the delusion going.
Call me when scientists across the spectrum defy their Universities, professional organizations, employers, grant funding bureaus, and so forth to denounce the alarmism and attempted destruction of our industrial society.

Marcus Holm
Reply to  markstoval
January 24, 2016 12:24 pm

Markstoval, you said “scientists across the spectrum defy their Universities, professional organizations, employers, grant funding bureaus”
Scientists *are* the universities, professional organisations, employers, and grant funders. Who decides who to employ for a research project? A senior scientist does. Who reads grant proposals? Scientists do.
You’re literally asking for scientists as a group to defy themselves.

Reply to  Marcus Holm
January 25, 2016 9:24 am

Marcus Holm,
You mention your field being computational modeling. One of the things I know the LLNL climate head told our class was that the models produced ridiculous values like +1000C or -200C if you let them run so they had to put in dampening and “fixes.” to prevent these ridiculous numbers and so the result looked like plausible results.
I also read an article recently from a computational modeler who examined the models and said there was obvious evidence of overdampening which is indicative that the models are seriously flawed. As a math and computer science graduate my belief in models which put in unphysical coding that would dampen the results would be zero.

Editor
January 20, 2016 5:05 am

I wonder if they’ll start a public assault on satellite temperatures today. Probably not, no point in drawing attention to something the media is mostly ignoring.
Readers, please bring it up in response to media coverage of the Tom and Gavin show.

Richard M
Reply to  Ric Werme
January 20, 2016 7:53 pm

Seth Borenstein at AP ran an article where satellite data is mentioned.
Earth’s temperature depends on where you put thermometer
“The National Oceanic Atmospheric Administration, NASA, the Japanese and British meteorological agencies and the World Meteorological Organization all use ground data. It’s a matter of better accuracy and relevance, scientists say.”
As is pretty obvious, they are going to try and attack the satellite data.

Reply to  Richard M
January 24, 2016 10:04 am

They’ll have to attack the radiosonde data and the sea surface data and they will ha e to explain the amazing coincidence that when you remove the adjustments the data looks remarkably like the satellite data. Isn’t that strange? You’d think if these adjustments have to do with technology and some problems with siting or whatever that removing the adjustments would produce either something very similar with pluses matching negatives overall or maybe some scattered Unrecognizable curve. Instead you remove the “adjustments” and suddenly 1998 pops out as the hottest year like the satellites say. The 1930s and 1940s are hot again.
I did a simple computer model myself of temperature. I used a number of very simple techniques to arrive at what I thought was a reasonable way to estimate the effects of soot, solar, co2 and pdo/amo cycle. I was astonished to see that I could make a model with produced an almost perfect match to the historical record. Unfortunately that was the unadjusted historical record. When I put the adjustments in the model doesn’t converge with any values for forcing. Sometimes the model is going in the opposite direction of history. Sure my model could be wrong. Almost certainly is however what was shocking was how the adjustments made the data nonsensible. Maybe this is part of the problem they are having. They have so f*d up the data that now nothing fits the data. Anyway interestingly my model showed tcs=1.2 (higher than I have guessed) and PDO wavelength = 60 years and forcing = +-0.23C. The result is astonishing. I can model the unadjusted data to produce an almost perfect match. Solar comes in at about +0.11C peak in later part of 20th century and soot decreases by almost nothing.

CheshireRed
January 20, 2016 5:21 am

I hope for their sakes these guys have their statistical ducks in a row because if The Donald strolls into the oval office I suspect there will be interesting times. I wouldn’t want to be shown to have fiddled climate data on which the US spent $billions…

Reply to  CheshireRed
January 20, 2016 6:04 am

“I wouldn’t want to be shown to have fiddled climate data on which the US spent $billions…” And the rest of the world! They might get arrested for fraud? (Hopefully!)

Manfred
Reply to  andrewmharding
January 20, 2016 10:44 pm

Regrettably, it is doubtful that the combined global facilities for incarceration would provide the required accommodate, even with enthusiastic overcrowding?

Luke
Reply to  CheshireRed
January 20, 2016 6:57 am

I can assure you these guys have their ducks in a row.

Sweet Old Bob
Reply to  Luke
January 20, 2016 7:37 am

Mildred !! ( re commercial on tv ) (8>))

Reply to  Luke
January 20, 2016 11:48 am

Their ducks are in a row only as long as we let them get away with denying first principles physics. Otherwise, the house of cards called ‘consensus climate science’ collapses. The longer the bogus science is propped up by the likes of Schmidt and Karl, the harder the crash will be and the more politically damaging it will become. The simple fact is that false truths are not sustainable in the scientific domain.
If we consider an ideal black or gray body planet whose average temperature and input power are equivalent to Earth, the sensitivity is precisely calculated as the slope of the SB relationship and is bound to between 0.2 and 0.3 C per W/m^2. There’s no possible physics that can inflate the sensitivity of a gray body (a non ideal black body) by the factor of 3 to 4 required to support the insanely high sensitivity claimed by the IPCC and its self serving consensus, especially since the externally measured LTE behavior of the planet is indistinguishable from that of an ideal gray body model of the planet whose temperature is the average temperature of the surface and whose emissivity is approximately 0.62 (planet emissions / surface emissions).
Furthermore, the T^4 relationship between power density and temperature dictates that the incremental sensitivity must be less than the average sensitivity, which for the LTE Earth is measured to be about 0.3C per W/m^2 where this absolute upper bound on the sensitivity is less than the lower bound suggested by the IPCC.

Roger Clague
Reply to  Luke
January 21, 2016 12:39 am

CO2is not evil says:
“Their ducks are in a row only as long as we let them get away with denying first principles physics.”
and
“There’s no possible physics that can inflate the sensitivity of a gray body (a non ideal black body) by the factor of 3 to 4 required to support the insanely high sensitivity claimed by the IPCC and its self serving consensus, especially since the externally measured LTE behavior of the planet is indistinguishable from that of an ideal gray body model of the planet whose temperature is the average temperature of the surface and whose emissivity is approximately 0.62 (planet emissions / surface emissions).”
“gray body (a non ideal black body)” and later in the same sentence, “ideal gray body model”.
What is an ideal, non ideal black body?
Simplicity and clarity are principles of any logic.

John Finn
January 20, 2016 5:27 am

if The Donald strolls into the oval office

I’d say the chances of that happening are about as likely at the much promised solar driven global cooling happening. Zilch

Reply to  John Finn
January 20, 2016 5:46 am

Hillary stands a very good chance of being indicted. Trump is way ahead in almost every poll. Who will stop him…Bernie?
Love it or hate it, it is looking more and more like Trump may well be our next President. But a Cruz or Rubio win may have the same result, as far as these crooks are concerned. Fraud and malfeasance are serious crimes when billions of dollars are at stake.

David Smith
Reply to  John Finn
January 20, 2016 5:49 am

Whether Trump gets his feet under the table or not, I sure hope global cooling doesn’t arrive. With any luck, the currently stalled warming will start up again and we’ll approach a much warmer and nicer world.
However, if the unwelcome cooling did happen to occur, solar driven or not, your blanket pronouncement of “zilch” would look rather foolish. Mind you, even if the Sahara was under 6 foot of snow Gavin and the gang would still keep adjusting the record upwards and scream, “warmest evaaaah!”

Reply to  David Smith
January 20, 2016 6:49 am

Yep. I am constantly amazed their basic premise, that warming is bad, goes so unquestioned. People, plants and animals generally like and do better in warm climates. Add the benefits of increased CO2 to plants, and it’s win win. Not to mention the higher standard of living from cheap fossil fuels, especially coal. Win win win. Mountaintop removal provides valuable level land in unglaciated KY and WW too. Win win win win. Finally, the current interglacial is overdue to end. Win win win win win.

george e. smith
Reply to  John Finn
January 20, 2016 11:01 am

The odds against somebody winning the $1.6B Powerball Lottery were 1:292 million; same as the odds of winning the following $40M “peanuts” drawing.
Yet somebody did win it; three people in fact.
So I guess it isn’t all that unlikely after all. Well unless you don’t buy a ticket, in which case the odds of winning are in fact “zilch”.
G
Statistics tells you nothing about something that may only happen once.
It may happen or it may not happen; and nobody knows which.

Bryan A
Reply to  george e. smith
January 20, 2016 12:28 pm

So what are the odds of spending $292M and buying every possible combination then realizing you missed 1 possible combination and having that combo be the winning numbers?

Reply to  John Finn
January 20, 2016 8:17 pm

Just like the solar driven warming? That didn’t occur either did it?

January 20, 2016 5:40 am

I wish it would rain, and rain heavily, on this parade of lies.

Editor
Reply to  Menicholas
January 20, 2016 6:23 am

I’d rather have it snow on their parade. Oh – check out the eastern seaboard forecast for Saturday. NYC and DC may get clobbered. Yay. And miss me. Boo. (However, if I’m going to miss a storm, I’m quite content to let DC have it.)

Reply to  Menicholas
January 20, 2016 8:57 am

I just wish that the long-awaited El Nino rains would arrive in SoCal.

emsnews
Reply to  Retired Engineer Jim
January 20, 2016 3:22 pm

Southern California is a desert. For some reason, people who came there for the sun are surprised that this means little rain.

January 20, 2016 5:44 am

I downloaded Environment Canada daily data back to 1900 for a number of stations. The numbers for Ottawa, in Ontario, shows that the average of the mean temps has been going up. However, summer TMax has been dropping. That means summers have become LESS hot. The number of days above 30C has dropped. Winter TMin, the coldest it gets in winter, has been getting less cold. The growing season has also increased by some 30 days.
So what has happened in the last 115 years is that the 1920-1930 era had short hot summers, with long deep cold winters. That has slowly changed to milder winters, with longer more moderated summer temps, and more time to grow crops.
And this is supposed to be bad, trending to a catastrophic future?

David Smith
Reply to  J. Richard Wakefield
January 20, 2016 5:55 am

Good point well made.
If you ever want to wind up a warmist, the best answer to give them when they scream at you about a warming world is to reply, “Good. Long may it continue”. They really have no answer to that apart from screaming even more about imminent Thermageddon. Then you laugh at them and then their head explodes. It works every time.

Dawtgtomis
Reply to  David Smith
January 20, 2016 11:06 am

They actually are wishing for your head to explode, hence the horrible commercial we’ve all seen.

herkimer
Reply to  J. Richard Wakefield
January 20, 2016 6:57 am

Richard Wakefield
I too looked at the Canadian data but for the last 18 years when things began to change.
Canada like US has been mostly cooling since 1998. NORTH AMERICA has been cooling.
REGIONAL PATTERN FOR ANNUAL TEMPERATURE ANOMALIES or DEPARTURES FROM 1961-1990 AVERAGES TREND SINCE 1998
• ATLANTIC CANADA – FLAT
• GREAT LAKES & ST LAWRENCE -DECLINING
• NORTHEASTERN FOREST –DECLINING
• NORTHWESTERN FOREST –DECLINING
• PRAIRIES – DECLINING
• SOUTH BC MOUNTAINS – DECLINING
• PACIFIC COAST- RISING ( RISING DUE TO EXTRA WARM NORTH PACIFIC LAST FEW YEARS)
• YUKON/NORTH BC MOUNTAINS – DECLINING
• MACKENZIE DISTRICT- DECLINING
• ARCTIC TUNDRA-RISING ( ANOMALIES HAVE DROPPED 3 DEGREES SINCE 2010
• ARCTIC MOUNTAINS & FIORDS -RISING ( ANOMALIES HAVE DROPPED 3 DEGREES SINCE 2010)
TOTAL ANNUAL CANADA – DECLINING
SEASONAL PATTERN FOR CANADA AS A WHOLE SINCE 1998
Winter trend TEMPERATURE DEPARTURES ARE DECLINING
Spring trend TEMPERATURE DEPARTURES ARE DECLINING
Summer trend RISE IN TEMPERATURE DEPARTURES
Fall trend TEMPERATURE DEPARTURES ARE FLAT
All Canadian temperature data comes from the Environment Canada web page

Reply to  herkimer
January 20, 2016 8:05 am

“All Canadian temperature data comes from the Environment Canada web page”
Is this data ‘adjusted’ in any way prior to placement on EC’s website?

mebbe
Reply to  herkimer
January 20, 2016 9:22 am

From EC’s website;
“Data collection, processing, quality control checks and procedures have evolved and changed over the years since the earliest data was observed in 1840. Changes have been particular rapid in recent years. For example, the advent of automatic weather observing stations established a new set of challenges for quality control.
The vast majority of observational data is accurate but the database contains some incorrect values, which show up from time to time. Environment Canada continues to review quality control procedures, both as current data is observed and incorporated into the database, and retrospectively for historical data. Be aware that data can be erroneous and that some values may change over time as quality control procedures identify and deal with doubtful data.”

herkimer
Reply to  J. Richard Wakefield
January 20, 2016 7:21 am

Richard Wakefield
You said that Canadian winters have slowly trended to milder winters since 1900. This may be true when comparing the 1920-1930 era with today, but perhaps you should have noted that since 1998 the trend of winter temperatures is actually getting colder as you are probably aware. There are regional differences but on a national level the winters are trending cooler not milder for the last two decades .
The past 2014/15 winter set new cold temperature records across most of eastern Canada. February temperatures were the lowest since 1889 or 126 years in Quebec and new cold records were set in Montreal, Toronto, Ottawa, Hamilton and London. Some Maritime Provinces had double the normal amount of snow. Charlottetown had the highest amount of snow ever recorded, 18.1 feet of snow. Similar snow records were set in St Johns and Moncton. The Great Lakes and St Lawrence River Valley had the 4 th coldest winters in 68 years. Quebec and Ontario had the 10 th coldest and the Atlantic Coast provinces had the 16 th coldest The trend of Canadian annual temperature since 1998 is declining in 7 out of 11 climate regions. It is also declining on a country wide or National basis.

Reply to  herkimer
January 20, 2016 7:54 am

Correct, but from what I have seen in the data, we are still not as cold as we were in the 20-30s. The pause since 1998 is there in the winter numbers and the summer numbers.
I have started to post this data here:
https://cdnsurfacetemps.wordpress.com/table-of-contents/ottawa-data-station-4333/
I’m slowly updating that site. But 4333 station is current to 2015.

herkimer
Reply to  herkimer
January 20, 2016 9:32 am

Richard Wakefield
“Correct, but from what I have seen in the data, we are still not as cold as we were in the 20-30s.”
Canada wide I agree with you, but in the 2014 /2015 winter ,in Eastern Canada, there were many all time cold temperature and snowfall records set in all eastern Provinces . Some new records that were broken go back to 1889 like Quebec. February 2015 was the coldest on record for Toronto.

herkimer
Reply to  herkimer
January 20, 2016 9:42 am
herkimer
Reply to  herkimer
January 20, 2016 5:29 pm

Another reason why global warming records are meaningless and why NOAA never tells the complete picture.
http://www.cbc.ca/news/canada/prince-edward-island/charlottetown-breaks-snowfall-record-1.3053391

Gerald Machnee
Reply to  J. Richard Wakefield
January 20, 2016 9:24 am

Richard, have you done any graphs on the Arctic stations? The “experts” said the Arctic is warming “more rapidly”. They may also have said Canada is warming twice as fast as the rest of the world. But then in the briefing on Nov 23, they used data starting in 1948.

herkimer
Reply to  Gerald Machnee
January 20, 2016 9:58 am

GERALD MACHNEE
Temperature changes in Canada during the last 67 years per Environment Canada.
Lower Canada (excluding BC) I.18 C (51.3 % of total Canada area)
BC 1.8 C (10.4 % of total Canada area)
Arctic and North 2.06 C (38.3 % of total Canada land area)
CANADA TOTAL 1.6 C
Per NOAA, the GLOBAL LAND TREND 1948 -2014 is 0.19/DECADE which equates to 6.7 decades x 0.19 = 1.27 C in 67 Years
So Canada is not warming twice the world rate but only 1.6/1.27 or 1.25 times as fast and Lower half of Canada it is rising 1.18/1.27 =0.93 as fast as the globe( this is where most of the people live)
Only the Arctic region of Canada was warming about twice as fast as the globe . However I have noted that the annual temperature anomalies in the Canadian North have dropped about 3 degrees since 2010 indicating that Canadian Arctic is cooling too.

Reply to  J. Richard Wakefield
January 20, 2016 10:38 am

J Richard Wakefield:
I did the same thing from Alert,Nunavut to Medicine Hat, Alberta to Grand Forks, BC covering 82N to 49N. I found the same thing. TMax is often decreasing, some much the same and a few cases slightly increasing but TMin is LESS COLD. A good example is Medicine Hat where there is 125 years of continuous records. It is a virtual desert in southern Alberta that depends on irrigation to produce crops, without which it would be a grazing area with a grazing area loading of about 30 acres per animal unit.
https://www.dropbox.com/s/13b0jmek3vuqwjv/MedicineHatMeans.tiff?dl=0&preview=MedicineHatMeans.tiff
https://www.dropbox.com/s/73bzb5btpja32ms/MedicineHatExtremes.tiff?dl=0&preview=MedicineHatExtremes.tiff

Ian Cooper
Reply to  J. Richard Wakefield
January 20, 2016 6:17 pm

Richard, we have the exact same trends from our local data here in Palmerston North, New Zealand. Our best world class site goes back to June 1928. Our hottest summer T-Max records show a slow decline from a peak in 1934-35. If there is a strong La Nina next year we should see another “hot summer” here, but with a lower T-Max than the last major one in 1998-99. The winter trend here is same as yours, milder but with the odd cold one thrown in. It doesn’t seem to have held back the frosts down here near sea level though (my records go back 35 years). I have also recorded mountain snowfall numbers and quantity which shows a resurgence since the “warmest winter” on record, 2005.

Tom in Florida
January 20, 2016 5:47 am

Perhaps a last grasp for more funding grants which will most likely evaporate under a Republican President.

Notanist
January 20, 2016 5:50 am

Wasn’t there a recent post about the “ignoratio elenchi” fallacy? An argument that fails to address the issue in question?
Earth has been warming since the 1800s, about when the thermometer record begins, so any given year has a reasonable chance of setting a new high temp record. The real question skeptics should be asking is, “Yeah, and…???” The question isn’t, “is Earth getting warmer”, the question is, “Is it warming over and above natural variation?” The burden of proof is on them.

Eric
Reply to  Notanist
January 20, 2016 8:03 am

> any given year has a reasonable chance of setting a new high temp record
Makes a lot of sense. Records go back to about 1880– about 135 years. There are 135! (factorial) ways these could be ordered by average temperature. Let’s assume there is no trend and so all orderings are equally probable. The last two years would be the hottest in 133! * 2 of these orderings. So the probability that the last two years would be the two hottest is 133! * 2 / 135! = 2 / (134 * 135) = 0.01%. This isn’t a huge probability, but chance can’t be ruled out.

Reply to  Eric
January 20, 2016 8:23 am

Eric:
Your sums are wrong. They are based on your assumption that “there is no trend” but in reality the world has been warming from the LIA for centuries.
As Notanist says, “Earth has been warming since the 1800s” (and before) so recent years are the warmest.
The interesting thing is that the warming stopped ~18 years ago otherwise every year would probably be the warmest since the instrument record began.
Notanist also said

The real question skeptics should be asking is, “Yeah, and…???” The question isn’t, “is Earth getting warmer”, the question is, “Is it warming over and above natural variation?”

And the answer to that question is,
Recent warming started before the industrial revolution and has stopped at temperatures below the peaks of the Medieval Warm Period, the Roman Warm Period and the Minoan Warm Period. Nothing out of the ordinary has been observed to have happened to global climate that is not explained as being the same natural climate behaviour as has previously happened.
Richard

Knute
Reply to  Notanist
January 20, 2016 6:21 pm

Dr Carter would be proud that his line of thinking is being spread around.

Gerry, England
January 20, 2016 5:51 am

Who is surprised? With COP21 they were always going to claim 2015 as the warmest on record and make the required adjustments to make it so. And they will do their best for 2016 as well unless Mother Nature intervenes. The missing graph here is one with the surface and sat records together to show the growing divergence of late. Hence the attack on the sat records as it is starting to become obvious that their fiddling is creating the warming.

Russell
January 20, 2016 6:15 am
Jack Sanderson
January 20, 2016 6:43 am

If I understand the big picture correctly, NOAA’s “adjusted” surface temperature data now includes ocean temps—which is probably being heated up by cyclical submarine volcanoes or mega plumes such as our current El Nino. Of course, NOAA would have us believe the oceans are warming due to our over use of SUVs and electric blow dryers. Can’t somebody with some credentials offer up a current layman’s article about submarines volcanic impact upon ocean temperature? I found one in the NYT published in 1998 but we need to throw this in their face when they claim “the hottest year ever!”

JohnWho
January 20, 2016 6:45 am

2015 may well be the warmest year on THEIR records.
On the actual, honestly represented record, not so much.

herkimer
January 20, 2016 6:47 am

The detail annual global temperature data from NOAA for 2015 has not been released yet . However up the end of 2014 when 2014 was supposed to have been the warmest ever, the trend of global land area temperatures was flat for 10 years and the pause was clearly there for most land areas. So all the hype about ONE YEAR records is just that.
The trend of annual global land temperature anomalies since 2005 or the last 10 years has been flat for most regions of the globe or in a pause, but regionally there is cooling in Asia and North America and warming in Europe .
• Global -0.02 C/decade (flat)
• Northern Hemisphere -0.05 C/decade (flat)
• Southern Hemisphere +0.06 C/decade (flat)
• North America -0.41 C/decade (cooling)
• Asia -0.31 C/decade (cooling)
• Europe + 0.39 C /decade (warming)*
• Africa + 0.08 C/decade (flat)
• Oceania + 0.07C /decade (flat)
*The European warming was mostly due to warming of one year only(2014) The temperature anomalies for the period 2005-2013 were also flat (- 0.02 C/decade)
All data per NOAA CLIMATE AT A GLANCE web page

Pamela Gray
January 20, 2016 7:02 am

So. The Earth appears to be a bit hotter than previous years. How much is a “bit”? I wouldn’t want to live on the difference.
Wake me up if it is getting hotter when oceanic/teleconnected conditions should be making us cooler. Under current conditions, I would expect natural warmth.
zzzzzzzzzzzz…

Barry
January 20, 2016 7:19 am

I guess the POTUS has a global warming/anti-coal media announcement being prepared for sometime in the next couple of weeks? He’s preceded every other POTUS media announcement with an orchestrated “it’s worse than we thought” proclamation from his compliant pals at GISS and NOAA.

January 20, 2016 7:29 am
rbabcock
Reply to  Steve Case
January 20, 2016 10:22 am

Doesn’t this graph sum it all up ????

Gary
January 20, 2016 7:37 am

I’ll be turning 47 in a couple months. I remember the weather back in the 70s and I still live in my small home town. I really do not see all this record warmth. It seems more likely to me that the weather today is much more like it was back in the 70s. I am currently sitting and shivering in my living room. There is snow on the ground and it hasn’t been above freezing for days. (It was 8F a couple days ago.) I live in Arkansas so I’m not very accustomed to the cold. I like it warm so I notice when times are colder than usual. It’s cold. Trust me. With more snow and cold on the way, with February looming like an ice cube. Lord, end this winter and bring me spring! I don’t care how many talking mouths declare global warming. It ain’t warming nowhere near my house, and the summers have been mild of late. Blowing one’s hole does not change reality.

Reply to  Gary
January 20, 2016 7:44 am

Given a big enough hole…

Reply to  Gary
January 20, 2016 4:05 pm

Gary, I have been a surfer since the 50’s, and, when I go back to my old Sydney surfing beaches, I do not notice any change in sea levels, except for the usual tidal effects. Tidal swimming pools were constructed all along the NSW coastline, since the late 1880’s until the early 1900’s, and, none have been inundated.

Bob Burban
Reply to  John of Cloverdale, WA, Australia.
January 20, 2016 5:52 pm

Venice’s history is all-enveloping and the grandiosity of the architecture is as breathtaking as the city’s locale: smack in the middle of a vast lagoon. That the city’s massive stone buildings are built on soft sediments is something that is not generally appreciated. Some gravitational settling of these structures might be expected over several centuries, moreso since the city is within a seismically active region. But no, most commentators prefer more exotic reasons for rising water levels.
One way to capture the sense of that sinking feeling in Venice is by touring its ubiquitous art galleries and collections. Some oil painted streetscapes date back six centuries or so, and it’s quite a surprise to realize that water levels in some of these paintings look suspiciously similar to what is witnessed today. It’s quite an eye opener.

Harry Twinotter
January 20, 2016 7:41 am

[Comment deleted. Strike two for today. Do NOT label other readers “denhiers”. –mod]

Reply to  Harry Twinotter
January 20, 2016 8:33 am

Harry Twinotter:
There is no explaining necessary except from warmunists. As I said to another troll upthread,
Recent warming started before the industrial revolution and ~18 years ago stopped at temperatures below the peaks of the Medieval Warm Period, the Roman Warm Period and the Minoan Warm Period. Nothing out of the ordinary has been observed to have happened to global climate that is not explained as being the same natural climate behaviour as has previously happened.
Richard

BFL
Reply to  richardscourtney
January 20, 2016 10:16 am

Reminds me of the 100 year flood plain, then when a ~100 year flood happens, wow must be global warming. And they don’t even look at the 500 year and 1000 year flood history. A little “short sighted” to be sure.

Harry Twinotter
Reply to  richardscourtney
January 21, 2016 5:49 pm

Richard.
“Recent warming started before the industrial revolution and ~18 years ago stopped at temperatures below the peaks of the Medieval Warm Period, the Roman Warm Period and the Minoan Warm Period”
True in the universe you inhabit, maybe.
Me, I stick to what the established science says. I recommend you do the same.

Reply to  richardscourtney
January 21, 2016 11:44 pm

Harry Twinotter:
Perhaps you would tell us when you think warming from the LIA began in your universe and why it stopped over 18 years ago in ours?
Or is science too hard for you?
Richard

Alx
Reply to  Harry Twinotter
January 20, 2016 11:56 am

LOL!
The “deniers” have to explain why political shills like Gavin Schmidt have news conferences on cherry picked/massaged data, shoddy reasoning and speculation to disseminate poorly substantiated conclusions.
Yeah right, if you are up to it, that’s your job.

Harry Twinotter
Reply to  Harry Twinotter
January 21, 2016 5:46 pm

“[Comment deleted. Strike two for today. Do NOT label other readers “denhiers”. –mod]”
What bizarre double standards you have on this blog.

January 20, 2016 7:42 am

I am looking forward to the end of the Ice Age.

Rob Dawg
January 20, 2016 7:43 am

I certainly hope the irony of Gavin Schmidt, Ph.D., director, NASA’s Goddard Institute for Space Studies, ignoring the satellite data will not go unnoticed when it comes to future funding.

Reply to  Rob Dawg
January 20, 2016 11:09 am

+1

hunter
January 20, 2016 7:49 am

Hyping a weather event and pretending it is a climate trend seems sort of anti-science. But this is what NOAA and GISS are reduced to.

Mark Luhman
January 20, 2016 7:55 am

Considering we been living in some of the coldest times in the last 5000 years, one could only hope it might warm up a little. The little Ice age was the coldest it been for a very long time and we have a long way to go before the climate get back to normal, yet our government is tell us it the hottest ever, What a pile of adult male bovine fecal matter.

herkimer
January 20, 2016 8:00 am

These press releases are meaningless when one looks at what has really been happening in North America and more locally in United States . Instead of giving a balanced analysis of what the past climate trend is for their home country, they are just spreading climate alarmism which is inconsistent to the observable data . One year records are just anomalies, nothing else . The temperatures in US and North AMERICA are declining but NOAA and GISS will not call a press release to tell America the real facts.
The trend of United States annual temperature anomalies ,including the 2015 anomaly shows a decline over 18 years or since 1998.
WINTER (-1.44 F/DECADE) COOLING
FALL (-0.04 F/DECADE) COOLING (FLAT)
SPRING (+0.12 F/DECADE) WARMING (FLAT)
SUMMER (+0.24 F/DECADE) WARMING
ANNUAL (-0.22 F/DECADE) COOLING

herkimer
Reply to  herkimer
January 20, 2016 5:07 pm

Regional trend of US Annual temperature anomalies since 1998 including 2015 show that despite the 2015 record global temperatures, 6 out of 9 climate regions in United States show a cooling trend since 1998. Is it any wonder why Americans do not buy the alarmists climate change claims. It is simply not happening in most parts of the country.
• OHIO VALLEY -0.7 F/decade
• UPPER MIDWEST -1.2 F/decade
• NORTH EAST -0.2F/decade
• NORTHWEST + 0.4 F/decade
• SOUTH -0.4 F/decade
• SOUTHEAST -0.1 F/decade
• SOUTHWEST + 0.1 F/decade
• WEST +1 F/decade
• NORTHERN ROCKIES & PLAINS -0.5 F/decade
ALL data is from NOAA CLIMATE AT A GLANCE

January 20, 2016 8:30 am

They have renamed the media event to “Record-Shattering Global Warm Temperatures”: http://www.nasa.gov/press-release/nasa-noaa-analyses-reveal-record-shattering-global-warm-temperatures-in-2015

Reply to  dwisehart
January 20, 2016 1:33 pm

Lying liars, and the lies they tell.

Tom in Florida
January 20, 2016 8:58 am

If they are correct then let’s celebrate this warming!!!!! It was 44 F this morning at my house in Venice. Who wants that, who needs that.

clovis marcus
January 20, 2016 9:02 am

The slideshow doesn’t give the certainty level that 2015 was warmest. IIRC that is what tripped Gav up last year when he had to confess the certainty level was 38%.

grumpyguy
January 20, 2016 9:12 am

What is L.H.D?
(Thomas R. Karl, L.H.D.)
I keep getting either left hand drive or load, haul, dump.
It can’t be this easy, can it?

E.M.Smith
Editor
Reply to  grumpyguy
January 20, 2016 10:40 am

https://en.m.wikipedia.org/wiki/Doctor_of_Humane_Letters
An HONORARY degree. Doctor of Humane Letters.

Doctor of Humane Letters
The degree of Doctor of Humane Letters (Latin: Litterarum humanarum doctor; D.H.L.; or L.H.D.) is almost always conferred as an honorary degree, usually to those who have distinguished themselves in areas other than science, government, literature or religion, which are awarded degrees of Doctor of Science, Doctor of Laws, Doctor of Letters, or Doctor of Divinity, respectively.
Doctor of Humane Letters degrees should not be confused with earned academic degrees awarded on the basis of research, such as Doctor of Philosophy or Doctor of Theology, nor earned professional doctorates such as Doctor of Medicine, D.O., Doctor of Dental Surgery, Juris Doctor, Doctor of Ministry, etc.

Reply to  E.M.Smith
January 20, 2016 11:11 am

IOW, a political “award” (or reward.)

FJ Shepherd
January 20, 2016 9:20 am

Hot off the press:
http://www.theguardian.com/environment/2016/jan/20/2015-smashes-record-for-hottest-year-final-figures-confirm
You have to love the MSM for paying such close attention to this major global warming event.

Reply to  FJ Shepherd
January 20, 2016 1:35 pm

Yes, and not even a five second sound bite of any opposing view.

Kevin Angus
January 20, 2016 9:28 am

I can only hope that in some alternate universe those that read crystal balls are private companies whose funding depends on the outcome of their forecasts and anyone that alters records for personal gain shall be left to fend for themselves in the Arctic.

Steve Fraser
Reply to  Kevin Angus
January 20, 2016 9:36 am

Check Dante’s Inferno…

Tom Norkunas
January 20, 2016 9:41 am

In the midst of it all, El Nino and Global Warming notwithstanding, the shipping season on the Great Lakes ended today, with the 1000′ Paul Tregurtha coming into Duluth/Superior for winter layup. Looks cold to me.
https://www.facebook.com/KBJRKDLH/videos/10153973522381337/

Retired Kit P
Reply to  Tom Norkunas
January 20, 2016 1:06 pm

Thank you! Been trying to explain to Louisiana in-laws what cold is. Cold is not ice on the bird bath. Cold is ice fishing on the Great Lakes.

January 20, 2016 9:43 am

GISS & NOAA PR to the contrary not withstanding. . . .
A CASE STUDY SCENARIO:
Premise #1 – All the CO2 from fossil fuel alarmist’s have are the 5 IPCC assessment reports. {when independently viewed objectively, all research (not just the biased IPCC selected research), the science does not support the IPCC nor does it support alarm or even concern.}
Premise #2 – All the climate alarm focused politicians have to support them are activist science community members who are on the order of <1% of climate focused scientists. {see Legatees et al}
Premise #3 – The indifferent intellectual independence of USA is the weak point in the movement by supporters of alarm due to CO2 from fossil fuel.
Conclusion – The USA is immune to the tiny clique of subjective scientists who support alarm due to CO2 from fossil fuel, therefore the alarm movement has already imploded into self-supporting echo-chambers and the greater culture has moved on.
John

Janus
January 20, 2016 9:46 am

Two Comical Ali’s.
(For those who are old enough to remember the first Iraq war.)

Werner Brozek
January 20, 2016 9:46 am

Many may recall the announcements last year when the new record was only 0.02 above the previous year. Since it was less than the error bar of about 0.1, the certainty of a record was rather low. And with other years not far behind, GISS could only claim that 2014 was 38% certain of being the warmest. While the 38% was higher than for any other year, the other 9 years had a cumulative percent of 62% of being warmest.
Here are the numbers for GISS for last year and this year:
Last year: (I hope it formats half decently!)
1    2014   68
2   2010  66
3    2005  65
4     2007  62
5     1998  61
6      2002 60
7      2013  60
8    2003  59
9      2009  59
10   2006  59
This year
1 2015 87
2   2014  74
3   2010  72
4   2005  69
5   2007  66
6   2013  65
7   2009  64
8   1998  63
9   2002  63
10  2003  62
Note that 2015 of 0.87 is 0.13 higher than the 2014 value of 0.74. Also note how the 2014 value went up from 0.68 a year ago to 0.74 this year.
Due to a difference of 0.13, the claim may be made that the certainty of a record is more than 99%.
In contrast, RSS has 2015 at 0.192 below 1998.
UAH6.0beta4 has 2015 at 0.216 below 1998.
So it seems that we can be over 99% certain that neither RSS nor UAH6.0beta4 set a record in 2015.

Editor
Reply to  Werner Brozek
January 20, 2016 10:05 am

> Last year: (I hope it formats half decently!)
You need to use <pre>, see the test page (link on top nav bar):

1    2014  68
2    2010  66
3    2005  65
4    2007  62
5    1998  61
6    2002  60
7    2013  60
8    2003  59
9    2009  59
10   2006  59

This year

1   2015  87
2   2014  74
3   2010  72
4   2005  69
5   2007  66
6   2013  65
7   2009  64
8   1998  63
9   2002  63
10  2003  62
11
12
Werner Brozek
Reply to  Ric Werme
January 20, 2016 11:45 am

Thank you!

Janus
January 20, 2016 9:52 am

This is a recount of the original Comicsl Ali’s moments. May be these two clowns will follow the suit after the change in the White house:
“The moment when Saddam Hussein’s faithful minister of information, Mohammad Said Sahhaf, finally accepted that the game was up is revealed today by The Telegraph.
In the dying days of the regime the indefatigable minister, dubbed “Comical Ali”, had haunted a radio studio in Baghdad, urging engineers to carry on pumping out Saddam’s propaganda.
Even after the statue of Saddam was toppled on April 9, Mr Sahhaf refused to accept that Saddam’s era was over. But in the early hours of April 10, with the sound of battle raging ever closer to the studio, in the al-Adhamiyah district, even Mr Sahhaf headed for the exit.
“Sahhaf slowly removed his black beret,” recalls Raibah Hassan, 35, the manager of the Hikmat studio, the last person to have seen Mr Sahhaf in public. “He folded down the epaulettes on his military jacket to hide his rank and then he reached for a red and white kaffiyeh scarf.
“He wrapped it around his head as he told us to keep on re-broadcasting until 3am. He said goodbye, and then disappeared out of the back door.”

Reply to  Janus
January 20, 2016 1:40 pm

comment image

bit chilly
Reply to  dbstealey
January 21, 2016 11:54 am

good effort dbstealey ,that needs to be spread far and wide 🙂

Wayne
January 20, 2016 9:56 am

I live in the high desert in So. California, we had a very mild winter last year but we also had the coolest summer since I started running my own weather station(15 years) only 3 days of 100 degrees or more last year with a High of 101.5 degrees. We had many days that it rained although many times we only got about a tenth of an inch, the most was 1.5″ in a day. So far this winter has been much colder than last winter with a mean December temperature about 6 degrees lower this last December. So far only 1.3 inches of rain this January, wonder if the El Nino is going to be a bust.

Logoswrench
January 20, 2016 9:58 am

Record high. So the earth has never been this warm? Or are we counting from the beginning of the universe ie (1948 when the first narcissistic babyboomer was born).?

Simon
January 20, 2016 10:03 am

I’m glad that the media is reporting that 2015 was the hottest year on record. An astute observer would notice some cognitive dissonance. Where are all the catastrophes? If it is so dire, one would think that the changes would be obvious.

Kev-in-Uk
Reply to  Simon
January 20, 2016 12:39 pm

But they are adjusting for that too! e.g the UK Metoffice using storm names now for every little fart of wind or low pressure coming up from the Atlantic! (and of course our wettest December EVAH!)

F. Ross
January 20, 2016 10:04 am

“GISS and NOAA to Announce 2015 “Record High” Global Temperatures…”
Anyone really surprised? Anyone…?

AndyG55
Reply to  F. Ross
January 20, 2016 10:48 am

This is very old news.
They announced it last January, it was just a matter of fabricating the data to meet the memo.

January 20, 2016 10:08 am

Gavin Schmidt and NASA GISS have been caught with their hands in the cookie jar. You do not even need the wayback machine (yet), because the 2014 hottest ever PR is still up in the NASA site, if anybody wants screen grabs.
The January 2015 announcement about hottest ever was an anomaly of 0.64C. The presentation from today plainly labels the 2014 anomaly as 0.74C. Amazing how 2014 changed in 2015.

FJ Shepherd
Reply to  ristvan
January 20, 2016 10:21 am

It was simply an adjustment. Gavin could explain it, surely, by saying, “We do it all the time.”

Reply to  ristvan
January 20, 2016 10:32 am

Correction. That was Nasa 2014 to NOAA 2014 in 2015 per the presentation. I will dig out Nasa 2014 in 2014 to Nasa 2014 in 2015, which should reflect the Karlization of SST in ERSST4.0 from 3.0.

Reply to  ristvan
January 20, 2016 10:41 am

Found it. Sure enough, the Karlization shows. I will put together a note for AW to post.

Reply to  ristvan
January 20, 2016 2:21 pm

Illustrated post composed and sent to AW. Undeniable, to mint a phrase. Turns out 2014 anomaly is still +0.1C delta, manufactured in 2015 by Karl and Schmidt.
As Will Rogers observed, ‘Its a good thing we don’t get all the government we pay for.’

Frank Kotler
Reply to  ristvan
January 21, 2016 12:49 am

See the 1997 SOTC… before it disappears!

Steven Hill (moved to Alabama, warmer here)
January 20, 2016 10:23 am

We are all doomed, ban all manufacturing asap before it’s too late…..it was 17 here in Alabama night before last. Please send global warming.

601nan
January 20, 2016 10:34 am

If the IRS could collect taxes from NASA and NOAA on the “yearly increase temperature anomaly” that points to increase industrial activity and increase of profits and underpayment of taxes, then the US would be on its way to a balanced Federal budget and pay down the national debt.
Let the next administration policy wonks chew on this.
Ha ha

nc
January 20, 2016 10:43 am

Right at the end of the CBC Canadian Broadcasting Corporation breathless news release on warmest record is this little tidbit
Satellite measurements, which scientists say don’t measure where we live and have a larger margin of error, calculate that last year was only the third hottest since 1979.”
http://www.cbc.ca/news/technology/2015-record-heat-1.3411797?cmp=rss

January 20, 2016 10:44 am

In reality, global temperature is insensitive to increasing atmospheric CO2; the global warming crisis exists only in fiction and falsehood.
The current El Nino warming blip is temporary and will disappear in about a year.
Earth temperatures have not warmed significantly in about two decades despite increasing atmospheric CO2.
The warmists “solved” this contradiction in their global warming meme by falsifying (“adjusting”) the surface temperature data record.
http://realclimatescience.com/wp-content/uploads/2015/12/2015-12-18-12-36-03.png

Toneb
Reply to  Allan MacRae
January 20, 2016 11:46 am

Allan:
1st thing: the US is not the planet – nor even close.
Nor is GISS the only global temp database.
Yes, the extreme temps currently are exacerbated by the EN but it rides on TOP of the AGW signal.
http://blog.chron.com/climateabyss/files/2013/01/GISTEMPjan13.gif
Whether EN or LN the ave global temp just keeps rising.

BruceC
Reply to  Toneb
January 20, 2016 1:19 pm

What is this AGW signal?

Toneb
Reply to  Toneb
January 20, 2016 4:02 pm

“What is this AGW signal?”
Err, the slope bottom left to top right.
Unless you think that ENSO is a perpetual heat pump and each EN “naturally” makes the ave global temp higher than the last one.
Heck, even works for Nina’s too.

Robert B
Reply to  Toneb
January 21, 2016 2:27 am

Toneb, you are missing information. Could you supply the necessary details. I’m a bit worried that it is in a folder called “climateabyss”.
!st thing: Its an example to the fudging done to the US data. Its not there as evidence of global temperatures.
2nd: The temperatures are not exacerbated by the El Nino. Its just a correlation.
3rd: There are other databases but the only ones not relying on the same data show a pause that shouldn’t have happened.
I’ll just remind you that in Hanson’s 1988 Scenario C, rapid curtailment emissions so that net forcing ceases to increase after 2000, ever year after is close to being the hottest on record.comment image

Marcus Holm
Reply to  Toneb
January 21, 2016 8:06 am

Robert B, you said “a pause that shouldn’t have happened”. The two largest drivers of natural temperature change were pushing to cool the planet — we had a long La Niña (ENSO) and a long and deep solar minimum. In addition, there is evidence that the oceans absorbed more heat than usual. All this, and the temperatures were still merely flat (or flattish, depending on the analysis) rather than unusually cold.
The pause is a cooling that didn’t happen because something else was warming the planet up.

Robert B
Reply to  Toneb
January 21, 2016 2:00 pm

Marcus Holm

The two largest drivers of natural temperature change were pushing to cool the planet — we had a long La Niña (ENSO) and a long and deep solar minimum.

La Nina doesn’t cause cooling. There is just a correlation.
Does the Sun actually do anything or not?
That modeling that diminishes the importance of variations of the Sun told us that the pause shouldn’t have happened.
Can we have some consistency here? Do human emissions trump nature or not? I’m a fan of there being a 60 year period of oscillations obvious in the data probably due to the oceans by a mechanism that is poorly understood. Taking that away from the data leaves evidence of warming since the 19thC but even after a lot of fudging, no obvious correlation with massively increasing emissions but merely another natural warming period of centuries in length (end of the LIA).
I’m far from certain of that but certain that the data is more consistent with it than Thermageddon.

Marcus Holm
Reply to  Robert B
January 21, 2016 11:01 pm

La Nina doesn’t cause cooling. There is just a correlation.
Does the Sun actually do anything or not?
That modeling that diminishes the importance of variations of the Sun told us that the pause shouldn’t have happened.
Can we have some consistency here? Do human emissions trump nature or not? I’m a fan of there being a 60 year period of oscillations obvious in the data probably due to the oceans by a mechanism that is poorly understood. Taking that away from the data leaves evidence of warming since the 19thC but even after a lot of fudging, no obvious correlation with massively increasing emissions but merely another natural warming period of centuries in length (end of the LIA).
I’m far from certain of that but certain that the data is more consistent with it than Thermageddon.
Robert B,
La Niña is when a huge tract of Pacific Ocean surface is in a relatively cool state. During this phase of the oscillation, it is indeed colder in that part of the world, with a myriad of consequences like less rain in California and whatnot. “Just a correlation” doesn’t mean anything in this context. ENSO is what it is.
There’s no inconsistency in identifying the effects of natural variability alongside trends caused by anthropogenic carbon emissions. It’d be stupid not to. The fact remains that no one has managed to build a climate model that manages to match the temperature record that doesn’t include anthropogenic carbon.

Reply to  Allan MacRae
January 21, 2016 3:18 am

ToneB:
Your graph starts at 1975.
How do you explain the global warming pre-1940, before the rapid increase in fossil fuel consumption?
How do you explain the global cooling from ~1940 to ~1975 as fossil fuel consumption strongly accelerated? False fabricated aerosol data? Hah!
How do you explain the Pause, almost two decades in duration, even as fossil fuel consumption continued to increase?
Your positive correlation of rising global temperature with increasing atmospheric CO2 only exists for ~1970 to ~1995, about 25 years out of the past century or more. Your global warming anxiety is not supported by the evidence.
The rational explanation is that the observed minor global warming and cooling periods are overwhelmingly natural and increased atmospheric CO2 is an insignificant driver of global climate.
If, as we predicted in 2002, global cooling recommences in the next few years, how will you explain that? More aerosols?
Regards, Allan,

Reply to  Allan MacRae
January 22, 2016 2:59 am

This post is re-dedicated to ToneB and Mark Johnson:
http://wattsupwiththat.com/2016/01/06/poll-73-of-americans-reject-agw-but-you-wouldnt-know-it-from-the-headline/comment-page-1/#comment-2114678
[excerpt]
Two decades ago, the question was:
Is global warming alarmism simply false or is it fraudulent?
Now, after the Mann hockey stick fiasco, “Mike’s Nature trick”, “Hide the Decline”, the fabricated aerosol data used to false-hindcast the warming alarmists’ climate models, the Climategate emails, and the many false “adjustments” of the surface temperature data record, there is no question:
Global warming alarmism is clearly fraudulent – in financial terms, it is one of the greatest frauds of all time.

January 20, 2016 10:46 am

Sadistics.

H.R.
Reply to  William McClenney
January 20, 2016 11:04 am

+1 [grin]

Bruce Cobb
January 20, 2016 11:14 am

I’ll see their one-year “uptick” in warm-biased tamperatures and raise them 18 years, 8 months of zero warming as of now.

Marcus Holm
Reply to  Bruce Cobb
January 21, 2016 11:14 am

I see cherry-picking hasn’t gone out of fashion in this crowd…

Mark Johnson
January 20, 2016 11:33 am

And Tisdale won’t tell us that RSS lags El Nino. Say bye bye to the fake pause next year.

Mark Johnson
Reply to  Bob Tisdale
January 22, 2016 1:18 pm

Carl Mears, RSS:
The author ignores the fact that record temperatures often occur in the year following an El Nino, because the global temperature response tends to lag the El Nino SST anomaly by 3-4 months.
http://climatefeedback.org/evaluation/james-taylor-2015-was-not-even-close-to-hottest-year-on-record/

Donald
Reply to  Bob Tisdale
January 24, 2016 6:39 am

Bob, I won’t speak for Mark, but you have recently both mentioned the lag, as well as explicitly compared 2015 to the two warmest post-El Nino years in the satellite products, pointing out the fact that 2015 was not a record year in those products. You even predicted that Schmidt and Karl would for whatever reason not also make that observation.
So which is it – did you forget that 2015 is not really comparable to post-El Nino years, or were you misrepresenting the satellite product year comparisons?

Reply to  Mark Johnson
January 21, 2016 10:07 am

What a dumb comment. Even if the temperatures should shoot up this year, the pause would not be “undone” – it would remain in the record as a piece of evidence that the climate models fail to explain.

Mark Johnson
Reply to  Michael Palmer
January 22, 2016 1:30 pm

It’s fake because it ignores all the surface temperature records and ocean heat content. Soon, even the fake pause will be gone and you will have to resort to ‘it hasn’t warmed since 2015’ meme.

Donald
Reply to  Michael Palmer
January 24, 2016 6:16 am

Michael, the pause you are claiming is pure numerology; it only exists if you choose a very specific starting point for your linear trend using the satellite products.
Given that the linear trend is positive over 14, 15, 16, 17, 20 and 21 years – meaning there is a positive trend for both shorter AND longer periods of time – it becomes clear that the pause is an artifact of your methodology.

Reply to  Donald
January 24, 2016 6:31 am

Donald,
One year ago no one disputed the so-called “pause”. The IPCC accepted it, and only a few cranks argued about it. Global warming stopped many years ago.
But now the climate alarmist contingent is convinced that global warming never stopped. To say they’re nuts is unfair; most of them are just being led by an invisible ring in their nose, called the ‘narrative’.
The same thing happened with satellite data, which is the most accurate data by far. One year ago satellite data was accepted by scientists on both sides of the debate. But now that ring in the public’s nose has been pulled in a different direction: satellite data is bad.
You’re doing exactly what they want: being their parrot. You can’t even see it. But here we know better. The facts haven’t changed from last year to this year. You’re just being told what to think, and you actually believe it.

Donald
Reply to  Michael Palmer
January 24, 2016 6:54 am

dbstealey, instead of speculating on my motives for posting, or attributing to me things that other people may or may not have said, why not just address the content?
Even last year, the linear trends using either UAH or RSS products also showed a positive slope if using starting years both prior to and following 1998.
Has there been less warming in that timeframe, in these products, than predicted? Absolutely. But the ‘pause’ that is being discussed here is not the actual trend, but rather the artificial ‘no warming for 18 years x months’ that is directy related to calculating a linear trend using a high high value in the dataset as a starting point.
My point being that we should be able to honestly discuss facts, without misrepresentation, even if only accidentally.

Reply to  Michael Palmer
January 24, 2016 7:37 am

Mark Johnson,
Your comment is simply a baseless assertion. The surface station record is so far out of tolerance that it is worthless: the majority of surface stations are from 2º to 5º off, and OHC is not rising.
@Donald:
It was the arch-alarmist Dr. Phil Jones who initially designated the 1997-98 start time for determining statistically whether global warming had stopped. When he said that, he acknowledged that it had stopped, but he said more time was necessary to confirm what’s now called the “pause”. Apparently Jones was confident that given 15 years, global warming would resume. It hasn’t. Global warming stopped more than 18 years ago.
Global warming has been happening in fits and starts, naturally, since the LIA. There is nothing indicating that it is accelerating — which would happen if measurable AGW was being added to natural warming.
The new narrative requires the alarmist crowd to attack satellite data, and to deny that global warming stopped — as it also did between the 1940’s and ’70’s. But the real temperature record shows that’s false.
You say you want facts, but you really don’t. You want to convince skeptics of the man-made global warming scare that what’s being observed is wrong; that both RSS and UAH satellites, plus 17,000 radiosonde balloon measurements are in agreement, but they’re wrong somehow, and the 2º – 5º errors in surface station measurements are better.
Baseless assertions are fine for blogs like realclimate. Here we prefer facts. Parroting the new narrative is just another baseless opinion. The facts are that satellite data is far more accurate than surface stations, and the “pause” is ongoing, and the ‘dangerous AGW’ scare is politics, not science.

Donald
Reply to  Michael Palmer
January 24, 2016 8:26 am

dbstealey,
You stated the following: “Global warming stopped more than 18 years ago.”
Just so everybody is talking about the same thing: how do you know this? By what metric do you base your conclusion that global warming has “stopped”?
I suspect it goes back to exactly what I was referring to above, that the claim is based on a least squares linear trend calculation, based on the satellite LT products, starting in an 8-month period around 1998, but maybe your metric is different.

Donald
Reply to  Michael Palmer
January 24, 2016 8:35 am

Further to my previous post: something that seems to get ignored or forgotten by just about everyone in these discussions, is that temperature anomalies are themselves proxies to what is really of interest: heat energy contained in the biosphere.
Temperature at different levels of the atmosphere, in water, even in solids materials, is just a secondary method of describing that total heat content. Using only a single temperature measurement to describe the total heat content of the system will always be inherently flawed: that is why ignoring all but one type of data-set is not a valid way of looking at the system. That same argument goes for those only looking at surface data sets as well as those only looking at lower troposphere datasets.

Reply to  Michael Palmer
January 24, 2016 8:52 am

@The Donald:
Let me introduce you to a guy here named Gates. He parses everything like that, bending himself into a pretzel in a desperate attempt to convince everyone that global warming is chugging along like it always was.
Face it, global warming stopped many years ago, and saying that’s “pure numerology” won’t change that fact. Planet Earth is the ultimate Authority, and she’s making a laughingstock out of the climate alarmist crowd: not one scary prediction those fools ever made has ever come true. No exceptions.
When one contingent has been wrong 100.0% of the time, reasonable and rational folks will decide that their conjecture is wrong.
“Dangerous AGW” is nonsense. It’s an emo-based belief system that looks preposterous to normal, rational folks.

Donald
Reply to  Michael Palmer
January 24, 2016 9:27 am

dbstealey,
Why address that last remark to me, since it had nothing whatsoever to do with anything I’ve written above?
I will ask again though: on what metric or metrics are you basing your claim that “Global warming stopped more than 18 years ago”?

Reply to  Donald
January 24, 2016 9:28 am

Why address that last remark to me, since it had nothing whatsoever to do with anything I’ve written above?

I quoted your words.

Donald
Reply to  Michael Palmer
January 24, 2016 9:51 am

dbstealey,
The only words of mine you quoted were “pure numerology” – your response to which was, essentially, “I am right, you are wrong”. (You also quoted somebody else’s words, but I assume you did not mean that section of your post to be a response to me.)
The substance of your post, however, had nothing to do with the substance of what I wrote.
Again, I will repeat – you made a claim of fact: “Global warming stopped more than 18 years ago.”
I am not even asking you to support the claim – all I am asking is the following: what is the metric upon which you are basing the claim?

RACookPE1978
Editor
Reply to  Donald
January 24, 2016 9:59 am

Donald

Again, I will repeat – you made a claim of fact: “Global warming stopped more than 18 years ago.”
I am not even asking you to support the claim – all I am asking is the following: what is the metric upon which you are basing the claim?

Those are a long-established metric using the world-wide satellite measurements of the lower atmosphere from pole to pole, across all oceans, lands, deserts and snow fields. (99x the area coverage of the single NASA/GISS-adjusted US ground station miss-metric.)
From the latest measurement made at the end of each month, the analysis goes BACK in time until a flat line of global average temperature can no longer be calculated. No cherry-picking of data, no adjusting of data by government-paid bureaucrats, all worldwide data accepted and used, the same common analysis method every month. The same single simple question: “How long from today’s date has the global average measured temperature been flat?”
And, at this point in time, that length is slightly over 18 years.

Reply to  Michael Palmer
January 24, 2016 10:18 am

Donald,
You’re new here. If you read this site for a while with an open mind, you will understand a lot more.
To answer your question, there are several metrics of differing quality. The best data comes from satellites and radiosonde balloons. Both RSS and UAH are corroborated by balloon data. For a much more complete explanation put ‘Monckton’ into the search box.
Sea surface temperatures are also not following the ‘dangerous AGW’ narrative. Search for ‘Tisdale’. Ocean heat content also isn’t following the script.
At the bottom of the credibility scale are the surface stations. Some folks are insisting they can tell global T to within tenths or hundredths of a degree based on land data. That is ridiculous. Further, land covers only 29% of the globe. Temperature stations are very sparse in many locations. Most have been eliminated over the past three decades. And the methodologies used are nonsense; averaging temperatures where there is no data, and other questionable inventions.
When the Climategate emails were made public there was a ‘Harry_read_me’ file made public with them. The programmer admitted that he was fabricating many years of temperature data, based on nothing but invented numbers that he wanted to use.
The global warming scare is based on that sort of pseudo-science. Alarmist scientists like Michael Mann and Gavin Schmidt used to debate skeptics. But no more. The alarmists lost every debate, because they could not make a credible case. Now they hide out and refuse to debate.
The global warming scare is no different than the South Sea Island bubble, or the Dutch Tulip craze. It is a mass delusion, propped up by more than a billion dollars in federal grants every year, and that’s just the U.S. If I had a billion dollars to hand out every year I could get lots of scientists to write peer-reviewed papers explaining how the cow jumped over the moon.
All honest scientists are skeptics, first and foremost. Anyone questioning the AGW scare from a skeptical perspective can see that it’s politics, not science. Personally, I think AGW exists. But it is too small to measure; there are no measurements quantifying AGW. Since it’s too small to measure, it is a non-problem.
It’s clear that the ‘dangerous AGW’ narrative supports an agenda. They don’t admit what the agenda is. But honest science isn’t part of it.

Donald
Reply to  Michael Palmer
January 24, 2016 11:17 am

Thanks RACookPE1978,
I assume by “global average measured temperature been flat” you mean “least squares linear trend line has a zero or negative slope”. If not, please correct me.
And from the rest of what you said, I understand you are using either UAH or RSS products, which is what I understood earlier, as well.
However, in addition to the actual calculation method (linear trend on UAH data) you have added an artificial constraint, which is equivalent to saying “as my starting point, use the only the oldest anomaly value in the past that gives me a zero or negative slope.” I understand that this might not be obvious, but it is inherent in your rule.
But a linear trend is only a mathematical construct: it does not mean anything without context.
Which is why I mentioned earlier that even using the UAH product dataset, using today or even last year as the end points, the slope of the trend line is positive going back 15 years, 16 years, and as many years back as you can go until to satellite datasets begin – and the slope will only be negative for about an 8 month period around 1998.

Reply to  Michael Palmer
January 24, 2016 2:21 pm

Donals says:
…I mentioned earlier that even using the UAH product dataset, using today or even last year as the end points, the slope of the trend line is positive going back 15 years, 16 years, and as many years back as you can go until to satellite datasets begin – and the slope will only be negative for about an 8 month period around 1998.
That’s completely false:
click1
click2
click3
I have lots more like those. Just ask and I’ll post them.

Donald
Reply to  Michael Palmer
January 24, 2016 8:02 pm

dbstealey,
I mentioned 15 years and more of the UAH dataset – the ranges you used were for 2002 to 2015 – or less than 14 years – for non UAH datasets, and for the UAH dataset, you provided an excerpt of from 2002 to 2008 – not even close to the time period I was making reference to. I expect those were honest mistakes, but mistakes on your part nonetheless.
Also, and as you quoted, I said “even using the UAH product dataset, using today or even last year as the end points, the slope of the trend line is positive going back 15 years, 16 years…” Yet the majority of the extracts you provided did not even reference the UAH dataset, so basically, you once again responded to my post with a non sequitur, and an irrelevant one at that: you both misrepresented the time frame to which I made reference, as well as the dataset to which I made reference in my very specific statement.
If you want to look at the web site you used above, see here for the UAH Graph Play around with it – try to come up with a negative trend for the periods ending in 2014 or 2015 in the UAH lower troposphere global mean set.
It is likely that you don’t even realize it, but by choosing the start and end dates as you did, you actually illustrate the point I was making earlier very well: finding a linear trend in a data set on its own is almost meaningless: as you have shown, you can find both positive and negative trend lines overlapping each other.

Reply to  Michael Palmer
January 25, 2016 10:06 am

Donald,
I agree, you can find positive and negative trends. I also agree that they are meaningless, as you say. There is no proof, or even any convincing evidence that global temperatures can be measured accurately to tenths of a degree, much less hudredths. But that’s what the alarmist crowd is using for their argument.
You also used an older version of UAH, which has been corrected in 6.0. Now RSS and UAH are converging to the same measurements.
But picking past start dates is entirely proper. Dr. Phil Jones does it, and he’s an arch alarmist. For example, if parents of a 10-year old boy notice that he is the same height today as he was at seven years old, they will say he hasn’t grown in 3 years. Seven is their start date. As Lord Monckton states, every month the length of the “Pause” in the RSS graph is calculated as the longest period of months, ending in the most recent month for which data are available, during which no global warming has occurred. That is the right way to do it. The boy stopped growing 3 years ago; global warming stopped 18 years ago.
The endless predictions in the late ’90’s were that runaway global warming would cause climate catastrophe; Polar bears would be decimated, Manhattan, Florida, and South Sea islands would be submerged, Polar ice would vanish, and many other scary predictions were confidently asserted.
They were all wrong. Every one of them. None of the alarming predictions have ever happened.
Folks who understand human nature can see what’s going on: natural climate variability has been made into this fake scare with the assistance and connivance of the media, and our ‘community organizer’ president, and the numerous scientists and universities that are hooked on the billion dollars that are handed out every year to ‘study climate change’. It is a massive hoax, intended to get a carbon tax passed and to amass political power.
I would be among the first to admit it if there was a real problem with the rise in CO2 (the basic argument of the alarmist crowd). As a skeptic, knowledge is the most important goal. I’ll admit it if I’m wrong. Science completely fails if there’s no skepticism, and that’s the one thing you cannot find in the proponents of the ‘dangerous AGW’ (DAGW) group. None of them are scientific skeptics. Thus, what they’re doing is not science.
It’s fine to discuss the science aspect of ‘climate change’. It’s interesting. But nothing being observed now is either unusual or unprecedented. Current temperatures and other parameters have been exceeded in the past, repeatedly, and by a much greater degree. That happened when CO2 was ≈280 ppm. All we are observing is natural variability in action. In fact, the past century and a half has been unusually benign.
Regarding the CO2 question, it has become clear that the rise in CO2 is a net benefit. More is better. There is no identifiable global damage or harm from CO2, thus it can be said that the rise is “harmless”. It is also beneficial to the biosphere: the planet is measurable greening due to the rise in CO2. Agricultural productivity is rising in step with CO2. And it doesn’t take much. CO2 has risen by only one part in 10,000 over the past century. There is no observed downside.
They are lying, Donald. Different people have different motives for lying about the ‘carbon’ scare. But the bottom line is that the climate alarmist crowd is flat wrong. It’s said that when an honest man is wrong, after demonstrating that he is wrong, he either stops being wrong or he stops being honest. They aren’t honest, Donald. Don’t you see that?

Donald
Reply to  Michael Palmer
January 25, 2016 5:58 pm

dbstealey,
Once again, you are responding to my post with a large number of distractions: I cannot comment on what Monckton may or may not have said, or how you are interpreting other people to have used cherry picked data; nor will I dispute the validity of any particular dataset – that would be a fool’s errand.
What I have been able to glean, after much prodding, is that the metric being used to define this numerical pause in warming is the following a) UAH data, b) a least squares linear trend and c) using the final months of 1997 as the starting point for calculating the linear trend.
Using the very data that is being depended upon to make the claim (UAH, either 5.6 or 6.0 beta) and the metric as described above, there are either zero months (ver 5.6) or 7 months (6.0 beta) where the linear trend ending in 2015 in not positive.
That means all the trend lines starting prior to mid-1997 show positive slopes, and all the trend lines starting after January 1998 show positive slopes. If linear trend slope must be interpreted, without context, as being equivalent to warming or lack of warming, it is clear that the argument for using the trend line as a stand in for warming is completely flawed: It requires us to believe that there has been warming from 1995 until today, also from 1996 until today, and from 1998 and 1999 until today, but that there has been no warming for the specific 7-month period in 1997 until today.
This is not a hard concept to understand; looking at a graph, and fitting a trend line starting at a particularly high or low point in the graph is obviously not going to be a particularly accurate way to understand the underlying signal.

Reply to  Donald
January 25, 2016 9:10 pm

@ the Donald:
See what I get for trying to be rational and unemotional? I tried to respond with facts. I tried to discuss verifiable science with you. I put in more time than I should have, hoping to get a reasonable discussion going. But all you did is parrot verifiable misinformation, like this:
…there are either zero months (ver 5.6) or 7 months (6.0 beta) where the linear trend ending in 2015 in not positive.
That is contradicted by reams of empirical evidence. ‘Seven months’??? Maybe on your planet. But here in the real world there has been no global warming for this entire millennium. None.
Thus, your baseless assertions fail. Only seven months of no temperature rises?? Put down the cooking sherry, Donald, and listen up:
Global warming stopped many years ago. Even the IPCC admits that. To be charitable, let’s take the current millennium. There has been no global warming at all.
CO2 has risen non-stop for many decades now. But global warming has stopped. Therefore, CO2 simply lacks the warming effect that the climate alarmist crowd claims it does. Could they be any less credible? But you still believe them!
That’s what I get for trying to discuss science with someone who is obviously an eco-religious True Believer. Your mind is made up, and closed tighter than a submarine hatch. I foolishly took the time to patiently explain the value of scientific skepticism to you. But it was rain off a duck’s back.
Why don’t you take your belief in pseudo-science over to Hotwhopper or realclimate. They just love that kind of anti-science nonsense. But here at the internet’s Award Winning BEST SCIENCE & TECHNOLOGY site, we want facts, not baseless assertions like yours.
‘K thx bye.

Reply to  Michael Palmer
January 25, 2016 9:25 pm

“Thus, your baseless assertions fail. Only seven months of no temperature rises?? “
No, Donald is exactly right. I showed the relevant plot here. I’ll show it again
http://www.moyhu.org.s3.amazonaws.com/2016/1/trend0.png
It shows the trend you get if you start from the x-axis year to present. The bottom data is RSS, and where the red circle is is the Monckton pause. The light green curve just above is UAH V6. It dips below zero for a period of about seven months in late 1997. If you start from any other month, the trend is positive. And of course, UAH5.6 has very positive trends for any start year.

Donald
Reply to  Michael Palmer
January 26, 2016 2:41 am

dbstealey,
I neglected in my last post, to link to the UAH data sets.
Here is the 5.6 dataset: http://www.nsstc.uah.edu/data/msu/t2lt/uahncdc_lt_5.6.txt
And here is the 6.0 beta data set: http://vortex.nsstc.uah.edu/data/msu/v6.0beta/tlt/tltglhmam_6.0beta4.txt
You may run a linear trend analysis on this data; you will find, after running this calculation using every month in the data sets as starting points, that there are exactly 7 months in the version 6.0 beta data set where the trend line ending in 2015 is not positive.There are no such months in the version 5.6 data set.
I can help you set this up if required.

Donald
Reply to  Michael Palmer
January 26, 2016 2:53 am

dbstealey,
BTW, this:
Donald wrote “…there are either zero months (ver 5.6) or 7 months (6.0 beta) where the linear trend ending in 2015 in not positive.”
dbstealey responded: “That is contradicted by reams of empirical evidence. ‘Seven months’??? Maybe on your planet. But here in the real world there has been no global warming for this entire millennium. None.”
You’ve just made the specific error that I spent a number of posts trying to explain, conflating the term “linear trend” with “warming”. A linear trend in a data set does not necessarily mean warming. It does not necessarily mean cooling. It is simply a mathematical relationship between a set of bounded data points.
Because you did not understand this, I will state clearly that by pointing out that the trend lines all had positive slope, with the exception of the set of the last 7 months of 1997, I made no interpretation about whether there was warming in any of this periods (I also mode no interpretation that there was not).
It is important in these discussions to be very clear when writing, and to not insert one’s own preconceptions when reading. Obviously, I could have been clearer – let me know if I need to further clarify those posts.

Reply to  Donald
January 26, 2016 9:28 am

Donald,
Sorry, I missed what you were saying at first. So you take every month and compare the slope? And you accuse me of cherry-picking?? Why not take every quarter, too? Just so you get what you want, eh?
During this entire debate skeptics have remained constant and on point. The original start year (actually, 1997-98) was specifically designated by an arch-alarmist, Dr. Phil Jones (of Climategate infamy). He admitted that global warming had stopped, but then he qualified it: to be statistically sound (at the 95% confidence level) global warming would have to remain halted for 15 years, beginning at ’97 – ’98. No doubt Jones thought that gave him plenty of wiggle room, because he was sure global warming would resume well before the 15 years was up.
Jones was wrong. It’s now been 18+ years of no global warming. I can help you if you still don’t understand this. Better yet, read Lord Monckton’s articles here. (The search box will find them all, just put in ‘monckton’.)
So skeptics have remained consistent. But the climate alarmist crowd bends themselves into pretzels, trying to show somehow that Evil is Good, Down is Up, Ignorance is Strength, and Global Warming Never Stopped.
But it did stop, and it hasn’t resumed. It may. Or this may be a plateau. Or a peak. But one thing remains an unproven and largely baseless conjecture: Measurable AGW. Global warming is not man-made per the climate Null Hypothesis, which has never been falsified. To assume, without any measurements or unusual observations that AGW is the cause of global warming is as un-scientific as you can be. It is a
belief, no different than a religious belief. You just want to believe it, so you play games like beginning at every month in the record until you find what confirms your bias. No good. Measurements, please. That’s all we need.
Prove me wrong, Donald. Produce verifiable, empirical, testable measurements that quantify AGW, and which are accepted by scientists across the board, not just by the current crop of rent-seekers riding the climate grant gravy train.
If you can produce replicable measurements quantifying AGW as a percentage of all global warming, you will surely be on the short list for a Nobel Prize. For one thing, such a discovery would resolve the climate sensitivity question, which is also no more than a conjecture. It would also improve predictions of global warming from human CO2 emissions, if human emissions do in fact make any difference. Because so far, those predictions have all been a major flop. Even with hugely expensive GCMs, no one was able to predict what Jones admitted to: global warming has stopped for many years. But those chumps are right this time around?? Not buyin’ it.
So have at it, Donald. You want to be rich and famous, don’t you? Me, I prefer some actual measurements of AGW to start with. Got any?

Donald
Reply to  Michael Palmer
January 26, 2016 9:56 am

dbstealey,
you wrote: “Sorry, I missed what you were saying at first. So you take every month and compare the slope? And you accuse me of cherry-picking?? Why not take every quarter, too? Just so you get what you want, eh?”
A linear trend using least squares is one method of finding a mathematical ‘best fit’ line to a dataset. It involves calculating the squares of the differences between the actual data and the best fit line, summing those squared differences, and minimizing the total value.
Is your issue with using global monthly values, instead of global daily averages? What I was trying to convey (and Nick Stokes’ graph illustrates this perfectly) is that based on the metric described by RACookPE1978 earlier, straightforward best fit lines really cannot be interpreted as illustrating “no warming” for the past 18+ years, since there is only one, 7-month period in either UAH dataset where the trend line slope is not positive, and that period is bounded, both prior to and immediately following, by periods with positive trend line slopes.

Donald
Reply to  Michael Palmer
January 26, 2016 10:02 am

dbstealey,
BTW, could you please explain what you mean by “cherry picking”? Making a comparison to the universe of points within a data set, as I did earlier, is normally thought to be the opposite of cherry picking.

Donald
Reply to  Mark Johnson
January 26, 2016 10:00 am

dbstealey,
BTW, could you please explain what you mean by “cherry picked”? Making a comparison to the universe of datapoints, as I did earlier, is normally thought to be the opposite of cherry picking.

Reply to  Donald
January 26, 2016 10:32 am

Cherry-picking: looking until you find something that feeds your confirmation bias.
You did it in the instant case by using a methodology that is very different than the one skeptics have been responding to for many years.
If Dr. Jones had been right and global warming resumed shortly after he defined the parameters, he would have bragging rights, and as a skeptic I would be trying to understand if, and where, I had been wrong.
But as it happened, skeptics are not wrong. Jones was guessing wrong, and he has to live with it. Global warming stopped, per Phil Jones’ own definition.
I’ve answered your questions. Your turn. Answer mine now.

Donald
Reply to  Donald
January 26, 2016 11:04 am

dbstealey,
I very carefully responded to the metric described by RACookPE1978 in his post above. If the metric he described is not what you accept, please feel free to correct his misstatement or my misinterpretation.
As it stands, however, I have explained why this particular metric, if accurately described by RACookPE1978, is an invalid method to gauge “warming” or the lack thereof.
Do you have a particular issue with the reasoning provided, or just that it does not match a pre-existing argument with which you are familiar?

Reply to  Donald
January 26, 2016 11:56 am

Donald,
So you want to argue with me about what RACook wrote?
How about this: answer my questions. I answered yours. It’s your turn now.

Donald
Reply to  Donald
January 26, 2016 12:12 pm

dbstealey,
you seem to have forgotten that I am responding to Michael Palmer’s claim about the “pause” – you have been trying to engage me in side topics, while I have been addressing that question and how it seems to have been misapplied.
Since you continue to respond to my posts that are exclusively on the topic of the pause, I have continued to try to respond to you constructively.

Donald
Reply to  Donald
January 27, 2016 8:56 am

dbstealey,
BTW, you wrote the following: “And you accuse me of cherry-picking?? ”
Actually, I did not – I neither stated it nor even implied it. You should be more careful when attributing statements to other people.

Bruce Cobb
January 20, 2016 11:44 am

Some 68 excuses by the Climate Liars for a Pause which is “fake”? Tell us another one, troll.

Jack
January 20, 2016 11:55 am

Gee, how did we know it would be another record? Helps when you data adjusting algorithm is programmed to reduce past temperatures and boost current ones.The surprise would be if it was not another record.

January 20, 2016 11:59 am

So what results did BEST get? Mosher is forever banging on about their methodology being “better”. So, what did the “better” method produce?

Reply to  davidmhoffer
January 20, 2016 12:45 pm

BEST is also showing 2015 as the hottest year on record.
http://berkeleyearth.org/wp-content/uploads/2016/01/Annual_time_series_combined1.png

Reply to  Martin Lott
January 20, 2016 12:53 pm

Martin Lott January 20, 2016 at 12:45 pm
BEST is also showing 2015 as the hottest year on record.

Not the point. Going 1980 to 2015, Best is a bit less than 0.6 dregrees. The others… a bit less than 0.6 degrees. Eyeball error admitted. BEST = Same?

Robert B
Reply to  Martin Lott
January 21, 2016 2:37 am

95% CI of ±0.1°C pre 1900.
Data for all of Aus is supposed to be too poor before 1910 to take the ridiculously hot temperatures experienced seriously but good enough for some twits to think it helps to get the global temperature anomaly in the 19th C with better precision than satellites in the 21st.

indefatigablefrog
Reply to  Martin Lott
January 21, 2016 6:57 pm

Here is how BEST describe the dataset that they have graphed here:
“Land + Ocean (1850 – Recent)
Berkeley Earth combines our land data with a modified version of the HadSST ocean temperature data set. The result is a global average temperature data set.”
So, 2/3rds of the planet is effectively borrowed and added in.
And it’s the most potentially problematic 2/3rds.
Amazing to see that they have given the pre-1940’s temperature a confidence interval of approximately +/-0.05degree when the temperature shown was mostly derived from the handwritten records of sailors with buckets at sparse locations on shipping lanes.
Such astonishing global coverage and precision acheived using men, thermometers and buckets on ropes.
Amazing really.
Maybe the BEST team should go out into the real world and all have a go at taking an SST using a wooden bucket and then compare the results that they get for the same location.
That may increase the area of grey on their graph.
They won’t do this of course. Because they have fallen in love with the deceptive image of precision that is offered up by their own data tinkering activities.

Reply to  Martin Lott
January 24, 2016 8:54 am

Martin Lott,
B.E.S.T. is not reliable:comment image

Alx
January 20, 2016 12:03 pm

What is tragic is what if the earths ecology was changing to make it more hostile to humanity, instead of focusing on ways to adapt to a changing environment we wave our arms at windmills made of CO2.
What is more tragic is that people like Gavin Schmidt still have a job based on his questionable ethical lapses.

Manfred
January 20, 2016 12:12 pm

The tension in the elastic that connects reality with fantasy appears to lie well outside the tensile strength of institutional propaganda. The result, growing irrelevance before the shattering disconnect.
Taipei City experiences coldest January in 40 years. It was also the ninth coldest January in Taiwan’s capital since the CWB set up a weather station there more than 110 years ago. Jia Hsin-hsing, head of the center’s Long-Range Forecast Section, said the cold periods during January this year were relatively long.
“The chilly weather was not confined to Taipei City, with 21 of the bureau’s 25 weather stations around Taiwan registering average temperatures ranking in the top 10 coldest since records have been kept,” Jia said.
http://taiwantoday.tw/ct.asp?xItem=148598&ctNode=413

Richard
January 20, 2016 12:22 pm

The UAH and RSS graphs look quite different to the GISS,NCEI and HADCRUT graphs.
According to the GISS,NCEI and HADCRUT graphs temperatures have risen about 0.65C since 1980 and according to the UAH and RSS graphs about 0.35. 0.3 more in the GISS,NCEI and HADCRUT graphs.That’s 87% more.
Also there looks like there is no pause in the GISS,NCEI and HADCRUT graphs.
Which one is correct?

Felflames
Reply to  Richard
January 20, 2016 1:20 pm

It might be better to think of it more as “which is least incorrect.”
At best our ability to measure temperature over large areas is sub optimal.
At worst, you might as well blindfold yourself and throw darts over your shoulder at a dartboard that might not be there.

Eliza
January 20, 2016 12:26 pm

Mr Tisdale the correct view of above is this
https://stevengoddard.wordpress.com/

Kev-in-Uk
January 20, 2016 12:29 pm

You know, the way NASA keep fiddling with data and stuff – it kinda makes me think the moonlanding deniers may have a point? After all the manipulation going on with the climate data, jiggling, juggling, etc – you’d think that filming in some studio/desert with 1960’s cctv technology and fooling average folk would be a doddle?
That said I’m looking forward to 2016 also being the warmest EVAH!

Harry Passfield
January 20, 2016 12:45 pm
Harry Passfield
Reply to  Harry Passfield
January 20, 2016 1:10 pm

From Google Earth I figure this hotspot is Katangsky District, Irkutsk Oblast, Russia.

Robert B
Reply to  Harry Passfield
January 21, 2016 2:58 am

According to Berkely Earth, its cooling at 3°C/century since 1990. Not exactly blasting the pause out of the water.
Then there are the issues with Russian data. .

Harry Passfield
January 20, 2016 12:48 pm

Should have left the reference for the chart in my previous comment

nc
January 20, 2016 1:00 pm

Seems my comments to the CBC article are being held in moderation and not posted by the CBC. I have used wed links to WUWT, maybe that’s what they don’t like. CBC can’t handle any opposition to their warming mantra. My handle on CBC comments is BillyChapel. Lots of warmer comments posted
http://www.cbc.ca/news/technology/2015-record-heat-1.3411797

601nan
January 20, 2016 1:05 pm

If the NASA&NOAA “global” temperature records correspond to “global” anthropogenic activity (not the politically mandated fudging) then does global economic activity account for the increase and do the plots show “hot spots” corresponding to human population/economic activity centers?
Another anthropogenic fail of Biblical proportions on NASA&NOAA.
Ha ha

January 20, 2016 1:11 pm

I’ll be more interested in these fine distinctions when we have results from a Global SurfaceStations project.
What fraction of the land surface temperature stations would get ratings of CRN 4 (error >2°) or CRN5 (>5°)? I suspect the answer is “a lot”.
If we complain to leaders of poor nations about the low quality of their met stations, they’d probably laugh at us. If we care so much about this data, then we should pay for it.

Reply to  Editor of the Fabius Maximus website
January 20, 2016 1:58 pm

We have high quality data for all those regions plus the oceans since 1979. If one wants to go further back, there is no high quality data for many places, nor for the oceans. There are exactly 163 GHCN stations worldwide meeting the following criteria:
Raw and adjusted data
At least 100 years
Less than 4 succesive missing monthly values
Percentage of missing years not more than 10%
Ends later than 1990.
Of those, 3 are in Africa and 5 in South America. 44 are in Europe, 54 in North America. No surprise there.
Even if all these were audited, it would still be challenging to put together a representative land record. And that would not solve the undersampled, trade route biased, ship bucket challenges of the oceans. Sometimes, you just have to recognize the data you would like does not exist, and stop pretending it does.

Reply to  ristvan
January 20, 2016 2:09 pm

Ristvan,
“We have high quality data for all those regions plus the oceans since 1979.”
Surface temperatures from poor nations? From where?
Satellites record lower temperature temp. Nor do balloons measure surface temps.

Reply to  ristvan
January 20, 2016 2:35 pm

No. Lower/middle troposphere from satellites. Where all the warming action is supposed to happen according to the climate models.
As far as I know, the only well sited station in Africa would be at the Katumani agricultural research station in Kenya sw of Nairobi. It only goes back a few decades. Is the main place where CIMMYT does most of its African crop adaptation work. So accurate weather records are an important adjunct. CIMMYT = Norman Borlaug starting in the 1940’s. Big deal. Very reputable. Most recently they devised a partial fix to UG99 wheat rust in just ~10 years, with cultivars ready for commercial seed production by ~2012 . Was thought would take 20, if ever even possible. Merged 5 genetic traits to substitute Borlaug’s 1, which UG99 had evolved around, emerging in Uganda in 1999. Decimated wheat crops in Northern Africa, Middle East, and Iran.

Arthur
January 20, 2016 1:29 pm

They keep saying “highest on record” but no one asks how far back does that record goes? This really is kind of important. No one asks and they won’t say.
The mercury thermometer was invented in 1714 but it is doubtful there were reliable, world-wide temperature records until quite recently – a few decades at the very most.
Of course, “highest on record” sounds so much more extreme than the factual “highest in the last few decades when we have records”.

Mark Johnson
Reply to  Arthur
January 20, 2016 1:38 pm

That’s well known info. You ought to try google sometime.

Arthur
Reply to  Mark Johnson
January 20, 2016 2:13 pm

Nice non-answer.

Reply to  Mark Johnson
January 20, 2016 2:41 pm

It is well-known. The GISS and NOAA indices go back to 1880.

Arthur
Reply to  Mark Johnson
January 20, 2016 2:41 pm

I’m curious. If I “try google” will that make AGW alarmists stop misrepresenting the facts?

Editor
Reply to  Mark Johnson
January 20, 2016 3:31 pm

No, but you’ll learn answers to questions you haven’t even thought of yet.

Patrick MJD
Reply to  Arthur
January 20, 2016 4:14 pm

Nick always seems to forget that a lot of weather stations are in large cities or at airports. Saying a record goes back to 1880 is rediculous. How many large cities and airports were there in 1880?

Ktm
Reply to  Arthur
January 21, 2016 2:07 am

If you’re talking about a record that is fit for purpose and doesn’t require massive fiddling, then that only goes back to 2005 with the uscrn. All other surface data, including data collected in the last year, has been fiddled with post hoc adjustments.

Mark Johnson
Reply to  Ktm
January 22, 2016 1:32 pm

LOL, UAH just had massive ‘fiddling’ to version 6

January 20, 2016 1:52 pm

Just as people were waking up in Sydney and enjoying the warm Summer weather, the usual announcement from GISS and NOAA that 2015 was the warmest year EvvvvvA, came blaring out from the ABC, but was soon overtaken by the important announcement that Australia had won the fourth 50/50 cricket game in Canberra against India.
After that everyone relaxed and went back to sleep.

January 20, 2016 2:27 pm

I suspect Tom Karl and Gavin Schmidt won’t bother to tell the public that lower troposphere temperature data were far from record highs in 2015, as we presented in the post Annual Global
############
Don’t go into the prediction business.

Reply to  Steven Mosher
January 20, 2016 2:45 pm

Good advice for anyone.

Chris
Reply to  Steven Mosher
January 20, 2016 5:43 pm

Actually, they did. On chart 10 of the 11 in their presentation.

Reply to  Chris
January 20, 2016 6:31 pm

NOAA goes into all kinds of predictions and claims concerning what the climate is doing.
There has been an explosion of public relations hires in government during this administration.
Steak dinner says they write such drivel and a select few scientists get to review or sign off.
It doesn’t take much to control the flow of information in large organizations.
https://www.ncdc.noaa.gov/climate-information/climate-change-and-variability

Chris
Reply to  Chris
January 20, 2016 9:55 pm

“NOAA goes into all kinds of predictions and claims concerning what the climate is doing.”
The conference was primarily about measured results, not predictions and claims. There were questions from the press about predictions, but that was not the main purpose of the event.

Gareth Phillips
January 20, 2016 2:31 pm

I suppose we can argue about how much global temperatures have increased and why, but can we agree that the ‘pause’ has now finished and we are back on track?

RHS
Reply to  Gareth Phillips
January 20, 2016 3:01 pm

Depends on the data set used. Using weather balloons and satellite data, no end to the pause. Use a set of data which has been homogenized and adjusted for propaganda, perhaps.

Marcus
Reply to  RHS
January 20, 2016 3:57 pm

More like tortured data !!

Toneb
Reply to  RHS
January 20, 2016 4:14 pm

No, Radiosonde data has never shown a “pause”.
http://www.ncdc.noaa.gov/sotc/service/global/global-sfc-radiosonde-temp/201001-201012.gif
BTW: That sonde dataset (Ratpac) is used to calibrate RSS…… err, what happened ~2000
Would that be a new Sat (noaa-15) carrying the new AMSU sensor?
Drifted a bit it seems.

Toneb
Reply to  RHS
January 20, 2016 4:19 pm

comment imagecomment image

JohnWho
Reply to  Gareth Phillips
January 20, 2016 4:26 pm

I would say “no”, primarily because, in my opinion, it will take a few years of either a cooling trend or a warming trend before one could call the “pause” over.
Then, if warming continues, it would have been a pause but if cooling begins then plateau would be more appropriate, I would say.

seaice1
Reply to  JohnWho
January 21, 2016 5:47 am

Whether the warming trend is over is a different question from whether “the pause” is ove. “The Pause” is clearly defined is not a matter of opinion. It could disappear if temperatures rise. To see a change in trend is only possible retrospectively, but that is not the case with “the pause”.

Walt D.
January 20, 2016 2:44 pm

I know that this site tries to promote good scientific arguments and to point out errors and implicit assumptions in published articles.
However, I am getting the impression that the people who publish these articles do not care.
There is probably no reason to take any government sponsored climate research (that is agenda driven) any more seriously than unemployment statistics that have very little do with how many people who have jobs, or cost of living indices that have little to do with what it cost to buy groceries or pay rent..
In the end, as the government keeps on telling lies, most people get to the point that they no longer believe a word they say.

Reply to  Walt D.
January 20, 2016 6:33 pm

eventually the scofflaw effect kicks in

philincalifornia
Reply to  Walt D.
January 20, 2016 6:40 pm

When I saw the photo of those too, especially Trofim Karl trying to look all serious, I was thinking it’s getting to the point of being sad for them (yes, government-sponsored scientific fraud has been sad for all of science for years, decades even now), but this is almost like child prostitute trafficking, only for older white guys.

Magoo
January 20, 2016 3:32 pm

NASA & NOAA are going into full alarmist mode as they know their funding will dry up when either Trump or Cruz becomes president, and congress is controlled by the Republicans. Their only option is to try to rally the warmest troops with BS record warming hand waving in the desperate hope it will make a difference. They’ll also try to minimize any La Ninas that follow the current El Nino.
Their competitors for the funding are their enemies, hence their desperate little propaganda video trying to invalidate the more accurate satellite records. GISS & NOAA can kiss bye bye to their future funding, and rightly so – C’est la vie guys, last throw of the dice.

Marcus
Reply to  Magoo
January 20, 2016 3:55 pm

Personally, I won’t be happy until they are rotting in jail for crimes against Humanity !!!

Magoo
Reply to  Marcus
January 20, 2016 5:24 pm

Amen to that brother, although I think fraud might be the appropriate charge.

Reply to  Marcus
January 20, 2016 7:24 pm

Marcus is right – crimes against humanity. People are dying because of this criminal behaviour. Other people are planning how they can rid the Earth of even more. There is hatred behind it all and that hatred is for humans.

January 20, 2016 4:05 pm

CAGW “theory” says the troposphere should warm faster than the ground. The new results show the ground warming faster than the troposphere. “Theory” disproved. What’s the problem?

Reply to  Ron House
January 20, 2016 6:35 pm

Thanks Ron
I didn’t know that.
Would you mind linking me to a decent cite on the matter ?

Reply to  knutesea
January 20, 2016 8:39 pm

There are many articles here on WUWT about it. One I wrote on my own site is
http://peacelegacy.org/articles/global-warming-science-simple
The basic point is this: The theory says CO2 causes more water vapour to be emitted into the troposphere. Since H2O is the most active greenhouse gas, it magnifies the CO2 warming many times over. Well if so, the warming must start where the water vapour is, namely in the atmosphere over the oceans. If the land warms faster than the oceans, then it can NOT be caused by the ocean emissions of H2O. It’s impossible.

Reply to  Ron House
January 21, 2016 7:32 am

Thank Ron

Patrick MJD
January 20, 2016 4:10 pm

A rubbish announcement with made up data. All over the alarmist media here in Australia. They also state that he temperatures are “scorching” here in Sydney. Well, no, they are usual for SUMMER FFS!

Patrick MJD
Reply to  Chris
January 21, 2016 1:56 am

The SMH, Peter Hannam and the BoM, really? IT IS SUMMER!!!! And not “scorching”…wet and humid more than hot and dry! And we know, as demonstrated here at WUWT, the Australian land based measurements are rubbish!

Chris
Reply to  Chris
January 21, 2016 8:14 am

Interesting, if BoM is not to be trusted, then what data do you suggest for Australia?

bit chilly
Reply to  Chris
January 21, 2016 12:09 pm

why is any data needed ? who cares what the temperature is doing .wake up in the morning and dress appropriately if you are going outside.

Patrick MJD
Reply to  Chris
January 21, 2016 3:55 pm

“Chris says: January 21, 2016 at 8:14 am”
The BoM is on record for having “fiddled” with temperature data. Nuff said!

Another Scott
January 20, 2016 4:33 pm

If the politics around CO2 emissions weren’t so charged this announcement could be seen as good news, who wants to live in another Little Ice Age?

Kyle
January 20, 2016 5:31 pm

I would like to know, if the govt really believes in the AGW theory , why do the they keep funding the scientists to keep proving it, it is either true or it is not,why do we need study after study, if they believe the AGW theory just stop the increased production of CO2. They should just say thanks to the warmists we believe your BS but now it is proven we do not need to fund you anymore.

Reply to  Kyle
January 20, 2016 7:30 pm

Not a single paper of theirs has proven anything yet. Nevertheless they want a gazillion papers to form their “consensus” and to whack as many non-believers over the head as they can. We’re not bowing deeply enough, we’re not groveling before our mighty masters. We’re not handing over our wealth quick enough, nor rioting in the streets to bring down civilization, etc., etc.

Gerald Machnee
January 20, 2016 5:34 pm

Has anyone done the global temps minus the fill in stations and minus the adjustments?
Should be interesting.

DWR54
Reply to  Gerald Machnee
January 20, 2016 6:33 pm

Yes. The unadjusted data used by NOAA were shown at the NASA/NOAA presentation. They show more or less exactly the same trend results as the adjusted data.

Marcus
Reply to  Gerald Machnee
January 20, 2016 7:29 pm

Gerald, ignore DWR54, he’s delusional !! NASA and NOAA only present ADJUSTED ( tortured ) data…

DWR54
January 20, 2016 6:29 pm

“I suspect Tom Karl and Gavin Schmidt won’t bother to tell the public that lower troposphere temperature data were far from record highs in 2015”
_____________
In fact they made this explicitly clear and also presented a screen showing as much at the presentation.

steve in Seattle
January 20, 2016 7:12 pm

NOAA Global Analysis – Annual – Land & Ocean
http://www.ncdc.noaa.gov/sotc/global/201513
Understanding & Interpreting Uncertainty Ranges
http://www.ncdc.noaa.gov/monitoring-references/faq/global-precision.php
Much of the stated record warmth for the globe can be attributed to record warmth in the global oceans. Ocean temperatures for the year started with the first three months each third warmest for their respective months, followed by record high monthly temperatures for the remainder of the year as one of the stongest El Niños in the historical record evolved.
C F
2015 – Land and Ocean + 0.90 ± 0.08 + 1.62 ± 0.14
2014 – Land and Ocean + 0.69 ± 0.09 + 1.24 ± 0.16
2013 – Land and Ocean + 0.62 ± 0.09 + 1.12 ± 0.16
2012 – Land and Ocean + 0.57 ± 0.08 + 1.03 ± 0.14
2011 – Land and Ocean + 0.51 ± 0.08 + 0.92 ± 0.14
2010 – Land and Ocean + 0.62 ± 0.07 + 1.12 ± 0.13
2009 – Land and Ocean + 0.56 °C (+ 1.01 °F)
2008 – Land and ocean + 0.49°C (+ 0.88 °F)
2007 – Land and Ocean + 0.55°C (+ 0.99 °F)
2006 – Land and Ocean + 0.54°C (+ 0.97 °F)
2005 – Land and Ocean + 0.62°C (1.12°F) ** Improved Data, Smith & Reynolds
2004 – Land and Ocean + 0.54°C (0.97°F) **
2003 – Land and Ocean + 0.56°C (1.01°F)
2002 – Land and Ocean + 0.56°C (1.01°F)
2001 – Land and Ocean + 0.51°C (0.92°F)
2000 – Land and Ocean no annual data
1999 – Land and Ocean + 0.41 C (0.74F)
** The 1880 – 2003 average combined land and ocean annual temperature is 13.9°C (56.9°F)

zenrebok
January 20, 2016 7:23 pm

Well its filtered into the mainstream media here today.
A chap (apparently a “””scientist”””) was saying recent record temps put to death climate change denial….
I paused and counted to five.
Seems skepticism is no longer a requirement of the scientific method. At least in New Zealand.
Amazing how this consensus propagates around the world, its almost like,…I don’t know, an organised policy or something.

Reply to  zenrebok
January 20, 2016 7:43 pm

Creepy … feels like you need to shower ?
Check out Dr Curry’s link to a recent perspective on what Paris did accomplish.
http://judithcurry.com/2016/01/20/the-trojan-horse-of-the-paris-climate-agreement/#more-20951

lee
January 20, 2016 7:25 pm

Did you see the uncertainty on the Ocean data?
Ocean +0.74 ± 0.00
http://www.ncdc.noaa.gov/sotc/global/201513
Such certainty. Karl et al did a marvellous job.

Werner Brozek
Reply to  lee
January 20, 2016 8:17 pm

Ocean +0.74 ± 0.00

Wow! It makes you wonder how carefully everything was proofread.

AndyG55
Reply to  Werner Brozek
January 20, 2016 11:18 pm

They missed the 3..
should be Ocean +0.74 ± 3.00

January 20, 2016 8:48 pm

Potentially off point but worth looking at. POTUS spoke to the people of Flint and they roared with support when he assured them that funds are coming to fix their drinking water problems. Detroit and Flint are classic microcosms of poor management. Push out the productive, enslave the remainders. Rush in to save them from the mismanagement that you supported. Bizarre and true.
I say it’s worth paying attention to because it alerts to a template for how the federal government might step in once energy rates go thru the roof and da peoples start complaining about “basic services”.
Likewise, it’s been bantered about that a failed Obamacare leads to a federal takeover.
Essentially, they win by lying about CAGW, they win if it turns out we can’t afford the fix they ascribe to, they win if gets colder and we aren’t prepared with reliable energy sources because we dismantled them. I’m not ready to do the snoppy dance if the GOP wins the next POTUS because the congressional GOP extended alternative energy rebates for another 5 years in the most recent budget.
There aren’t too many profiles in courage out there.
I probably need to go fishing again.
See mirages of mermaids running towards me.
Relax.
The skeptics are telling the truth about CAGW, yet I don’t see what victory looks like.

bit chilly
Reply to  knutesea
January 21, 2016 12:13 pm

i go fishing a lot these days. 1 hour of bbc propaganda requires at least 6 hours fishing to recover from. a nasa/noaa press release usually 2 days.

M.Szilard
January 20, 2016 10:46 pm

Just compare in the PDF page 8 with page 9. In page 8 they have 10 monthly records, in page 9 only 4 records. Congratulations NOOA!!!

Reply to  M.Szilard
January 20, 2016 11:55 pm

looks like page 9 is in error. 10 months in 2015 equalled or tied the previous record for the month
http://www.ncdc.noaa.gov/sotc/global/2015/13/supplemental/page-2

M.Szilard
Reply to  David Sanger
January 21, 2016 12:10 am

I think not only page 9, but the whole document is in error, such as NOAA.

Ktm
January 21, 2016 2:33 am

2015 was Warmest ever! *&
* Except in our best global temperature data (RSS/UAH)
& Except in our best surface data (USCRN)

January 21, 2016 8:51 am

Bob Tisdale had at least six months to prepare for this and this was the best he could do? Is he planning his exit strategy or otherwise distracted?

kelly burgess
January 21, 2016 9:02 am

Has anyone found the ” Probability of warmest years charts ” in this years proclamation ? Last year NASA had the probability at 38% for 2014 being the hottest year ever .

steve in Seattle
January 21, 2016 12:21 pm

Kelly, I was looking for that ” probability chart ” also, could not find it, perhaps it was too inconvenient for NASA / NOAA ….

kelly burgess
Reply to  steve in Seattle
January 21, 2016 12:26 pm

Thanks , now I do not feel so bad .

joeldshore
Reply to  steve in Seattle
January 21, 2016 7:02 pm

This was asked in the question-and-answer part of the call. Gavin said that the probability in the NASA GISS data set was 90-something percent (94%?); I forget the exact number. Karl said it was over 99% in the NOAA data set. Or maybe it was the other way around; I forget who said which, but the point was that it was above to way above 90% in both.
So, no, I don’t think it was at all inconvenient for NASA / NOAA. It’s more of a softball-question. 2015 blew the other years out of the water.

steve in Seattle
Reply to  joeldshore
January 22, 2016 1:36 pm

No, that NASA / NOAA made the decision to include, at least, a tabular presentation of probabilities in 2014 and then dropped it for 2015 is right in line with yearly presentations that are ” reformatted ” at whim, rather than standardized. IF it was important enough for the presentation in 2014, with forethought, it should have been carried forward to this year and subsequent years in the same location ( link ) and with the same layout for this year and all future years. Do you suppose these ” scientists ” could start to just show their math steps ? OR, does the agenda trump all ?

joeldshore
Reply to  joeldshore
January 23, 2016 10:46 am

Well, it was important in 2014 because the record value was small enough over the previous years that the probability that it definitely exceeded those previous years was quite a bit lower.
I am having a hard time understanding what you think their “agenda” is, since showing the probabilities last year but not this year actually tends to undercut the message of alarm. So, perhaps their agenda is to downplay global warming? It is kind of amusing to see you attributing something they did that is in the AGW-skeptics favor as still somehow being nefarious.

Scott
January 21, 2016 4:01 pm

There are statistics and damnable lies…….
You decide…:-)

co2islife
January 23, 2016 4:01 pm

This chart shows that over the past 8000 years, temperatures changed by 0.8°C, with very little variation of the actual temperature.comment image
This chart shows temperatures increasing almost 0.8°C over the past 30 years. Something clearly must be wrong with either the consensus or the proxies.comment image?w=720

January 24, 2016 12:53 pm

joelshore,
You want ‘nefarious’? This is nefarious:
…(7) “Here, the expected 1990-2003 period is MISSING – so the correlations aren’t so hot!
Yet the WMO codes and station names /locations are identical (or close).
What the hell is supposed to happen here?
Oh yeah – there is no ‘supposed’,
I can make it up.
So I have :-)”

The Harry_read_me file. Verbatim. He fabricated 13 years of temperature data.
Satellites are the gold standard.