Or In a Discussion of the Hiatus Since 1998, Grant Foster Presents Trends from 1970 to 2010, Go Figure!
Guest Post by Bob Tisdale
Statistician Grant Foster (a.k.a. blogger Tamino, who also likes to call himself Hansen’s Bulldog) is back to his one of his old debate tactics again: redirection. Or maybe a squirrel passed by and, like Dug the talking dog from Pixar’s Up, Hansen’s Bulldog simply lost track of the topic at hand.
For some reason, Grant Foster wants to keep drawing attention to the fact that the night marine air temperature data that NOAA used as a reference do not support the changes NOAA made to their sea surface temperature data…and I am more than happy to discuss this topic yet another time.
BACKSTORY – THE EXCHANGE
Grant Foster didn’t like my descriptions of the new NOAA ERSST.v4-based global surface temperature products in my post Both NOAA and GISS Have Switched to NOAA’s Overcooked “Pause-Busting” Sea Surface Temperature Data for Their Global Temperature Products. So he complained about them in his post New GISS data. His rant began:
Of course, deniers are frothing at the mouth about the change. The “hit man” for WUWT, Bob Tisdale has been insulting it as much as he can. He keeps saying things like “Overcooked “Pause-Busting” Sea Surface Temperature Data” and “unjustifiable, overcooked adjustments presented in Karl et al. (2015)” and “magically warmed data.”
And Grant Foster didn’t like that I presented the revised UAH lower troposphere data in a positive light.
I responded to Grant Foster’s complaints (a.k.a. Hansen’s Bulldog’s whines) with the post Fundamental Differences between the NOAA and UAH Global Temperature Updates. The bottom line of it was:
The changes to the UAH dataset can obviously be justified, while the changes to the NOAA data obviously cannot be.
I even reminded readers that the topic of discussion was the slowdown in global surface warming, or the hiatus.
Refering to another topic in Tamino’s post, I wonder if Tamino would prefer the term “hiatus busting” instead of “pause busting”, considering that Karl et al (2015) used the term hiatus, not pause, in the title of their paper Possible artifacts of data biases in the recent global surface warming hiatus. Mmm, probably not, because Tamino uses the same misdirection as NOAA did in Karl et al.
THAT LEADS US TO THE TOPIC OF THIS POST
Obviously, Grant Foster missed that paragraph about the hiatus, the pause, the slowdown, whatever you want to call it…or Hansen’s Bulldog got sidetracked by a squirrel, because he replied with the post Fundamental Differences between Bob Tisdale and Reality.
Grant Foster started with my comparison graph of the new ERSST.v4 data and the HADNMAT2 data, which served as a reference for the ERSST.v4 data. See Figure 1.
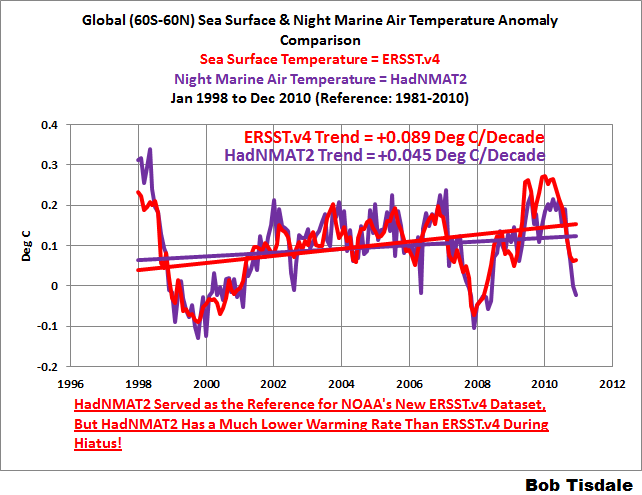
Figure 1
The data clearly show that NOAA cannot justify the excessive warming rate during the global warming slowdown because the warming rate of the NOAA data is far higher than the dataset they used as reference. Yet Grant Foster included that graph in his post.
Note: If you’re wondering why the data in the graph ends in 2010, that’s the last year of the HADNMAT2 data at the KNMI Climate Explorer. We’ll address the start year of 1998 in a moment. [End note.]
Foster did not dispute my trend presentation; he simply replicated my graph (without the trends) in the first of his three graphs, which I’ve included as the top cell of my Figure 2. Then Grant Foster switched topics (timeframes) and presented two graphs that began in 1970, which I’ve included as Cells B & C of Figure 2.

Figure 2
About his 2nd and 3rd graphs (Cells B & C), Grant Foster writes (my boldface):
That certainly destroys the impression from Bob’s cherry-picked graph. But wait — is the NMAT trend estimate “much lower” and the ERSSTv4 trend estimate “much higher”? Well, that from NMAT is 0.0116 deg.C/yr, from ERSSTv4 it’s 0.0117 deg.C/yr. [sarcasm] Big difference! [\sarcasm]
“Cherry-picked?” How silly can Grant Foster get?!!! The topic at hand is the hiatus as described by Karl et al., not the trends starting in 1970. Only Grant (and his followers) are interested in the trends from 1970 to 2010.
And what was one of the years that Karl et al. used for the start of the slowdown in global surface warming?
Grant Foster failed to tell his readers that Karl et al. used 1998 as the start year for many of their trend comparisons. I’ve circled them on Figure 1 from Karl et al., which is included as my Figure 3. For the oceans, Karl et al. compared their “new” ERSST.v4 data to their “old” ERSST.v3b data.
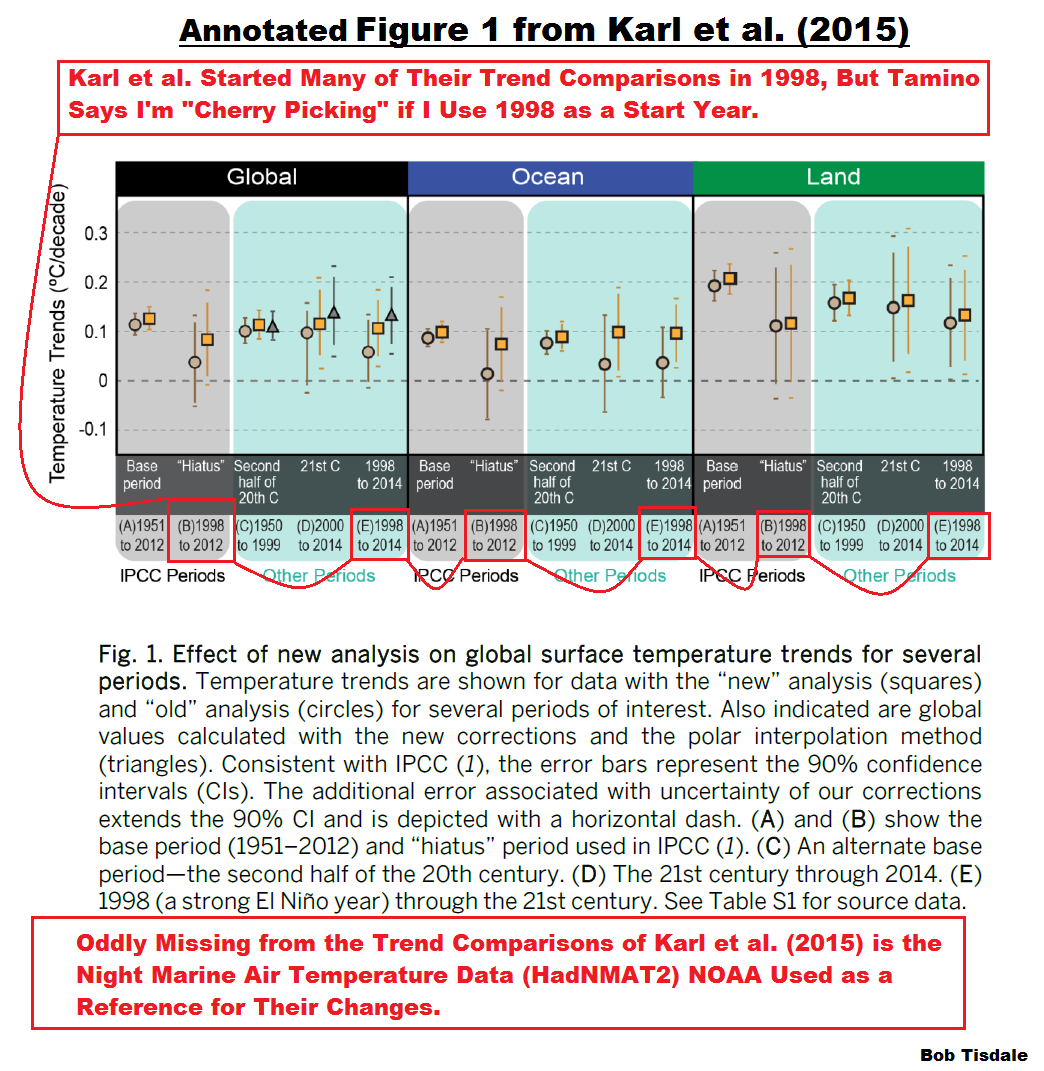
Figure 3
Also see the note at the bottom of Figure 3. One of the bases for the following two posts was the failure of Karl et al. to include trend comparisons of their new (overcooked) sea surface temperature dataset and the night marine air temperature dataset they used as a reference for their changes:
- More Curiosities about NOAA’s New “Pause Busting” Sea Surface Temperature Dataset, and,
- Open Letter to Tom Karl of NOAA/NCEI Regarding “Hiatus Busting” Paper
And I introduced Figure 1 in the latter of those two posts.
CLOSING
Hansen’s Bulldog (Grant Foster, a.k.a. Tamino) chooses to mislead his readers by ignoring the fact that Karl et al. used the start year of 1998 for many of their short-term trend comparisons, thereby making him look foolish when he claims that I’ve cherry-picked 1998 as the start year for my comparison. Anyone who read and understood Karl et al. (2015) can see the obvious failure in Tamino’s silly attempt at redirection.
Grant Foster did not dispute the trends listed on my Figure 1, which he included in his post.
Those trends showed, for the period of 1998 (a start year used by Karl et al. for trend comparisons) to 2010 (the end year of the HADNMAT2 data), that NOAA’s new ERSST.v4 sea surface temperature dataset had a much higher warming rate than the HADNMAT2 data, which NOAA used as reference for their adjustments.
In other words, NOAA overcooked the adjustments to their new ERSST.v4 data, which serve as the ocean component of the GISS and NCEI (formerly NCDC) global land+ocean surface temperature products.
Once again I have to thank Grant Foster (a.k.a. Tamino and Hansen’s Bulldog) for yet another opportunity to show that NOAA cannot justify the relatively high warming rate of their new ERSST.v4 sea surface temperature data during the hiatus, because it far exceeds the trend of the HadNMAT2 data that NOAA used as a reference.
[Side Note to Tom Karl/NOAA: Think of all of the web traffic that WattsUpWithThat gets. It dwarfs other global-warming blogs. You can blame Grant Foster for the last two posts about your overcooked ERSST.v4 data. Have a nice day.]
Wasn’t familiar with Tamino until reading this, but he seems like a sharp guy.
“Sharp” has multiple meanings.
So for clarification, Grant Foster is clever, honest and (sadly) bigoted.
He truly believes that the world is coming to an end and constantly seeks evidence to support his faith.
Being clever, he finds some. Being honest, the evidence is legitimate.
But being bigoted he disparages and discards that weight of evidence for a reality which he finds heretical.
You don’t think Tisdale can be accused of the same thing?
He can be so accused, if you wish. But you need to back it up.
When has Tisdale ever missed the time period under review because that disparages his belief?
In this case Karl et al were talking about the Pause.
Tisdale was talking about the Pause.
And Foster talked about the 70s. (Oh dear).
Have you got a similar example that deflates Tisdale?
Whether claiming that someone exaggerates, has an overactive imagination, hides or ignores distasteful evidence or disparages distasteful evidence, it all comes down to a lack of honesty.
Just because someone will work with ‘most’ of the accurate data, the moment they seek to hide, disparage, cook, or twist data so it suits their purposes, they become dishonest.
Tamino (Grant Foster, think dark shades) is sharp, intelligent, impatient and less than honest.
M Courtney,
Here’s the real difference between Tamino and Bob Tisdale.
Tamino does statistical hypotheses and provides numerical results of those hypotheses to prove his point.
Bob Tisdale does NOT do statistical hypotheses and provides numerical results of those hypotheses to prove his point.
Still don’t see the difference? Look directly above and show us all exactly where Bob Tisdale does any form of statistical hypotheses testing. I don’t see anything other than words from Bob Tisdale, no confidence intervals from Bob Tisdale in any of his “so called” analyses AFAIK.
Words alone don’t replace doing at least some form of science, which is all Bob Tisdale has shown to date, only words.
To Bob Tisdale: For once in your life, at least try to do some actual science. TIA
ICU:
Statistics does not make science. Nor is statistics required to explain science.
Use of statistics to twist understanding along with the posting of incorrect confidence levels is definitively anti-science.
And you are right, Bob Tisdale never misuses statistics when presenting his science. A claim that you can not make for the opposition.
ICU/M Courtney – I think the main difference between the two is simpler than that. Tisdale assumes that the entirety of journal-plublishing scientists who have spent their lives studying climate are involved in a diabolical plot to intentionally mislead the public. To buy in to Tisdale’s work, one has to believe that a non-scientist operating from home with no contact with the climate science community is the guy who is going to save the world from this organized treachery.
ATheoK,
Seriously?
“Statistics does not make science. Nor is statistics required to explain science.”
What do you consider the scientific method to be then? Statistics is certainly a tool that everyone should have in their scientific toolbox. IMHO, Bob Tisdale lacks that basic tool in his scientific toolbox, as demonstrated by the lack thereof in the above post.
“Use of statistics to twist understanding along with the posting of incorrect confidence levels is definitively anti-science.”
Twist? Incorrect? How so? More words.
Still no qualitative or quantitative analyses, just words like “look see I can plot data” and “see the BIG difference” and you call that science? Somehow, don’t ask me how, that doesn’t pass any form of smell test for doing science.
“And you are right, Bob Tisdale never misuses statistics when presenting his science. A claim that you can not make for the opposition.”
Yes, you are correct, Bob Tisdale “never misuses statistics” simple because he never presents statistics (e. g. confidence intervals of the trend lines) to begin with in the 1st place. Bob Tisdale’s form of analyses essentially boils down to “look, see, BIG difference” and that’s actually OK with me, but others might prefer something that goes beyond an “am not, am so” war (or feud) of words. Tamino at least attempts to go beyond a simple war of words using statistical tools that anyone in their right mind would use to defend their POV. To date, Bob Tisdale has not shown one iota of of anything beyond accusations and data plots. So for example, at what confidence interval are the ERSST.v4 and HadNMAT2 trend lines statistically significant?
Claim? What “claim” is the “opposition” making? The only “claim” I see the “opposition” making is a significantly more robust of use of statistical hypotheses testing that is completely lacking in all of Bob Tisdale’s discourse on this subject matter to date.
Confidence Intervals: Over what time period? If you pick a period that is significant you can wow those who look at numbers and think “ooh… sciency”.
But if you are actually doing science you pick meaningful time periods to examine. In this case, it is the Pause.
It is true that sophisticated statistics can provide sophisticated answers if you are a sophist who is only looking to persuade.
Bur if you’re looking to learn then you need to discuss meaning, not selective maths.
M Courtney,
“Confidence Intervals: Over what time period?”
1998-2010 inclusive, the exact same time period as shown in Figure 1 above.
“If you pick a period that is significant you can wow those who look at numbers and think “ooh… sciency”.
But if you are actually doing science you pick meaningful time periods to examine. In this case, it is the Pause.”
See answer above, 13 years, that’s it.
“It is true that sophisticated statistics can provide sophisticated answers if you are a sophist who is only looking to persuade.”
You really don’t see the irony in your above statement? Because Bob Tisdale most certainly is a sophist sans the “clever but” part.
“Bur if you’re looking to learn then you need to discuss meaning, not selective maths.”
Don’t know what you even meant in that last sentence. So please do expound on that, if you don’t mind. But right know, my interpretation of your last sentence implies or seems or suggests or appears to give the impression that you think that WUWT is a No “maths” Zone or some such. If that’s the case, then I would disagree with you, WUWT? has “maths” but of course it’s almost always 111% wrong, but WUWT? certainly has “maths” sort of, kind of at the level of a primary education so to speak.
@ICU: We are in the thermal measurements field, or in the opinion polls field? Because the latter is the field where statistics can lead to conclusions and prove something (and easily can be misused). In the first field, statistics can and should be used as a tool, but they have to be used carefully and not abused: e.g. uncertainty range has to be calculated with statistical tools too, but cannot forget instrumental uncertainty, cannot be lower than instrumental uncertainty, and it makes no sense to claim records which are within the uncertainty range. Even the “statistically significant difference” between trends makes poor sense: or you can clearly distinguish quantities out of their uncertainty range, or you cannot.
There is no physical way to really say e.g. that 1.52±0.1°C is different from 1.63±0.1°C; nor there is any real physical sense to state that the second measurement is higher with a (let’s say) 50% chance, because you cannot really make a clear distinction between the two quantities. Even in opinion polls, that would make poor sense (and we indeed see a lot of errors and misunderstandings from advisors, policy makers, managers, common people, who do not use statistics the correct way). Furthermore, if our e.g. thermocouple error range is 0.2°C, there is no way to really reduce the uncertainty range below this value, without using several instruments to measure the same phenomenon and then using mathematical means to reduce the uncertainty range; and not just by using statistical/mathematical means, coupling data several miles away (or even hundreds of miles away, when you don’t have any data for a certain sea or land range). This is why e.g. medical research uses the double blind test to erase any possible personal or mathematical flaws, or why e.g. engineers often rely on empirical evidence and safety factors despite mathematical theories which should be able to be so precise: and both medicine and engineering, in their several fields, have behind them several centuries of experience and theories, not just a few decades of poorly-proven projections.
The reality is that statistics are very useful to organise data, above all when you have got a huge amount of them; but statistics cannot build up a theory nor override basic physics. What you lack, is e.g. theory of measurement; what you have, is an overconfidence in statistics: you could spend your entire life trying to calculate something to the very last decimal digit at the N-sigma confidence interval, but it would not make any sense even if you invest all your efforts, if you go beyond physical limits of that measurement. This may lead to claim temperature records or warming trends, where no physically real temperature record nor warming trend is, no way how many calculations you did to support your statement.
P.S. I am personally deeply convinced that Eartj warmed during the last 150 years; I am not convinced of the so small uncertainty they claim in measuring worldwide temperature anomalies, and even less convinced of the doomed future (but this is another point, about the use and abuse of computer modelling and “what if” scenarios).
Just to clarify, ‘meaning’ referred to a hypothesis – In this case that the Pause was real.
Karl et al said it wasn’t. Foster picked a completely different time period that conveniently found that Karl et al were right. But that is meaningless as (although the finding was correct to a statistically significant level) it wasn’t the time period under review.
You can prove anything if you move the goalposts to get a sciency result. But really you need to test the hypothesis.
I’m sorry if logic isn’t mathematical enough for you.
P.P.S. Maybe I am somehow in a “middle way” of this fight. I see the NOAA adjustment as minor, and compatible with other data. The same way, the NOAA adjustment does not “bust” the “hiatus” at all, since it shows a very small upward trend, well below any uncertainties and computer-calculated scenarios (for the current CO2 emissions levels). What I do not like, is the use they are making of this very small and somehow not significant adjustment, in the light of incoming Paris conference.
“So for clarification, Grant Foster is clever, honest and (sadly) bigoted.”
No, afraid not. Those of us with longer memories will recall his series on Principal Component Analysis. The first couple of installments gave a very clear introduction to the subject. At the third he started to encounter the Mannian method and this gave him a real problem. Of course, Mann, and his Hockey Stick, is part of the canon so he could not be exposed. But on the other hand, to do PCA while using, instead of the mean, which the method calls for, some other number picked with no justification whatever, that could not be justified. So he lightly drew a veil over that and avoid confronting the subject.
But then he went on to claim support from Ian Joliffe for the use of the so called ‘short centered’ method. Now that was being a bit too economical with the truth. And it finally resulted in a rebuttal from Joliffe who explained (a) he never had supported it (b) he doubted any process using this method could actually be considered PCA.
So Tamino then found it inconvenient to keep the archive exposed and its gone.
Clever, yes, bigoted, yes. With a real talent for explaining things simply, when he chooses to, but this is a talent that can be and is abused. Adored by a small group of readers who know no math and less statistics.
But watch the pea under the thimble all the time.
Guys,
Still here, not making excuses or trying to avoid further discussion, but long day, much eye strain at this end, must rest.
Don’t worry, it’s the same for us.
Michel:
You rightly say of Grant Foster a.k.a. Tamino
Foster is an academic so benefits his career by publishing in peer reviewed literature. Hence, anything he posts on his blog under the name of Tamino is work he assesses to be not capable of obtaining publication in peer reviewed literature. Indeed, Foster proclaims he is not willing to put his own name to stuff when he posts it on his blog under the name of Tamino.
And there are Tamino acolytes posting in this thread who think the excellent work of Bob Foster is comparable to the rubbish Foster posts on his blog under the name of Tamino!
Richard
Arrgh!
Bob Tisdale not Bob Foster. Sorry.
Richard
ICU says, July 21, 2015 at 9:32 pm:
“Here’s the real difference between Tamino and Bob Tisdale.
Tamino does statistical hypotheses and provides numerical results of those hypotheses to prove his point.
Bob Tisdale does NOT do statistical hypotheses and provides numerical results of those hypotheses to prove his point.”
ICU, you do not need any “statistical hypotheses” when you have a full dataset in front of you. Then you just look at the data.* And that’s what Tisdale does. Foster rather uses his “statistical hypotheses” to hide (or at least obscure) what the data itself is actually showing us.
*Don’t take my word for it, ICU. Here are the words of “Statistician to the Stars!”, William M. Briggs: “If we want to know if there has been a change from the start to the end dates, all we have to do is look! I’m tempted to add a dozen more exclamation points to that sentence, it is that important. We do not have to model what we can see. No statistical test is needed to say whether the data has changed. We can just look.
I have to stop, lest I become exasperated. We statisticians have pointed out this fact until we have all, one by one, turned blue in the face and passed out, the next statistician in line taking the place of his fallen comrade.
(…)
Again, if you want to claim that the data has gone up, down, did a swirl, or any other damn thing, just look at it!”
http://wmbriggs.com/post/5107/
Tamino does statistical hypotheses and provides numerical results of those hypotheses to prove his point.
==========================
there are 3 kinds of lies: lies, damned lies, and statistics.
statistics performed on adjusted data is a meaningless exercise. the primary assumption behind statistics is that you are dealing with a random sample. once the sample has been adjusted it is no longer random and your statistics are no longer valid.
For example, look at plate of scrambled eggs. Apply all the statistics you want, you cannot reveal the shape of the original egg except by accident. Because you know the shape of eggs in general you can of course present the accident as a result, but it is a false result.
This is what climate science has become. The adjusted data is Humpty Dumpty, lying broken on the ground. Climate science is all the Kings Horses and all the Kings Men, trying to put Humpty together again.
Bill 2 @ur momisugly July 21, 2015 at 10:09 pm
“Tisdale assumes that the entirety of journal-plublishing scientists who have spent their lives studying climate are involved in a diabolical plot to intentionally mislead the public.”
ICU @ur momisugly July 21, 2015 at 10:39 pm
“Tamino at least attempts to go beyond a simple war of words using statistical tools that anyone in their right mind would use to defend their POV. “
Statistical tests are only as good as their underlying model. And, nobody knows the proper statistical model. It is vain hackery to be presenting confidence intervals, e.g., for a trend calculated on an assumption of iid variates when you’ve actually got pink noise. It is worse than wrong – it is active disinformation.
Kristian @ur momisugly July 22, 2015 at 5:40 am
“If we want to know if there has been a change from the start to the end dates, all we have to do is look!”
I feel his pain. Foolish people think statistical tests can reveal something that they cannot see themselves. Methods which fall under the general heading of “statistics” are basically a set of tools for data compression, not for divination.
The sort of goal post switching discussed in this post doesn’t fall under my definition of honesty.
Tisdale apparently has no degree in any math or science discipline.
E.Grant Foster apparently has no degree in any math or science discipline. If that is not the case, the school, the year and the degree, please. He has also been known to step over the line from insult past libel per se when he controls the forum.
Apologies to Tisdale, I was thinking of someone else.
No apologies to E. Grant Foster, aka tamino. I’ve never seen any “academic” so devoid of verifiable credentials.
rw July 22, 2015 at 12:08 pm
It does mine.
He truly believes that this is appropriate. As he discards the possibility that the alternative could be true so he searches for evidence that is valid and supports the “truth” as he knows it.
Torquemada wasn’t a liar. He sought the truth. But he refused options that weren’t in his belief system of potential truths. And so he found himself using extraordinary methods to get evidence for acceptable “truth”.
Grant Foster is similar (but more humane, of course).
He seeks truth… but as he’s bigoted he doesn’t seek it in every possible place.
Like the old saying, sharp as a tack and twice as flat headed?
I briefly thought so too, a few years ago, that Tamino was a “sharp guy”. But his analysis around the time of the Marcott et al farce was dismal. I put a corrective comment on his blog which was deep-sixed. I’ve never gone back.
I can’t remember now which was a better day, the day JeanS brought the ‘garbage’ or the day Ian Jolliffe took the garbage out.
==============
Hi Bill
This prince of darkness a.k.a Tamino (unlike Mozart’s magic flute prince Tamino) went nutt’s over the top graph shown here
http://www.vukcevic.talktalk.net/JJ.gif
to the extent that Gavin had to delete his comments on the RealClimate blog.
Really? I didn’t ever see that – don’t know where I was at the time. I haven’t even seen that graph before, is it your own compilation of the data? What was upsetting Grant Foster so, can you remember? Though it doesn’t take much, does it, he does have issues.
Hi TGOBJC
It was number of years ago, my recollection of events:
I posted link to the CET June temperature graph with caption 350 years with zero temperature trend. Foster and Daniel Bailey from the real science blog (?), wanted to know what was source of data, my reply was something on the lines of ‘you pretend to be climate scientists and since the data starts in 1659 you should know’. Then both of them accused me of manufacturing the data, and Foster resorted to some vulgar obscenities. Gavin put things right quoting the CET link
http://www.metoffice.gov.uk/hadobs/hadcet/cetml1659on.dat
then deleted Foster’s and perhaps one of Daniel’s comments. Foster took leave of absence, while I continued to discus the matter with one of the regulars ( McKinley ?)
“Though it doesn’t take much, does it, he does have issues.”
The dude’s got an entire subscription!
For those who would like a somewhat more complete stats analysis, Vukevic’s plots, which I agree with exactly, could show the following: for June the linear fit to the CET data is CET = 14.1736 + 8.147E-5*Year
The standard error of the coefficient is 5.589E-4, giving a t value of 0.146, probability 0.884, and the 95% confidence interval is -1.018E-3 to 1.181E-3
For Jan, CET = -5.654 + 4.848E-3*Year The standard error of the coefficient is 9.94E-4 giving a t value 4.88, probability 1.59E-6 and the 95% confidence interval is 2.895E-3 to 6.802E-3.
For those addicted to R-Sq values they are 5.955E-5 and 0.06293 respectively..
The numbers I’m giving are of course /ridiculously/ precise. They are simply what the formal stats produces in my software. For practical purposes in climatology two digits is almost always surely enough.
It’s easy to replicate exactly someone else’s work when you have exactly the same data and reliable algorithms. Most establishment climatologists simply don’t seem to have got this simple message.
Arrgh!
Bob Tisdale not Bob Foster. Sorry.
Richard
True, but it only goes to show one doesn’t have to be stupid to be a dishonest little weasel.
I believe you. I really, really do.
If you have to deceive to try to win an argument your argument is probably pretty shaky to begin with.
Will, this is the same nut-job that claimed that the slowdown in carbon growth in the early 90s was due to the collapse of the soviet union (and not the cooling due to pinatubo). No one should take this guy seriously…
Niiiiice one govnor!
Lets all remember that eh!
Mmmm i do suppose deception by omission is a little hard to prove. A trend in omissions aint
a good look though. This obviously would include a
trend in cherry picking …
As I recall from catechism class , there were mortal sins ,venial sins and sins of omission = I have not done those things I ought to have done. mea culpa!
Once again. If you adjust the data, it is no longer THE DATA! Same goes for UAH as it does for GISS or any other data set that is no longer the data set. Why bother measuring temperature at all?
You can/must adjust the temperatures in the UAH/RSS at a later date if you have found a systemic shift in the height of the weighting functions caused by a number of things. The weighting functions drive the inversion and hence the output. Unlike other adjustments though, the adjustment in the weighting functions can be justified and derived on grounds of pure physics.
Then why not use a disclaimer?
It would be simpler than what they went through to “change history”! After all, I bet all the data is still in artchive just like it was collected….
“The Data” is not some God-given record of exact metaphysical temperatures, it is a collection of numbers read off from calibrated instruments at discrete points around the Earth. Figuring out how best to estimate the ideal temperature based on the numbers you read off imperfect instruments is part of a scientist’s job and it’s why you often have to do adjustments. Note that Bob doesn’t actually address the method for such adjustments. It seems he just doesn’t like the result.
When are these methods ever disclosed in enough detail to replicate?
What I don’t understand, is how they can adjust the measured data by more than a degree and then say that a new record temperature has been set, because it is four hundredths of a degree warmer than the previous record. The global warming since 1950 is less than the adjustments, so the errors in the data are now greater than what they trying to measure.
Not true, Bob does discuss The Carl et Al adjustments. Much has already been said about the inclusion of “not ready for science” survey devices.
““The Data” is not some God-given record of exact metaphysical temperatures,”
Instead, “the data” is untainted. After adjusting, it is now “tainted”. Your reasons for doing so may well be legitimate, but it is nevertheless tainted.
I have examined some of these alterations in places where I have lived. The untainted data agree with my personal experience, the homogenized data or tainted data does not agree. For a bit more specific, I’m referring to the airport temperature measurements at a small airfield in Alaska where the normal daily wind is 20 to 50 knots and is “calm” maybe one day per year. There is no need to adjust its temperature. Any heat developed on the runway is blown out to sea immediately.
Foster seems more like Hansen’s Chihuahua. What a drongo.
+1
+2
+3 Had to google drongo.
And a galah, not to mention a wowser.
Hahahahahahahahah……..aaaahhhh…….hahahahahahahahhahahaha……..ahhhhhhh…….hahahahahahahahhahahaha………..ok ok ok I’ll stop laughing now………that’s some funny stuff Bob, it must be bloody amusing to blog your story with the opportunity to hammer Tamino in the process, did you ever think such a gift would come your way?
Seems like Hansen’s bulldog is Tisdale’s bitch.
Will someone clean up his mess and dispose of it properly?
You are contradicting yourself, Bob. As you point out very clearly in the start of this article, the topic at hand was the difference between the Karl et al changes and the UAH changes, and more particularly your negative attitude towards the former and your positive attitude towards the latter.
You tried to change the topic to focus only on the pause, but that is just a red herring, since it diverts from the original discussion. Furthermore, if you claim a “fundamental” difference, you should not be surprised that people expect the difference to be ubiquitous and you cannot hide behind the fact that someone else has picked the start date. If the difference is indeed fundamental, it should not depend on a small subset only, no matter who picked the start date.
Aran, would you prefer it if that sentence read, “The time period at hand is the hiatus as described by Karl et al.”?
No, because it will still be a red herring. You are changing the scope of the discussion.
Aran continued, “You tried to change the topic to focus only on the pause…”
Now that’s twist of reality, Aran.
The topic of discussion in this post was the pause; and the primary topic of discussion of Karl et al. was the pause, defined by the start years of 1998 and 2000. Tamino’s more recent post..
https://tamino.wordpress.com/2015/07/20/fundamental-differences-between-bob-tisdale-and-reality/
…was a response to this post:
https://bobtisdale.wordpress.com/2015/07/20/fundamental-differences-between-the-noaa-and-uah-global-temperature-updates/
And the topic of that post was the pause.
The topic of my open letter to Tom Karl was the pause:
https://bobtisdale.wordpress.com/2015/06/10/open-letter-to-tom-karl-of-noaancei-regarding-hiatus-busting-paper/
I didn’t change topics. It has been the pause.
Adios.
You are again cherry picking your starting point. You are right that Tamino responded to your Fundamental Differences post, but you know very well that that was again in response to a post by Tamino, which was the original article that started all of this.
So if I may complete your own summary of events:
Tamino’s more recent post […]
was a response to this post […]
and the topic of that post was the pause and it was a response to an earlier post from Tamino where the subject was not the pause but the difference in attitude towards the changes by Karl et al and the changes by UAH.
So there you have it. In your ‘Fundamental differences’ post, you narrowed the scope from the changes in general to the changes while only looking at the years since 1998. That’s both a red herring and cherry-picking.
The original subject was not the pause and you know that very well, because in your ‘Fundamental differences’ post you actually summarise Tamino’s critique. Your own words:
That was the original subject of discussion. No word about the pause or hiatus or slow-down or whatever you want to call it. You dragged that into it and you know it very well. So don’t play stupid and claim it has always only been about the pause. It has not and you have said so yourself previously.
Aran says: “You are again cherry picking your starting point…”
Are you a new troll here, Aran?
The reason I ask: You, Aran, are wasting your time and mine, with your repeat of Tamino’s bogus claim and your failed attempt at a spin on a quote from an introductory statement in my earlier post.
In a discussion of the data presented and used as a reference in Karl et al., who used 1998 as a starting point for the hiatus, my use of 1998 as a start year cannot be considered a cherry pick, Aran.
Aran, after quoting me, your closing paragraph begins “That was the original subject of discussion. No word about the pause or hiatus or slow-down or whatever you want to call it….”
But you, Aran, fail to recognize that the final paragraph of what you quoted was a discussion of the hiatus. The fact that I didn’t spell it out for you is immaterial. If you, Aran, don’t understand the topic of discussion, why are you belaboring your misunderstandings? If you had read further in the post you quoted, you might have grasped that that post was about the hiatus.
Once again, Tamino’s posts are responses to my posts and my posts were about the hiatus. Tamino failed in his attempt to redirect the discussion from the hiatus, and so are you.
Good-bye, Aran.
I don’t appreciate the name-calling. I would like to refer you to Willis Eschenbachs excellent article on how to disagree and name-calling is the weakest form of argumentation, right at the bottom of the pyramid. Or in the words of highflight56433 just below here: “When all else fails, and facts aren’t on your side demonize your opponent.”
The reason I call 1998 a cherry pick is that, as Tamino correctly observed, what you call a “fundamental difference” between the Karl adjustments and the UAH adjustments, is in fact not a difference at all if you look at longer periods. In other words you have to resort to a subset of the data to be able to claim a difference. Who started with picking the starting year is irrelevant. So if you look at the big picture, the fundamental difference upon which you base your praise for the UAH adjustments and your ridicule for the Karl adjustments simply does not exist. Using a subset of the data to make a claim that would not hold when using the complete data set is the text book definition of cherry-picking. Where the idea for the subset came from does not matter. What matters is that the claim is only valid when focusing on the subset and ignoring the rest of the data. Meaning your fundamental difference is neither fundamental nor a clear difference.
Your claim that “the final paragraph of what you quoted was a discussion of the hiatus” even if it wasn’t spelled out. Does not make any difference, since this part of the quote is no longer your summary of Tamino’s original post, but an introduction of your reply to that. The original post by Tamino dealt with the entire scope of the adjustments, not just the last 17 years. You have dragged the pause into this discussion and you actually needed to do that, because otherwise your self-proclaimed fundamental difference no longer exists.
Aran says, “Who started with picking the starting year is irrelevant” regarding an article about a peer reviewed paper regarding the “pause” / “hiatus”.
—————————————————————————
I see and understand why Bob does not respond to your posts.
I am sorry for the responses, Aran. I found your comments exemplary in terms of eloquence and civility. Being ignored and insulted seems unjust.
Aran:
I am sorry for the responses, Aran. I found your comments offensive, untrue and obtuse while being shrouded in words of eloquence and civility. Your having been answered without inclusion of any of the several insults you deserved seems unjust.
Richard
+1 RichardCourtney
Aran, I suppose you believe Bob is trying to divert the world’s attention from the global crisis at hand; the mass melting of Antarctic Ice, runnaway global warming…etc. It’s more likely that we are discussing the fundamental numbers, on the matter, and how the came to exist. In the case of Carl et Al. I’m sure you will agree that NOAA has a little egg on its face.
Owen, I can’t speculate on what Bob is trying to accomplish here. As for the “fundamental numbers” I have pointed out that Bob is only looking at a small part of the data and refusing to include more. Also it seems his comparison is off, since he is comparing a data set dominated by buoy measurements with a data set consisting only of ship measurements. As for Karl et al., they have corrected for a systematic error in the data, which I think is an improvement. I’m sure you’ll agree, unless you prefer to keep using a data set with known errors.
Wow, a number of sematics-n*zi zombie-trolls have arisen from the grave due to Tisdale’s cutting analysis.
Bomber-target-flak and all that…
Well of course the start date of the pause is cherry picked. You look for the inflection points to bound a time-bounded phenomenon. 1998 is obviously an inflection point; no reason exists to pick any other point since the topic is the pause.
Prior to that it wasn’t the pause.
After today maybe it will still be pause, maybe not.
At least they are blessing you with the “denier” tag. Poor loser. When all else fails, and facts aren’t on your side demonize your opponent. Eventually, they’ll have to try to explain all the winter cold that keeps going on and on… like the Energizer bunny…speaking of hyperdenialopathy….
Keep at them!
http://notrickszone.com/2015/07/21/noaa-record-heat-claims-dismissed-in-independent-datasets-we-see-widespread-model-failures-says-expert-meteorologist/#sthash.KZLGjL6w.dpbs
Evidence that NOAA ignores.
Thanks Bob. Grant Foster is fresh out of petards now.
pe·tard
piˈtärd/Submit
nounhistorical
plural noun: petards
a small bomb made of a metal or wooden box filled with powder, used to blast down a door or to make a hole in a wall.
a kind of firework that explodes with a sharp report.
http://www.phrases.org.uk/meanings/hoist-by-your-own-petard.html
perhaps this one is is more fitting.
Just having some fun Anthony,
michael
Mike, my apologies, but you jump in and hammer this every time as if your version is the sole version.
Fortunately, from the link you’ve provided, as well as from many others including ‘Merriam-Webster’:
Origin:
Hoisted on your ‘own’ petard, is believed to be a reference to the lack of dependability said explosive devices were known for.
After all the effort the poor saps expended getting the device to the wall/gate and placing it in position;
a) the device fails to ignite.
b) the device ignites prematurely.
It was a deadly task to places said devices. Nor were fuses the miracle modern fuses are in burning at a reasonably standard rate. Some fuses smoldered badly, others seemed to launch themselves straight into devices triggering immediate explosions.
The saps enjoyed the thought of the engineers who built petards being the ones who installed and triggered their own devices. Eventually this morphed even more into almost any device, even literary, causing damage to the device owner instead of expected targets.
“Mike, my apologies, but you jump in and hammer this every time as if your version is the sole version.”
“Just having some fun” That is all I was doing.
If I stepped on toes I am sorry it was not my intent.
I like everyone else here, try to help when I can.
I need to think on this.
michael
Mike:
No toes stepped on. Which is why I commented with an apology, to you, leading; as I did not want to step on your toes.
You were providing a clear correct definition for a ‘petard’, just that it happened to be one definition of several; and no, all of the definitions are not necessarily totally correct. Most of them are assumptions from traces of old texts.
Grant Foster
Statistician to the retards
Where’s our resident poet ?
It’s 2 AM
They’re all asleep.
Now please hang up
And let me sweep.
===============
Wow, good post – just keep it up, I don’t know how you do it. Your presentations are always right on – and based on science/reality.
You should get a tee shirt with (to quote Grant Foster ) “The “hit man” for WUWT” on it – lol.
I can have them embroidered and personalised for all who want one – cost price only ex Chiang Mai – let me know..Wassup with that hit squad”
Bob, you say
“The data clearly show that NOAA cannot justify the excessive warming rate during the global warming slowdown because the warming rate of the NOAA data is far higher than the dataset they used as reference”
As I asked in your previous post, what statistical justification do you have for that statement? Are the trends in ERSSTv4 and HadNMAT2 statistically different? i.e. What are the uncertainties on the trends in ERSSTv4 and HadNMAT2? If you do not know the uncertainties on those trends, how can you say with any confidence that the warming rate in NOASS and HadNMAT2 are different???
Bob,
Just noticed that the data you are presenting actually contradicts one of your key arguments.
In your Figure 3 (Figure 1 from Karl et al.) the 90% uncertainties on the global sea surface temperature trend look to be 0.00-0.15C per decade over the period 1998-2012.
These uncertainties include the warming rate from HadNMAT2 (0.045C / decade), indicating that the warming rate of the NOAA data is not statistically distinguishable from the warming rate in HadNMAT2.
This is counter to your statement that the warming rate of the NOAA data is far higher than the dataset they used as a reference.
The justifiable conclusion you can draw is something more like:
‘The warming rate of the NOAA data is approximately twice that of the HadNMAT2 data used as a reference; however, the difference in the warming rates is not statistically significant’
Bevan, you concluded your comment with, “The warming rate of the NOAA data is approximately twice that of the HadNMAT2 data used as a reference; however, the difference in the warming rates is not statistically significant”.
While the difference in the trends may not be statistically significant, it is politically significant…inasmuch as, Karl et al. have attempted to do away with the hiatus by overcooking their adjustments to their sea surface temperature data. They failed to present and discuss that difference in their paper, which is why I continue to bring it up.
Cheers.
but Bob, if the difference is not statistically significant, that says they haven’t overcooked the adjustments, as the trends of NMAT2 and ERSST4 agree within the uncertainties?
Refried beans.
@Bevan
It means that their claim of “pause busting” is not justified. The more intellectually honest stance, supposing that we grant statistical equivalence, would be to say something along the lines of: “We found a difference that might lead to the conclusion that there isn’t a pause, but really, at this point, no one knows.”
This is a fine example of people who have heard of p-values but can’t use statistics.
If you’ve proven statistically that there is no difference between ‘A pause in global temperatures of 18 years’ and ‘No pause in global temperatures of 18 years’ then… what have you proven?
Well, as there clearly is a very big difference between there being a pause and there not being a pause, what you’ve proven is that you’ve got your stats wrong.
Most people would keep quiet about that.
But those who can’t use statistics don’t realise that they can’t.
Yet through time, and continues changing of the past, they will reach their “warmest ever” objective, all the while ignoring that both satellite data sets, calibrated to the most accurate thermometers , immune to UHI changing stations, homogenization, scarcity of measurements, etc., show that 1998 was the warmest ever by a factor about 1,000 PERCENT larger then the “warmest year ever” nonsense they manufacture.
They will ignore that the satellite evidence, via they large evidence that 1998 was considerably and easily and statistically significantly warmer then 2010, 2014 and 2015. They will ignore that the troposphere was supposed to warm FASTER then the surface. They will ignore the increase in global sea ice now enhanced by increasing ice in the NH. They will ignore the flat and very minor sea level trend. They will ignore that all the harms of CAGW are failing to manifest, while the benefits, saving massive amounts of fresh water and massive acreage of land are feeding close to one billion people every year.
instead they will manufacture a tiny bit of warming, encourage “warmest year ever” nonsense headlines all over the world while crying doom for humanity, all they while padding their wallets and take home pay, preventing real problems from being addressed.
Thanks, Bob.
It is silly of Tamino not to address your proposition. It might taken that he can’t.
I think he can’t.
nice post bob . hansens bulldog ? reminds me of my grandmothers poodle .
Which end of your Grandmother’s poodle?
/sarc maybe
The fact that there has been a hiatus of 18 years without warming supports the assertion that are one or more fundamental errors in the CO2 theory/calculations.
While we are waiting for abrupt cooling which will help to advance the discussion/public interest as to how solar cycle changes caused cyclic warming and cooling in the paleo record and how solar cycle changes caused the warming in the last 30 years, I have been researching the foundation of the cult of CAGW.
If there is no significant surface forcing change due to a doubling of atmospheric CO2, then there is no CAGW problem to solve. The climate change issue then becomes what to do about abrupt cooling and the political fallout related to the end of the climate wars.
It appears the founding fathers of CAGW, had to fudge the CO2 forcing calculations to create the initial CO2 forcing change for a doubling of atmospheric CO2.
There are two key issues.
1) It is a fact that greenhouse gases increase convection cooling which reduces the lapse rate. Hot air rises which causes colder higher air to fall. That is convection cooling.
The fundamental CO2 forcing calculation (no feedback case, lapse rate frozen, unchanged in the double atmospheric CO2 case) which is the basis for CAGW, assumed there is no increase in convection cooling due to the greenhouse gases.
An increase in convection cooling would of course offset the greenhouse gas warming.
The no ‘feedback’ analysis determined that there would 4 watts/m^2 increased forcing at 5 km and at the surface of the planet. The 4 watts/m^2 was later changed to 3.7 watts/m^2.
As Kimoto notes in the below review of the CO2 science or lack of science, the net effect of an increase in greenhouse gases is to increased the lapse rate (A change in the lapse rate of 6.5C/km to 6.3C/km 3% increase in the convection effect due to the greenhouse gases). The result of in the lapse rating changing by 3% is that for a doubling of CO2 the surface warms 0.1C to 0.2C while the atmosphere at 5 km warms 1C. A warming of 0.1C to 0.2C is trivial, does not cause any change in surface forcing, the no feedback case is hence the same as the with feedbacks case.
2) The second issue is it appears the doubling CO2 calculation also neglected to take into account the scientific fact that the absorption spectrum of water and CO2 overlap. Lower in the atmosphere particularly in the tropics there is a great deal of water vapor. Check out figure 2 in this paper. Taking the water vapor/CO2 overlap into account reduces the surface forcing by a factor of 4 from 4 watts/meter^2 to an average of roughly 1.1 watts/m^2 forcing at the surface of the planet.
The average of 1.1 watts/meter^2 forcing at the surface of the planet which is the result if the scientific fact that the absorption spectrum of water and CO2 overlap is taken into account, will be further reduced due to increased greenhouse gas convection.
http://journals.ametsoc.org/doi/pdf/10.1175/1520-0469%281982%29039%3C2923%3ARHDTIC%3E2.0.CO%3B2
http://hockeyschtick.blogspot.ca/2015/07/collapse-of-agw-theory-of-ipcc-most.html
https://drive.google.com/file/d/0B74u5vgGLaWoOEJhcUZBNzFBd3M/view?pli=1
Nice reference, William, but just a few things from “Radiative Heating Due to Increased CO2:”
“Check out figure 2”
From 0 – 20 deg. latitude, 2XCO2 is nil, and is still very low at 30 deg. After that, it goes up some, of course.
Now here is my point, a little more than 70% of solar insolation comes in at the tropics, where H20 has just clobbered 2XCO2. In contrast, only 4% of solar insolation comes in at the polar regions, where the effect of H2O is the least.
So if you do a weighted calculation, you find the feedback is not reduced by a factor of 4, but by a factor of 20(!), or more.
What do you think, does it sound reasonable to you?
I think people way underestimate the importance of water in the IR bands. Interesting that this paper was from 1982 when this whole circus was just getting started. As we go forward in time, we hear less about water vapor, not more (witness the IPCC). The IR absorption by water vapor may be a forbidden topic.
I absolute agree, it is a fact that the earth is a sphere. It is a fact that the most amount of long wave radiation is emitted to space at the tropics not at the poles. In the last 30 years there has been almost no warming in the tropics.
http://www.eoearth.org/files/115701_115800/115741/620px-Radiation_balance.jpg
Perhaps Tamino can explain the two above graphs and discuss the implications of the below linked paper: ‘Radiative Heating Due to Increased CO2: The Role of H2O Continuum Absorption in the 18 mm region’.
The CO2 water vapor spectral overlap paper, published 27 years ago, notes that the fact that there is an overlap of the absorption spectrum of CO2 and water has not been taken into account in the ‘theoretical’ CO2 no ‘feedback’ calculation by Hansen et al and others, which is surreal, as the forcing for a doubling of atmospheric CO2 without ‘feedbacks’ is the foundation of CAGW.
As there is a great deal of water vapor in the lower regions of the atmosphere, particularly in the tropics, which is not a surprise as oceans cover 70% of the planet’s surface, when the CO2 water vapor overlap is taken into account, the ‘surface’ forcing for a doubling of atmospheric CO2 drops from 4 watts/M^2 to 1.1 watts/M^2, with almost no forcing change in the tropics (see figure 2 in the linked to paper).
As I noted when arguing with Gavin Schmidt, at RealClimate five years ago, it is a fact that there has been a reduction in planetary cloud cover in the last 25 years (now 30 years) and the warming in the last 30 years can be completely explained by the reduction in cloud cover. My comment was related to stratosphere cooling, which I noted can be explained as there is less reflected short wave radiation, due to the reduction in planetary cloud cover. Short wave radiation (including reflected short wave radiation) warms the stratosphere when it is absorbed by ozone.
Unlike the atmospheric increase in CO2 the reduction in cloud planetary cloud cover can very, very, quickly be reversed and is very, very, quickly reversed which explains why there is cyclic warming and cooling the paleo record.
http://journals.ametsoc.org/doi/pdf/10.1175/1520-0469%281982%29039%3C2923%3ARHDTIC%3E2.0.CO%3B2
http://www.agu.org/pubs/crossref/2003/2003GL017115.shtml
http://wattsupwiththat.files.wordpress.com/2012/09/davis-and-taylor-wuwt-submission.pdf
UAHV6 vertically …
1. Anomalies
2. Annual Signals
Nice plots, I will have to study them a bit.
Thanks.
So GrantFoster aka Tamino is AlGore’s WitchDoctor’s BullDog ?
Personally I can’t work out what all the fuss is about.
You have presented 2 graphs, one of night-time air temperatures just above the sea, and the other of sea surface temperatures just below that same bit of air. Not surprisingly, they are in broad agreement, at least over a period of about half a century, as helpfully shown by the extended graph.
Sure enough, when you zoom in really close you can find discrepancies of a few hundredths of a degree, and by taking a subset of 13 years out of 44, you find a slight difference in the trends.
It seems this is more of a slanging match between Bob and this guy Foster, and whatever logic either side can demonstrate is lost in the language – words like “bulldog”, “hit-man”, “magical”, “overcooked”, etc. As a result, the explanation of which dataset we should believe is lost in the spat.
Richard, NOAA used the HADNMAT2 marine air temperature as a reference for their new ERSST.v4 sea surface temperature dataset, which serves as the ocean portion of the GISS and NOAA combined land-ocean surface temperature data. In fact, NOAA used the HADNMAT2 data for bias adjustments for their new ERSST.v4 data. Yet somehow the short-term warming rate of the new NOAA data is warmer than the data they used for bias adjustments.
Regarding zooming in really close, the intent of NOAA’s revisions were to raise the warming rate a few ticks during that short-term 13-year period, not the 44-year one, so that they could claim there was no hiatus. That’s why the 13-year period is the focus and why those few ticks that NOAA can’t explain are important.
Sorry that that got lost in the translation with the exchange with Tamino.
Cheers.
“.. the intent of NOAA’s revisions were to raise the warming rate a few ticks..”
…
Bob, your mind reading abilities are so impressive. Can you do me a favor and use them on my soon to be ex-wife? I need to understand her intentions. Compensation will be provided.
Joel D. Jackson says, “Bob, your mind reading abilities are so impressive…”
Joel, have you read Karl et al “Possible artifacts of data biases in the recent global surface warming hiatus”? Any reasonable person would come away with the understanding that the primary intent of NOAA’s revisions were to raise the warming rate a few ticks during the hiatus. No mind reading necessary.
No Bob, you cannot determine ” that the primary intent of NOAA’s revisions were to raise the warming…”
…
That is just you showing your bias.
..
PS….Proper English is ” that the primary intent of NOAA’s revisions WAS to raise the warming…. since “intent” is singular.
Additionally Bob, if you can discern “intent” just by reading a paper, can you clue us all in to what the “intent” of the UAH revisions were?
PS….Proper English is ” … can you clue us all in to what the “intent” of the UAH revisions WAS?… since “intent” is singular.
Both intended to correct errors. One, an error of the algorithm; the other, an error of nature.
=================
Joel D. Jackson:
Wow, we’re all wondering why Mrs Jackson wants to give you up. What could it be, I wonder? Umm? No, can’t think why she’d want to let you go.
Petard?? Retard??
Inded Kim, JJ wishes to ignore climate gate, as well as dozens of quotes showing the political nature of the entire CAGW movement, the sixty plus reasons for the pause, the political statements about warmest year ever based on 3/100th of a degree of a fubar data set, fully contradicted by satellite data sets showing it not to be true by a margin 1000 percent greater. Funny how they can find dozens of reasons for cooling or lack of warming, but the evil molecule emitted by man is almost singular in the cause of warming, all by it lonesome, outweighing all other factors.
It is not a magical assumption of intent, it is a large body of evidence demonstrating the corruption of science for political purposes.
Joel D. Jackson July 21, 2015 at 7:45 pm asked “Bob, your mind reading abilities are so impressive. Can you do me a favor and use them on my soon to be ex-wife? I need to understand her intentions. Compensation will be provided.”
Joel, my man, you have asked this of Bob but I would like to help you out myself. I have read many of your comments here (too many really) and can see that you are an asshat of the first rank. It would be a fair guess that your wife may be getting tired of you. I know I am and I only have to read a few comments by you since I can scroll over most of them.
I know that you will take umbrage at my use of “asshat” and this post may even go to moderation over that word, but it the English word that best describes your on-line personality here. You may be a wonderful human being despite your wife’s contrary judgement, but no one could tell that by your interactions here.
Have a good day and I really hope this helps you with your soon to be free wife. (if one exists, I really don’t know if you fooled some poor girl into marring you in the first place)
PS: you can send my compensation, if any, to the charity of your choice.
Bob,
You keep saying that NOAA used the HADNMAT2 data set as a reference, but in fact, it was only used as a reference for the ship measurements in the ERSST.v4 dataset. Ship measurements make up only ~10% of the ERSST.v4 dataset so there is no reason that they would line up exactly (if the difference is even statistically significant). The HADNMAT2 data is not used as a reference for the other 90% of the temperature measurements, which are made by buoys.
Then why was the paper with all of its statistical efforts and revisions necessary? Why does Foster need to defend it?
The authors of the revisions obviously see the need for it, so perhaps you could try just a little harder?
Foster Grant?? Wasn’t he that guy on TV who was always drunk?
No that was Foster Brooks, who had an act. There’s no need to make such insinuating comparisons. Stop it.
here’s what I thought…
Is that really Hansen James behind that Foster Grant?
Tamino’s comments are typical of scientists who tend to look at the big picture, and are not worried about variations due to the weather. And Karl et al. also take the long view, based most of their adjustments on the early portions of the entire record, while having a slight but interesting effect on the last 20 years.
Tisdale is more worried about the demise of his little hiatus, which looks like with 2014 and now surely 2015 is evaporating. Oh well. Deal with it.
Trafmamdore, you are ignoring that both satellite data sets, calibrated to the most accurate thermometers , immune to UHI changing stations, homogenization, scarcity of measurements, etc., show that 1998 was the warmest by a factor about 1,000 PERCENT larger then the “warmest year ever” nonsense they manufacture.
You ignore that the satellite data sets demonstrate that 1998 was considerably and easily and statistically significantly warmer then 2010, 2014 and 2015. you ignore that the troposphere was supposed to warm FASTER then the surface. You and the alarmist ignore the increase in global sea ice now enhanced by increasing ice in the NH. They will ignore the flat and very minor sea level trend. They will ignore that even their manufactured warming is far below the IPCC computer model mean on which the predicted harms of CAGW are based. They will ignore the slight increase in NH snow. They will ignore record ice on the great lakes. They will ignore that all the harms of CAGW are failing to manifest, while the benefits, saving massive amounts of fresh water and massive acreage of land are feeding close to one billion people every year.
(That is a lot of ignoring)
instead they will manufacture a tiny bit of warming, encourage “warmest year ever” nonsense headlines all over the world while crying doom for humanity, all they while padding their wallets and take home pay while shamelessly preventing real problems from being addressed
David A you are ignoring that satellites don’t measure surface temperatures.
JJ you are ignoring every cogent point I made, while informing me of something obvious, but not cogent.
Reblogged this on kingbum78's Blog and commented:
Just mentioning Hansen makes me sick to my stomach
The government unemployment statistics are useless if you want to figure out how many people do not have jobs. Same here – the temperatures quoted are just the average of a set of numbers. You should not expect them to have any resemblance to the actual global average temperature, if such a concept has any meaning in the first place.
Great comment. Short, to the point, understandable, and spot on target.
+1
In the published Foster and Rahmstorf 2011, Foster just inverted the sign of one of his regression variables (the sign for the solar cycle influence) and went on about his business as if it were nothing to worry about. The reason the regression variable needed to be inverted to make sense is that it was negative when it is supposed to be positive. The reason it came out negative is that he was deliberately using a known to be out-of-date and contaminated dataset for the solar cycle which had suffered from degradation in one of the instruments used to construct it.
So here we have a statistician (writing textbooks even) who has just changed the sign of one of his regression variables and used a contaminated dataset and published it anyway. Where were the reviewers. Where is the honesty. He obviously knew what he was doing. He did it because it made global warming look bigger than it really was.
Nothing from this person can be trusted.
Reflections in a jaundiced eye.
===========
When you do it, it is cherry-picking, when they do it, it is not. Because:
“When the government does it, it is not illegal” – President Richard M. Nixon
During the Watergate affair. The “-Gate” that started them all.
Numbers seeking to describe global average temp. for a month or a year are not good for much of anything beyond comparing them to other numbers that describe the same thing over large time frames. Perhaps over the span of a century or more we would could see a meaningful pattern develop. What the climate alarmists are doing now is to mimic day-traders that hang on every uptick of their favorite equity as confirmation of trend. We’re being treated to NOAA’s “hottest June”, a tiny uptick, as a confirmation of dire predictions 100 years out. The only sane conclusion about the FUTURE state of our climate is to not reach a conclusion, but that doesn’t sell any lemonade.
I’ve seen this so many times that when I see someone accusing someone of something, my first reaction now is to generally think they are projecting. After assuming that, I go look at the data to see who’s doing what.
https://en.wikipedia.org/wiki/Psychological_projection
Please, oh please … no more Wiki-bloody-pedia !
That is for morons.