From the University of Arizona:
Sea level spiked for 2 years along northeastern North America

Sea levels from New York to Newfoundland jumped up about four inches in 2009 and 2010 because ocean circulation changed, a University of Arizona-led team reports in an upcoming issue of Nature Communications.
The team was the first to document that the extreme increase in sea level lasted two years, not just a few months.
“The thing that stands out is the time extent of this event as well as the spatial extent of the event,” said first author Paul Goddard, a UA doctoral candidate in geosciences.
Independent of any hurricanes or winter storms, the event caused flooding along the northeast coast of North America. Some of the sea level rise and the resulting flooding extended as far south as Cape Hatteras.
The paper is also the first to show that the unusual spike in sea level was a result of changes in ocean circulation.
Co-author Jianjun Yin, UA assistant professor of geosciences, said, “We are the first to establish the extreme sea level rise event and its connection with ocean circulation.”
Goddard detected the two-year-long spike in sea level by reviewing monthly tide-gauge records, some of which went back to the early 1900s, for the entire Eastern Seaboard. No other two-year period from those records showed such a marked increase.
The team linked the spike to a change in the ocean’s Atlantic Meridional Overturning Circulation and also a change in part of the climate system known as the North Atlantic Oscillation.
The researchers then used computer climate models to project the probability of future spikes in sea level.
The team found that, at the current rate that atmospheric carbon dioxide is increasing, such extreme events are likely to occur more frequently, Goddard said.
Goddard’s and Yin’s research paper, “An Extreme Event of Sea Level Rise along the Northeast Coast of North America in 2009-2010,” is scheduled for online publication in Nature Communications on Feb. 24. Stephen Griffies and Shaoqing Zhang of the National Oceanographic and Atmospheric Administration’s Geophysical Fluid Dynamics Laboratory in Princeton, New Jersey, are also co-authors. NOAA funded the research.
Yin’s previous work on climate models suggests that weakening of the Atlantic Meridional Overturning Circulation could cause sea levels to rise faster along the northeast coast of North America.
Yin wondered whether such sea level rise had actually been observed, so he asked Goddard to compile the tide-gauge records for the east coast of North America. The 40 gauges, spanning the coast from Key West, Florida, north to Newfoundland, have been recording sea levels as far back as the 1920s.
Goddard’s work revealed a surprise – that during 2009 and 2010, sea level between New York and Newfoundland rose an average of four inches (100 mm). Sea level from Cape Hatteras to New York also had a notable spike, though not as dramatic.
“The sea level rise of 2009-2010 sticks out like a sore thumb for the Northeast,” Goddard said.
His research also confirmed that, as others have reported, sea level has been gradually rising since the 1920s and that there is some year-to-year variation.
About the time Goddard finished analyzing the tide-gauge records, another group of researchers reported that the Atlantic Meridional Overturning Circulation, or AMOC, had a 30 percent decline in strength in 2009-2010. Those researchers reported the decline started just two months before the tide gauges started recording the spike in sea level.
“To me, it was like putting together a puzzle,” Goddard said.
The more he and his colleagues examined the timing of the AMOC downturn and the subsequent increase in sea level, the more it fit together, he said.
The AMOC brings warm water from the tropics and the southern Atlantic Ocean to the North Atlantic and the polar regions. The water then cools and sinks, eventually flowing south in the deep ocean. Yin’s climate model predicted that when the AMOC weakened, sea level in northeastern North America would rise.
In addition to the weakening AMOC, during 2009-2010 the region’s atmosphere was in a very negative phase of the climate mode called the North Atlantic Oscillation. The NAO flip-flops between negative and positive phases.
“The negative North Atlantic Oscillation changes the wind patterns along the northeast coast, so during the negative NAO the winds push water onto the northeast coast,” Goddard said.
Although the NAO has resumed flipping between positive and negative states, observations show that the AMOC, while somewhat stronger, has still not recovered its previous strength.
Even now, sea level is still higher than before 2009, Yin said. He’s not surprised, because most of the climate models predict a weakening of the AMOC over the 21st century.
Yin said that at the current rate of increase in greenhouse gases, most climate models predict a weakening of the AMOC over the 21st century. Therefore, such extreme sea level rise events and coastal flooding are quite likely to occur along the densely populated northeast coast of North America more often.
###
“The researchers then used computer climate models to project the probability of future spikes in sea level.
The team found that, at the current rate that atmospheric carbon dioxide is increasing, such extreme events are likely to occur more frequently, Goddard said.”
The bogeyman carbon dioxide makes a totally unwarranted appearance to scure further grant funding.
What has CO2 levels got to do with a completely natural Oceanic process?
I suppose they have to ba able to link it to global warming to get their funding.
Apart from that it is a very interesting finding.
“ocean circulation changed”
Oh-oh… It is worse than we thought!
For years, while the alarmists said climate change was due to man made emissions , others said it was due to changes in ocean circulation. Now that the effects of changes to ocean circulation are shown to be real, they want to claim that that too is caused by us. On the day that glaciers roll across Chicago, they’ll still be blaming it on CO₂.
If water was piling up off the Newfoundland Coast, was it “missing” somewhere else?
what amazes me is that still the general public is being misinformed to the point of the waters on earth being perfectly even distributed all over the globe. As if gravity doesn’t exist. As if when water moves higher one place it doesn’t get lower another one. As if (stellar/sun) tidal forces don’t displace water in cycles. Rising/lowering sea levels in the range the ‘scientists’ are debating mean completely nothing. But yay 8 centimeters temporal difference on trillions of tons water at one relatively small place on earth and they’re all over the place with BS ‘studies’. Makes me really happy not be a scientist, soon it will have the same value as ‘waste management functionary’ the way they throw out these nonsensical papers.
Seems back to front to me. Greater current leads to higher water levels, not the way they report it. Plus what has co2 got to do with ocean currents, they are driven by gravity and augmented by wind.
So the records show sea level increasing since at least 1920, decades before the claimed affects of man-made CO2 were present.
So why is the current sea level increase cause by man-made CO2 while the earlier sea level rise isn’t?
This is consistent with the meridional course of the jet stream over North America. If the circulation is constant, may cause this effect.
http://earth.nullschool.net/#2015/02/28/0600Z/wind/isobaric/500hPa/orthographic=-121.14,43.30,688
What is the physical explanation for a decreasing AMOC causing increased local sea level? Are not local changes tied more to wind patterns?
And it seems that a weakening AMOC is not good news as it is likely a precursor to a new ice age.
This is the real conclusion of the recent paper by Mmarotzke and Forster: The pause is not a new problem, models have always been that bad ! Another new paper linked in that thread says we’ll have to wait maybe another 10 years before the models can be proven wrong.
Well if they are not even falsifiable for another decade, come back in ten and crap on about they “predict”.
http://climateaudit.org/2015/02/05/marotzke-and-forsters-circular-attribution-of-cmip5-intermodel-warming-differences/#comment-752804
So the kneejerk CAGW comment by Yin is irrelevant until someone provides a model that does work. But this is now boilerplate text that gets automatically inserted into any paper, irrespective of the subject or the findings.
Also See: My two essays on similar topics:
From the Scientific Urban Legend Department: ‘AGW Sea Level Rise Made Sandy More Destructive’
and
What to do about The Flood Next Time
Let me just point out that as a part of my personal climate related research, I look at tide gages around there from time to time…and while the change is there, its not really very noticeable. It would never have occurred to me that it was ‘unusual’. Now THIS ONE has an unusual event.
http://tidesandcurrents.noaa.gov/sltrends/sltrends_global_station.htm?stnid=970-121
But this one is more like the other gages in that region
http://tidesandcurrents.noaa.gov/sltrends/sltrends_station.shtml?stnid=8418150
Anyone prepared for the sea level rise spikes that happened repeatedly over the last century would have been adequately prepared for this. It does look a little like yet another case of throwing in AGW hot topics for funding or future funding.
A Closer Look At The Cape Hatteras To Cape Cod Cold Spot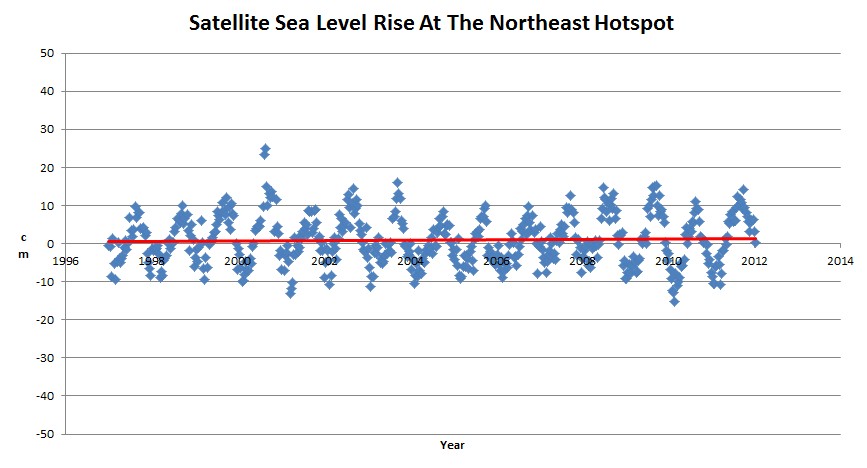
“It turns out that the hot spot is actually a cold spot, with sea level rising at 1.7 mm/year over the last 15 years – just over half the global average.”
https://stevengoddard.wordpress.com/2012/07/03/a-closer-look-at-the-cape-hatteras-to-cape-cod-cold-spot/
It certainly was not reported as a change in circulation. I saw a whole bunch of hysterical headlines about the 12.7 cm or whatever it was.
AO index confirms the change of oscillation in 2009, during a exceptional solar minimum.
http://www.cpc.ncep.noaa.gov/products/precip/CWlink/daily_ao_index/season.JFM.ao.gif
The standardized seasonal mean AO index during cold season (blue line) is constructed by averaging the monthly AO index for January, February and March for each year. The black line denotes the standardized five-year running mean of the index. Both curves are standardized using 1950-2000 base period statistics.
The change can also be seen in the chart NAO (2009-2010).
http://www.cpc.ncep.noaa.gov/data/teledoc/nao.timeseries.gif
The standardized 3-month running mean value of the NAO index. The departures are standardized using the 1981-2010 base period statistics.
Another possibility is that the Laurentide Ice Sheet uplift has ended, in which case oscillations may be expected before an equilibrium is established. This can be seen on the graph above, contributed by ‘Latitude’
http://tidesandcurrents.noaa.gov/sltrends/sltrends_station.shtml?stnid=8443970 sea level has been falling in boston last five years, station is on solid ground, other stations are on sand actually glacial morans.
So there was a four inch spike in two years for Northeast Sea Level? And it appears the region was able to take most of that sea level rise in stride without catastrophic damage, massive dislocation of population, radical change to its ocean fronts, or other macro economic factors. It appears that the populations affected were able to deal with what, on a large scale, is a relatively large change over a short period of time. Doesn’t that argue that 8 inches or so over a century (vs 4 inches over two years) won’t be all that hard to manage?
In a less illumined time whenever someone did something bad, they could say, “It was the Devil made me do it”.
Now in more enlightened times, when any bad natural event that happens on the earth, “It was the CO2 that made it do it.”
We know that water sloshes back and forth in the Pacific, depending on Trade wind strength or westerly wind bursts. Why not the same principle in the Atlantic? These two years saw some of the most negative NAO figures ever for both summer and winter! Water being pushed back, against the normal direction of flow.
I’ll wager we’ll see something similar in a few years (maybe sooner) when the next solar minimum comes around.
The BBC’s reporter earns her Brownie Points by not only reporting the salient facts, but also inserting the ubiquitous “Climate models suggest extreme sea level rises will become more common this century.” within her story.
http://www.bbc.co.uk/news/science-environment-31604953
I’m not familiar with the geography of the NE American coast but a 4 inch sea-level rise causing flooding suggests an extremely flat and low-elevation coastline, maybe akin to the Netherlands without the dykes. Is this feasible?
Over a two year period, rates of sea level rise at most tide gauges, regularly oscillate between ± 50 mm/yr.
I have no idea what these Arizona “Researchers” are talking about.