The first press release announcement thread is getting big and unwieldy, and some commenters can’t finish loading the thread, so I’m providing this one with some updates.
1. Thanks to everyone who has provided widespread review of our draft paper. There have been hundreds of suggestions and corrections, and for that I am very grateful. That’s exactly what we hoped for, and can only make the paper better.
Edits are being made based on many of those suggestions. I’ll post up a revised draft in the next day.
2. Some valid criticisms have been made related to the issue of the TOBS data. This is a preliminary set of data, with corrections added for the “Time of Observation” which can in some cases result in double max-min readings being counted if not corrected for. It makes up a significant portion of adjustments prior to homogenization adjustments as seen below in this older USHCN1 graphic. TOBS is the black dotted line.

TOBS is a controversial adjustment. Proponents of the TOBS adjustment (Created by NCDC director Tom Karl) say that it is a necessary adjustment that fixes a known problem, others suggest that it is an overkill adjustment, that solves small problems but creates an even larger one. For example, from a recent post on Lucia’s by Zeke Hausfather, you can see how much adjustments go into the final product.

The question is: are these valid adjustments? Zeke seems to think so, but others do not. Personally I think TOBS is a sledgehammer used to pound in a tack. This looks like a good time to settle the question once and for all.
Steve McIntyre is working through the TOBS entanglement with the station siting issue, saying “There is a confounding interaction with TOBS that needs to be allowed for…”, which is what Judith Curry might describe as a “wicked problem”. Steve has an older post on it here which can be a primer for learning about it.
The TOBS issue is one that may or may not make a difference in the final outcome of the Watts et al 2012 draft paper and it’s conclusions, but we asked for input, and that was one of the issues that stood out as a valid concern. We have to work through it to find out for sure. Dr. John Christy dealt with TOBS issues in his paper covered on WUWT: Christy on irrigation and regional temperature effects
Irrigation most likely to blame for Central California warming
A two-year study of San Joaquin Valley nights found that summer nighttime low temperatures in six counties of California’s Central Valley climbed about 5.5 degrees Fahrenheit (approximately 3.0 C) between 1910 and 2003. The study’s results will be published in the “Journal of Climate.”
Most interestingly, John Christy tells me that he had quite a time with having to “de-bias” data for his study, requiring looking at original observer reports and hand keying in data.
We have some other ideas. And of course new ideas on the TOBS issue are welcome too.
In other news, Dr. John Christy will be presenting at the Senate EPW hearing tomorrow, for which we hope to provide a live feed. Word is that Dr. Richard Muller will not be presenting.
Again, my thanks to everyone for all the ideas, help, and support!
=============================================================
UPDATE: elevated from a comment I made on the thread – Anthony
Why I don’t think much of TOBS adjustments
Nick Stoke’s explanation follows the official explanation, but from my travels to COOP stations, I met a lot of volunteers who mentioned that with the advent of MMTS, which has a memory, they tended not to worry much about the reading time as being at the station at a specific time every day was often inconvenient.. With the advent of the successor display to the MMTS unit, the LCD display based Nimbus, which has memory for up to 35 days (see spec sheet here http://www.srh.noaa.gov/srh/dad/coop/nimbus-spec.pdf) they stopped worrying about daily readings and simply filled them in at the end of the month by stepping through the display.
From the manual http://www.srh.noaa.gov/srh/dad/coop/nimbusmanual.pdf
Daily maximum and minimum temperatures:
· Memory switch and [Max/Min Recall] button give daily
highs and lows and their times
The Nimbus thermometer remembers the highs and lows for
the last 35 days and also records the times they occurred. This
information is retrieved sequentially day by day. The reading
of the 35 daily max/min values and the times of occurrence (as
opposed to the “global” max/min) are initiated by moving the
[Memory] switch to the left [On].
So, people being people, rather than being tied to the device, they tend to do it at their leisure if given the opportunity. One fellow told me (who had a Winneabago parked in is driveway) when I asked if he traveled much, he said he “travels a lot more now”. He had both the CRS and MMTS/Nimbus in his back yard. He said he traveled more now thanks to the memory on the Nimbus unit. I asked what he did before that, when all he had was the CRS and he said that “I’d get the temperatures out of the newspaper for each day”.
Granted, not all COOP volunteers were like this, and some were pretty tight lipped. Many were dedicated to the job. But human nature being what it is, what would you rather do? Stay at home and wait for temperature readings or take the car/Winnebago and visit the grand-kids? Who needs the MMTS ball and chain now that it has a memory?
I also noticed many observers now with consumer grade weather stations, with indoor readouts. A few of them put the weather station sensors on the CRS or very near it. Why go out in the rain/cold/snow to read the mercury thermometer when the memory of the weather station can do it for you.
My point is that actual times of observation may very well be all over the map. There’s no incentive for the COOP observer to do it at exactly the same time every day when they can just as easily do it however they want. They aren’t paid, and often don’t get any support from the local NWS office for months or years at a time. One woman begged me to talk to the local NWS office to see about getting a new thermometer mount for her max/min thermometer, since it wouldn’t lock into position properly and often would screw up the daily readings when it spun loose and reset the little iron pegs in the capillary tube.
Some local NWS personnel I talked to called the MMTS the “Mickey Mouse Temperature System” obviously a term of derision. Wonder why?
So my point in all this is that NWS/NOAA/NCDC is getting exactly what they paid for. And my view of the network is that it is filled with such randomness.
Nick Stokes and people like him who preach to us from on high, never leaving their government office to actually get out and talk to people doing the measurements, seem to think the algorithms devised and implemented from behind a desk overcome human urges to sleep in, visit the grand-kids, go out to dinner and get the reading later, or take a trip.
Reality is far different. I didn’t record these things on my survey forms when I did many of the surveys in 2007/2008/2009 because I didn’t want to embarrass observers. We already had NOAA going behind me and closing stations that were obscenely sited that appeared on WUWT, and the NCDC had already shut down the MMS database once citing “privacy concerns” which I ripped them a new one on when I pointed out they published pictures of observers at their homes standing in front of their stations, with their names on it. For example: http://www.nws.noaa.gov/om/coop/newsletters/07may-coop.pdf
So I think the USHCN network is a mess, and TOBS adjustments are a big hammer that misses the mark based on human behavior for filling out forms and times they can’t predict. There’s no “enforcer” that will show up from NOAA/NWS if you fudge the form. None of these people at NCDC get out in the field, but prefer to create algorithms from behind the desk. My view is that you can’t model reality if you don’t experience it, and they have no hands on experience nor clue in my view.
More to come…
I have some additional thoughts up here: http://rankexploits.com/musings/2012/initial-thoughts-on-the-watts-et-al-draft/
Its intended as constructive criticism to help improve the paper, not an attack on Anthony or anything of that sort, so be civil.
[snip – Zeke we already covered this issue in email – Anthony]
Climatists’ have been, “locked into a simple-minded identification of climate with greenhouse-gas level. … That climate should be the function of a single parameter (like CO2) has always seemed implausible. Yet an obsessive focus on such an obvious oversimplification has likely set back progress by decades,” (Richard Lindzen, July 2012)
Facts are facts: the surface temperatures of the Earth constantly fluctuate. A supposed rise of temperatures of 0.8 °C in 150 years is just too small to worry about. This study analyzes the surface record as reported by the NOAA and shows half of the global warming in the USA is artificial. In addition to recording temperatures at poorly-sited stations located at airports and in urbanized areas that will of course show increases in temperature trends, Well sited rural, non-airport stations show a warming nearly three times greater after NOAA adjustment is applied.
For folks interested in the details of the adjustments NCDC does, this presentation by Menne at the 2011 AMS conference is a good accessible introduction: https://ams.confex.com/ams/19Applied/flvgateway.cgi/id/18288?recordingid=18288
TOBS has always been a dating issue and never a temperature offset.
Think of a Sin wave being sampled by two observers 1/3 out of phase. Both will correctly record a +1.0 maximum and a -1.0 minimum over their periods of data recording.
To “adjust” one set of valid observations with a set temperature offset, would be dumb beyond belief.
Except for very rare occasions, the maximum temperature will occur around 2:00 PM local time and the minimum around local sunrise.
For after midnight recordings, both of the maximum and minimum temperatures will be dated for the previous day.
For post-sunrise recordings, the maximum temperature occurred on the previous day and the minimum was recorded on the CURRENT day.
This has always been a timing phase offset and never an error with the actual recorded data. Those minimum and maximum temperatures actually occurred.
Thanks for this post and explanation of differing viewpoints on TOBS adjustments.
If I hadn’t made the point clearly in the other thread, I’ll reiterate it in paired down form here: I appreciate and respect both our host, Anthony Watts, and Steve McIntyre precisely for their airing out differences publicly and honestly. This is how it should be done, in my opinion.
McIntyre didn’t say definitively that he will sign on as a co-author in the final version to be presented for publication. I hope he does after properly weighing in on the paper.
REPLY: Steve contributed greatly to the first effort, creating a whole section, not naming him would have been a travesty. It will be his choice for the final though. – Anthony
Anthony, when will the list of station ids used in this paper and their classifications be made available? And maybe some detail about how the classification was made?
REPLY: Hello Ron,
We want to at least get the paper into submission form first, so that we can preserve the years of work that Evan and I and the many volunteers put into it by being able to submit first. Bear in mind that gathering this data caused out of pocket expenses and much time away from my family, plus my openness has been abused in the past. Both Menne et al and Muller/BEST submitted papers before we even got ours out the door. I don’t think it is unreasonable to get my submission in first for once.
That said, I’m intending to provide it to allow for full replication as I did to Dr. Muller and when Fall et al 2011 was published.
We do have description on how the classifications were done in the PowerPoints as well as the paper. – Anthony
Hey look at that, all suggestions for robust trend analysis are completely ignored!
REPLY: No that’s an assumption on your part. We’ve looked at everything in the thread, including yours. Suggestion: you’ll get further in this thread by being more cordial. People who also use their real name rather than lie with the first comment made by using a fake name, also tend to be taken more seriously. Thanks for your consideration. – Anthony
TOBS adjustments always confused me. If a thermometer measures the maximum and minimum, why would TOBS affect a multidecadal trend? I had the impression the TOBS could alter a monthly or annual average because the depending on the Time of Observation the temperature could carry over into the next time period. But why would that affect a trend?
Ummm, the difference is the temperature doesn’t fall and rise with the regularity of a Sine wave.
Thanks for all the work. You are correct, the pre-posting of this has been a remarkable success, and will assist in carving the way in how science can be reviewed by ALL!! I have one question….do you feel at all “bothered” by “tiresome” distracting questions from those who “only want to find fault with your work..”? ;P
REPLY: No of course not, if I was I’d be ignoring suggestions like the fact that TOBS needs to be addressed. So we are. I don’t mind valid criticisms of the work. Small minded people who want to tear me down personally or speak in third person lagomorphic languages do become tiresome though. – Anthony
I think he jumped the gun by a week myself.
“Ummm, the difference is the temperature doesn’t fall and rise with the regularity of a Sine wave.”
The phase of the sampling periods is what I was trying to express…
A difference in sample timing phases will never be a linear offset.
A very simple concept if you think about it…
I finally found a link that explained TOBS in a way that made sense to me. Apparently bias is only introduced if the time of day that the measurement is made changes. Am I to assume that NOAA actually knows this information and can correct for it in a meaningful way?
http://climateaudit101.wikispot.org/Time_of_Observation_Bias
Anthony,
You deserve credit for putting your money where your mouth is!
Not everyone has the cojones to open yourself (and et al.) up to the public criticism for your work. Leading with your chin hurts sometimes, but I am glad you are willing to do so!
Sure, but also the “observers” to use your analogy (or varying measuring times) aren’t going to be equidistant apart either.
The point is I just don’t know the magnitude of difference TOBS makes, but I know it isn’t likely to be a neat zero.
Think of TOBs this way:
Suppose for 5 years you take one temperature measurement a day at sunset. At that point you change the observation time to morning and for the next 5 years take daily measurements at sunrise.
If you take the measurements, turn them into monthly means, and calculate the trend over 10 years you will get rather biased results.
It will be interesting to see what the “peers” do for the peer-reviewed journal. How will the peers be selected? What will they say? Will they read all the comments?
“Sure, but also the “observers” to use your analogy (or varying measuring times) area’t going to be equidistant apart either.”
…………………..
Having been one of those trained monkeys that obtained the raw weather data at each and every hour, every day of the year, so I kinda know how things were done.
For some weather stations, the observer would record the maximum and minimum temperatures over the last 24 hours with those thermometers. He is human and was not willing to do this stuff at midnight every day. So, for human observers, the standard was around 8:00 AM each morning when there was enough light to even find the darn shelter.
For those of us who did this for a living, the observations were conducted every hour and summary reports were sent out to the World every six hours. The next morning, another team would perform “quality control” and insure that what we issued wa absolutely correct. And if not, then a message correcting the errors would be transmitted.
Entropic Man;
I see some papers to make one wince, too. Nevertheless, these are the ground rules that scientists and scientific journals go by.
>>>>>>>>>>>>>>>>>
It is indeed sad that otherwise intelligent people cling to the past that they are comfortable with. Odder still that someone would first promote peer review as the means to filter out bad science, and in the very next comment, admit that it doesn’t achieve that goal.
The fact of the matter is that there is a huge body of science that is published without the benefit of peer review nearly every day. The paper’s are called patents. Peer review journals do not and never did have any lock on the progress of science, the notion that they do is falsified every single day at patent offices all over the world. As for that portion of science that does progress through the journal system, I’m afraid you are stuck in the past. The world is changing, the internet permits for an exchange of information at a speed and cost that journals in their traditional format can never compete with. The only thing keeping them alive is the kind of attachment to the past the compels me to pick up an actualy newspaper from time to time to enoy along with a cup of coffee, despite my knowledge that the content was obsolete before it was printed, and current content from the same reporters is available instantly for a fraction of the cost on my desk top computer.
Will there be more crap on the internet because it is accessible to all? Of course. Will a tiny cabal of politicaly motivated scientists be able to get editors fired and legitimate science suppressed?
Not a chance. Welcome to the new world.
That TOBS is a PITA.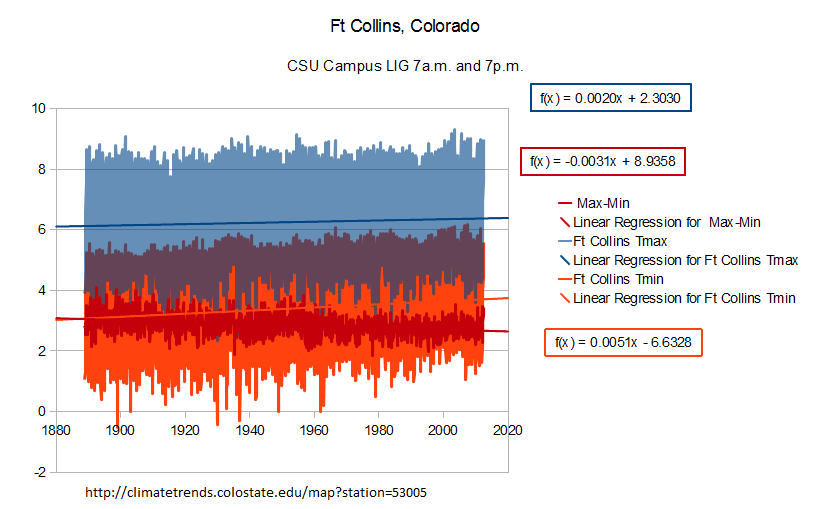
How many sites are there like this?
There was 4 interpolated monthly data points, not in a CRS but a larger well ventilated enclosure, liquid in glass with 7 a.m and 7 p.m readings since day one, did have 4 moves to 4/10 of a mile from its original location.
http://climatetrends.colostate.edu/map?station=53005
Cool Steve, thanks for the lowdown.
However, as Zeke points out, even if the recording times are tightly controlled, when they change, that’s going to skew things, so it should be accounted for in a perfect world. How much of a difference it makes to the end product I can’t say and will leave that for McIntyre and others to elucidate further.
Anthony,
I know you don’t have time for this question but I’ll put it any way, just in case.
If the paper was to somehow use a completely unadjusted TOB, would this then shift the focus of the paper into the area of “Unintended Consequences” (i.e. – debunking other papers in this area) and away from your et al. results that are achieved using contentious yet perpetuated TOB’s ??
I believe I have read a comment that this is being “addressed.” My inference is the information will be provided to select folks who can properly review it.
From my limited non-technical understanding the data is readily available publicly with the exception of Anthony’s siting results using Leroy 2010. This includes the raw and adjusted temp data along with the Leroy 2010 rating spec’s, which would allow anyone to do their own duplication of the work.
To me that seems preferable here – anyone attempting to duplicate should start from the beginning – rather then working backward from the conclusions.
The paper notes they applied the readily available specs of Leroy 2010 to the Fall 2010 USHCNv2 data set.
They identify the data they use: “We make use of the subset of USHCNv2 metadata from stations whose sites have been classified by Watts (2009)”. and “site rating metadata from Fall et al (2011)”. They further narrow: “Because some stations used in Fall et al. (2011) and Muller et al. (2012) suffered from a lack of the necessary supporting photography and/or measurement required to apply the Leroy (2010) rating system, or had undergone recent station moves, there is in a smaller set of station rating metadata (779 stations) than used in Fall et al (2011) and Muller et al. (2012), both of which used the data set containing 1007 rated stations.”. Steven Mosher and Zeke one would assume would have access to this station data as Watts used the same data as Muller 2012 in this regard.
They gave a description of the data used, their methods – how they calculated numbers – and presented their conclusions.
To me it would be much more relevant and useful it would seem, for those interested in replicating to follow the entire process – and see how their siting category counts came out. And only THEM compare to Watts conclusions.
I would also be interested in seeing how the USCRN stations, which were designed per Leroy 1999 (“which was designed for site pre-selection, rather than retroactive siting evaluation and classification”), fare under a review using Leroy 2010.
Watts 2012 notes “Many USHCNv2 stations which were previously rated with the methods employed in Leroy (1999) were subsequently rated differently when the Leroy (2010) method was applied in this study”…
Again, it would be very interesting, and potentially valuable, to see if the new USCRN sees the same siting quality results using Leroy 2010.
One more TYPO:
299 As in Fall, et al (2011), Menne (2010), and Muller (2012), only the heat source/sink
300 proximity and area ratings from Leroy 2010 and are do consider ground-level vegetation
301 or shade.
I suspect from the paragraph following that should say we only consider heat sink/source under Leroy 2010, and not shade or vegetation ….
Why not just offer a TOBS and non-TOBS graph with a discussion?