Guest post by Joseph D’Aleo AMS fellow, CCM
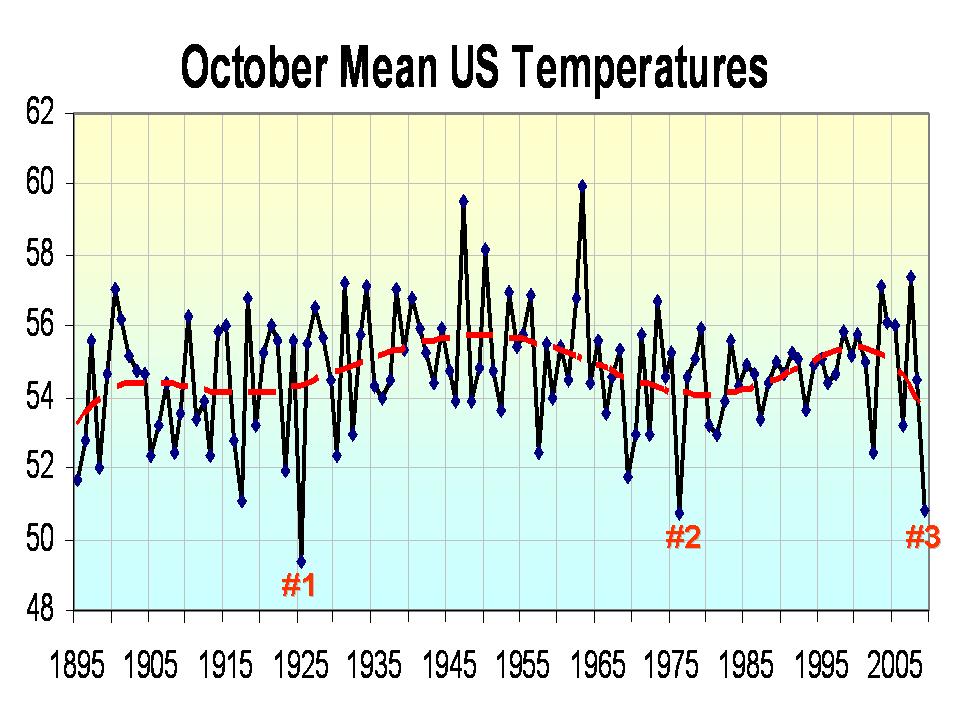
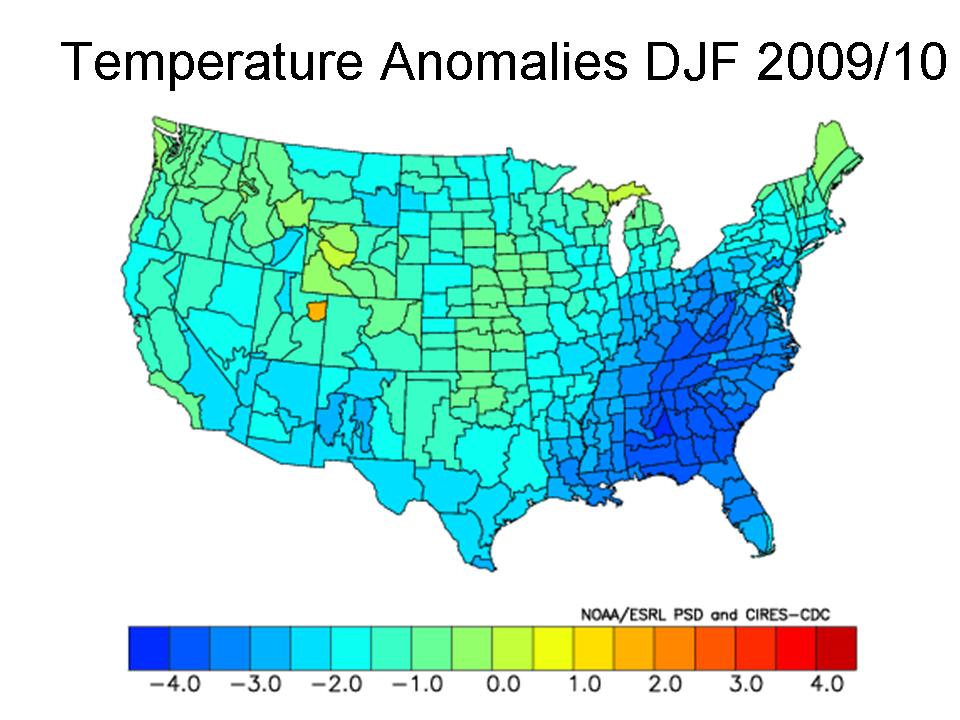
NCDC has compiled the October temperatures and it ended up the 3rd coldest in 115 years. As we have shown it was cold over almost all the lower 48. Indeed only Florida came in above normal. There is no [NOAA/NCDC] press release out yet but it should be interesting.

Enlarged here
October with a mean of 50.8F was behind only 1976 with 50.7F and 1925 with 49.4F.

Enlarged here
Also the University of Alabama global temperature is out and it is down this month. Hadley came in late for September but it was down. The trends since 2002 continue down for both even as CO2 rise.

Temperatures may pop globally with the second surge in El Nino the next two months. A warm pool (depression of the thermocline) induced by a westerly wind burst last month with a negative Southern Oscillation Index has been pressing east. A prior surge had produced a first peak in El Nino in July. It weakened after with a cooling of the water in the eastern Pacific as the first warm surge was mixed out and cold water upwelling increased off South America. The same thing will happen after the El Nino comes to a second larger peak in early December. Typically in cold PDO phases, El Ninos, are truncated – that is they end early and tend to be weaker (up to moderate strength). See the similarity to other years in this post here.
When you look at other years in cold PDO with a quiet sun and transition to an easterly QBO (Quasi-Biennial Oscillation) you get a cold winter especially in the east.

Enlarged here
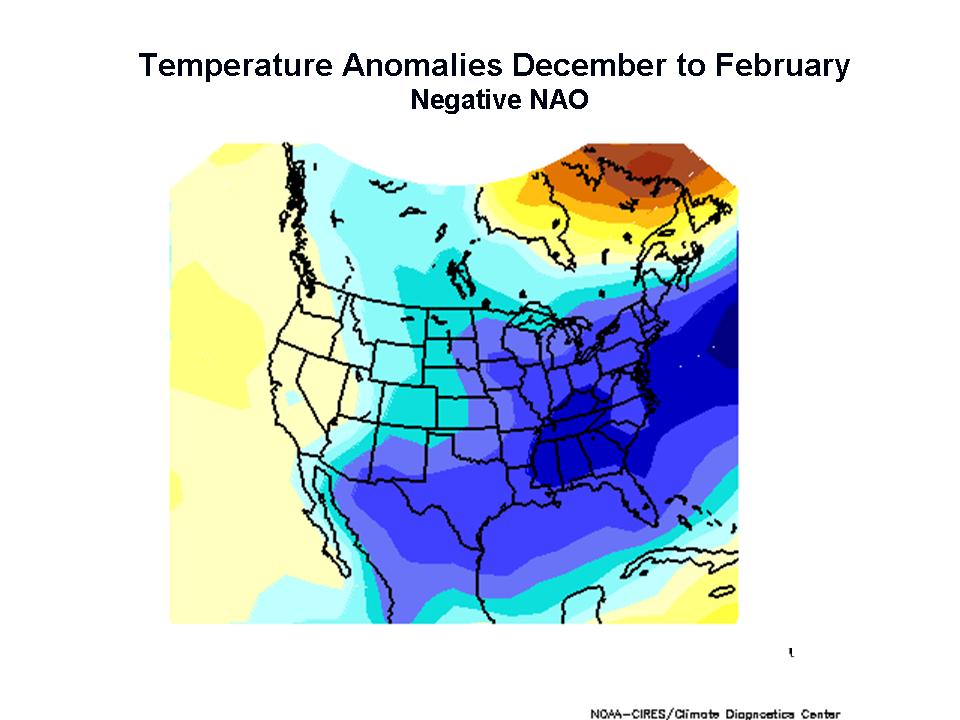
A stratospheric warming is more likely in these conditions, favoring high latitude blocking and cold air intrusions. We have seen much more blocking this year in part due to El Nino, in part to low solar and in part to high latitude volcanoes (Redoubt and Sarychev). See how a negative North Atlantic Oscillation (NAO) and Arctic Oscillation (AO) correlate with winter temperatures.

Enlarged here
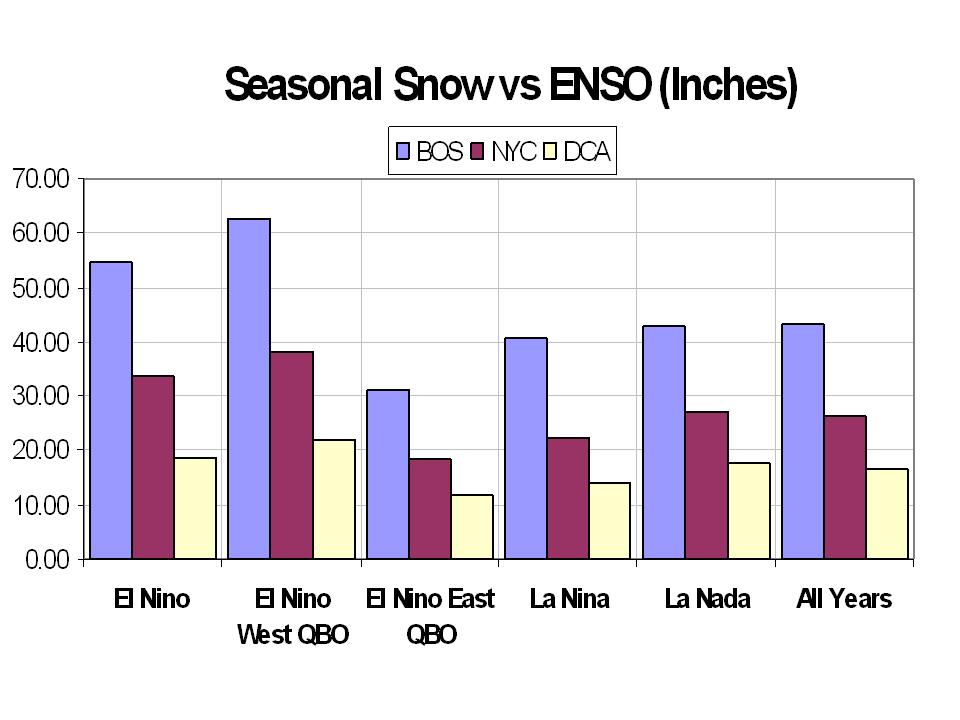
Big east coast storms for DC, New York or Boston are very likely in westerly QBO winters but not easterly. Since we will be transitioning from west to east, one might think we may still manage a few decent coastal storms and maybe a blockbuster, if the cold comes early and the QBO is slow to flip. Often in easterly winters, the snow is actually heavier south (like Norfolk).

Enlarged here
A negative NAO though is favorable for east coast storms and snow. This graph is for Boston, New York and DC are similar.

Enlarged here
Printable PDF version of this article here.
This reminds me a little of the recent article on the warming of the Antarctic peninsula. In the same vein a warmist would say Florida is simply more proof of global warming 😉
Here is a quote from last August:
Fabron (13:33:58) :
Kath (10:36:59) :
“I wonder what this winter will be like.”
According to observations of the Gulf Stream, I would expect for West Europe’s winter to be slightly warmer of 2008-9 and the North American (Canada and USA) Atlantic coastal environs colder of the same.
http://wattsupwiththat.com/2009/08/09/sunspotless-30-day-stretch-possible-in-the-next-day/
Still the same.
What about winter?
NOAA says this :
Warmer-than-average temperatures are favored across much of the western and central U.S….Alaska: Milder-than-average temperatures except along the western coast
http://www.noaanews.noaa.gov/stories2009/20091015_winteroutlook.html
They had a similar forecast last year and they were wrong. This post from WUWT shows that roughly the opposite happened :
http://wattsupwiththat.com/2009/01/10/mid-winter-report-card/
How did October work out in Canada? After having possibly the hotest September on recored, October was unbelievably cold. I suspect that we set some recordes up here as well.
Joe Romm at Climate Progress insists we take his 2099 projections with his 2020 projections and over rule the current facts. The only thing controlled by man is tax rates.
Gene Nemetz (07:07:30) :
What about winter?
NOAA says this :
Warmer-than-average temperatures are favored across much of the western and central U.S….Alaska: Milder-than-average temperatures except along the western coast
MILDER than average? Do they have some aversion to saying COOLER? No problem with warmer, though.
In the end the temperature of the earth is fairly consistent, what we measure in months, or years, decades is an arbitrary set of time periods that have meaning only because our lives are so darn short in comparison to geological events. We are creatures of faulty memory and can easily be swayed into thinking that a heat wave one year means a confirmation of faulty science.
Our models are just that, models and so long as they are accurate they are good models. Unfortunately we now have a set of scientists that are more advocate then scientist. If we are lucky and they will be shown to be wrong often enough and will admit to being wrong. Unfortunately since they have become advocates rather then scientists they have realized being right is tied to their meal ticket now. If they are wrong they will no longer get funding so they deny truth or gloss over it with glib remarks. They are no longer scientists, they are politicians. Fix the models, being wrong is just one more step to being right.
Sad to have entered into a new dark age of science. Let us pray it is short lived.
How will they spin this? How about, the third warmest October in the last 3 years?
On Oct 9, I saved the NOAA 3 month predictions, so I could see how they turn out. Here is what the NOAA prediction looks like:
http://i34.tinypic.com/307sp3t.jpg
Since we have a consensus that, James Hansen, Al Gore, The IPCC have all committed FRAUD and we (Anthony & team) have proven the Earths temperatures to be well within the norms for the EARTH… when are we going to expose the fraud…
We know Al Gore and the IPCC are in it for the money and power… what does James Hansen get out of it… is he just a useful rube?
We need to consider the Political class to have 3rd grade reasoning abilities and approach them at the appropriate level – I can only Imagine the payoffs that have been promised…
We have to expose ALL of the SCAM in the Trillions of dollars involved in TAXing energy and exactly who benefits… we have to have a populist revolt against all of these Madoff schemers…
I ran across a very easy to follow site http://plantsneedco2.org/
perhaps we could find (and or create) a few more sites that may be able to help with a populist program?
Does anyone see any value in this approach?
Jon.
I find it unsurprising that US temperatures are so low. With the current quiet state of the sun and an El Nino which can’t make it’s mind up I expect the NH winter will be cold and long.
In the UK, temperatures are just starting to fall, following a nice warm Indian Summer, for a change. In other years this has led to cold log winters, and I’m expecting the same this year. With a bit of luck, we may get a white Christmas. 🙂
Surprising numbers (at least here in Utah), i thought it has been very nice this month
Cheyenne, Wyoming had the coldest October on record. Since the months seem to be alternative warm/cold, maybe November will be mild. However, on the web site for NWS we find,
Does this mean anything for the upcoming winter? Not necessarily. There is no real correlation between a cold fall and a cold winter. The current existance [sic] of El Nino actually tends to bring an increased chance for warmer than average wintertime temperatures to this region.
You’ve got to love that statement of no real correlation between fall and winter, except uhhh that the days are getting shorter and the sun is far south…they mean of course no correlation between temperature anomalies, but we all overlook such sloppiness of expression now, don’t we?
The more these guys/gals at NOAA keep doing this (1000th warmmest month in a 1000 months etc…) the better for those awful denier crowds. Keep it up NOAA NSDC… LOL
Could this October be the coldest ever in the US… if only the good stations from the surfacestations project are used?
anubisxiii (07:53:42) :
Gene Nemetz (07:07:30) :
“What about winter?
NOAA says this :.Alaska: Milder-than-average temperatures except along the western coast
MILDER than average? Do they have some aversion to saying COOLER? No problem with warmer, though.”
Actually this illustrates the growing illiteracy at NOAA, as ‘mild’ means ‘closer to average’, so saying “milder than average” is like saying “more average than average”, as mild can be used to describe a temp as slightly warm but not really warm enough to be called warm, or cool but not extremely cold.
1. amiably gentle or temperate in feeling or behavior toward others.
2. characterized by or showing such gentleness, as manners or speech: a mild voice.
3. not cold, severe, or extreme, as air or weather: mild breezes.
4. not sharp, pungent, or strong: a mild flavor.
5. not acute or serious, as disease: a mild case of flu.
6. gentle or moderate in force or effect: mild penalties.
7. soft; pleasant: mild sunshine.
8. moderate in intensity, degree, or character: mild regret.
9. British Dialect. comparatively soft and easily worked, as soil, wood, or stone.
If we have built this huge greenhouse around us with intensely insulating CO2 – where did all that heat that’s been trapped for the last 100 years go?
“…where did all that heat that’s been trapped for the last 100 years go?”
Haven’t you heard? It’s hidden in the pipeline!
Where’s the trend for October in that mean temp. graph, I don’t see much of anything in the way of trends on it.
Also, do note the daily SOI is positive again and will eventually pull the 30 day SOI back up if it continues, I looked on the TAO site and the trades seem to be picking up again with the westerly winds about down to nothing.
Looking at my area on that map it looks like Wichita may have a very average Winter (or boringly average), which is pretty much some milder/somewhat warm spells, some cold spells, some snow, maybe a little sleet and ice, and some rain.
The NOAA climate models have such robust predictive powers. Only the MET Office in Britain is able to exceed NOAA in its record of providing accurate forecasts of the weather. Of course NOAA doesn’t have its own super duper computer that drains half the power grid when it runs its models.
I follow looping infrared Pacific equatorial weather systems. It is a very good way to get a sense of westerlies versus easterlies, the doldrums, and an uptick or downturn in wind strength. I noticed yesterday that weather systems (clouds, moisture, etc) were traveling at a pretty good clip East to West along the equatorial belt. Last week weather systems were born and then died in place, with nothing to move them along.
Jon Adams (08:14:34) :
“We know Al Gore and the IPCC are in it for the money and power… what does James Hansen get out of it… is he just a useful rube?”
IMO, Hansen is an “extreme” environmentalist that was able to get a prestigious job to use a a vehicle to push his radical views. He probably really thinks he is saving the Earth from Humans. There, I did that without even using the word, .
When NOAA says of Alaska: “milder than average”, they mean warmer than average. But Alaska is too cold to say that 10F is “warmer” than anything, so they say “milder”. Relax, people.
Reading the entire PDF file, I think Joseph D’Aleo has made an interesting winter forecast. Thank a lot for a job well done.
Interesting article in the October 31 Wall Street Journal. The link to it is down for some reason, although it can be seen on other sites that picked it up:
“Late Harvest Sows Problems for Farmers”
http://commoditytradealert.com/blog/?p=3561
The article gives a great “streamflow” map illustrating the extraordinarily wet fall many eastern and midwestern states are experiencing, along with the consequent late harvests. Crises in Iowa, Illinois, Alabama are mentioned, but many others are clearly being affected.
This sounds like historical descriptions of cold periods in Europe.