“Lights Out Upstairs”
James Hansen has published an online letter entitled
A Light On Upstairs? The letter concludes by saying:
My apologies if the quick response that I sent to
Andy Revkin and several other journalists, including the
suggestion that it was a tempest inside somebody’s
teapot dome, and that perhaps a light was not on
upstairs, was immoderate. It was not ad hominem, though.
I haven’t seen the original letter and don’t know who the
comment was about. However, it certainly sounds like an ad
hominem remark and one that is highly inappropriate for a
federal civil servant. I have a number of comments about
other aspects of the letter.
Hansen says:
Recently it was realized that the monthly
more-or-less-automatic updates of our global temperature
analysis (http://pubs.giss.nasa.gov/abstracts/2001/Hansen_etal.html)
had a flaw in the U.S. data. In that (2001) update of
the analysis method (originally published in our 1981
Science paper – http://pubs.giss.nasa.gov/abstracts/1981/Hansen_etal.html)
we included improvements that NOAA had made in station
records in the U.S., their corrections being based
mainly on station-by-station information about station
movement, change of time-of-day at which max-min are
recorded, etc.
Unfortunately, we didn’t realize that these
corrections would not continue to be readily available
in the near-real-time data streams. The same stations
are in the GHCN (Global Historical Climatology Network)
data stream, however, and thus what our analysis picked
up in subsequent years was station data without the NOAA
correction. Obviously, combining the uncorrected GHCN
with the NOAA-corrected records for earlier years caused
jumps in 2001 in the records at those stations, some up,
some down (over U.S. only).
The first sentence “it was realized” certainly makes it
sound like they identified the problem themselves (a
position not taken in the webpage itself.) Moving on, Hansen
says that the USHCN “corrections would not continue to be
readily available in the near-real-time data streams”. If
GISS is using USHCN adjusted data (as appears to be case
from the description in Hansen et al 2001 and the website),
this claim is incorrect. Readers in doubt of this may go to
the USHCN website ftp://ftp.ncdc.noaa.gov/pub/data/ushcn/ ;
the file hcn_doe_mean_data.Z contains three versions of
USHCN data, included the version that Hansen says is
unavailable. This file was most recently updated on March 1,
2007 and, for the majority of sites, contains adjusted USHCN
data up to Oct 2006. At present, GISS has only updated USHCN
records to March 2006. Thus, not only are the adjusted USHCN
versions available, they are available more recently than
presently incorporated into the GISS temperature
calculations.
Data from the other major station archive (GHCN) can be
downloaded from ftp://ftp.ncdc.noaa.gov/pub/data/ghcn/v2 .
The GHCN raw data set and v2.mean.Z and the adjusted data
set v2.mean_adj.Z are both updated all the time, most
recently Aug 11, 2007. In the version that I downloaded in
June, the USHCN record only went to March 2006, the period
of the GISS record. However, readers can confirm that both
the GHCN raw and GHCN adjusted versions have been archived
concurrently and that the switch from one version to another
was not required because of version unavailability.
In this context, the form of the present layer of GISS
corrections seems extremely rushed and inappropriate. If
GISS wishes to start with GHCN adjusted data, then it’s easy
to do so. Just use it. There’s no need to estimate the
required correction to undo the effect of switching data
sets. Just stick with the data set that they started with.
Far simpler and cleaner than throwing another “correction”
into the mix – a correction which has required overwriting
their entire input data for all 1221 USHCN stations prior to
2000.
1998
Hansen goes on to say:
Also our prior analysis had 1934 as the warmest
year in the U.S. (see the 2001 paper above), and it
continues to be the warmest year, both before and after
the correction to post 2000 temperatures. However, as we
note in that paper, the 1934 and 1998 temperature are
practically the same, the difference being much smaller
than the uncertainty.
Unfortunately, this statement is again untrue. The data
online at GISS http://data.giss.nasa.gov/gistemp/graphs/Fig.D.txt
immediately prior to the changes showed 1998 as the warmest
year (admittedly by a negligible margin of 0.01 deg C), but
still the warmest, contrary to the claim made here. GISS has
overwritten this data file and did not preserve an online
version of the uncorrected data that they had previously
shown. However, by chance, I happened to have had the data
in my R-session when GISS made the changes and I assure
readers that the GISS data
purported to show that 1998 was the “warmest”. Hansen may
have been for 1934 before he was against it. But now that
he’s for 1934 once again, he can’t say that he was for it
all along.
In the
NASA press release in 1999 , Hansen was very strongly
for 1934. He said then:
The U.S. has warmed during the past century, but
the warming hardly exceeds year-to-year
variability.Indeed, in the U.S. the warmest decade was
the 1930s and the warmest year was 1934.
This was illustrated with the following depiction of US
temperature history, showing that 1934 was almost 0.6 deg C
warmer than 1998.

From a Hansen 1999 News Release:
http://www.giss.nasa.gov/research/briefs/hansen_07/fig1x.gif
However within only two years, this relationship had
changed dramatically. In
Hansen et al 2001 (referred to in the Lights On letter),
1934 and 1998 were in a virtual dead heat with 1934 in a
slight lead. Hansen et al 2001 said
The U.S. annual (January-December) mean temperature
is slightly warmer in 1934 than in 1998 in the GISS
analysis (Plate 6)… the difference between 1934 and 1998
mean temperatures is a few hundredths of a degree.

From Hansen et al 2001 Plate 2. Note the change in
relationship between 1934 and 1998.
Between 2001 and 2007, for some reason, as noted above,
the ranks changed slightly with 1998 creeping into a slight
lead.
The main reason for the changes were the incorporation of
an additional layer of USHCN adjustments by Karl et al
overlaying the time-of-observation adjustments already
incorporated into Hansen et al 1999. Indeed, the validity
and statistical justification of these USHCN adjustments is
an important outstanding issue.
Arctic Changes
Changes in the relationship of the 1930s to recent values
have not merely been made in the United States. In the
Arctic, there has also been a progressive change in the
relationship of temperatures in the 1930s to recent
temperatures, a point previously discussed at
CA here .
Hansen and Lebedeff 1987 showed very warm 1930s in the
Arctic, as shown in the excerpted figure showing the 64-90N
temperature history.

Excerpt from Hansen and Lebedeff 1987, showing 64-90N
temperature. The horizontal plot is from 1880 to 1985 (as
seen in the full Figure 7 of the original article shown
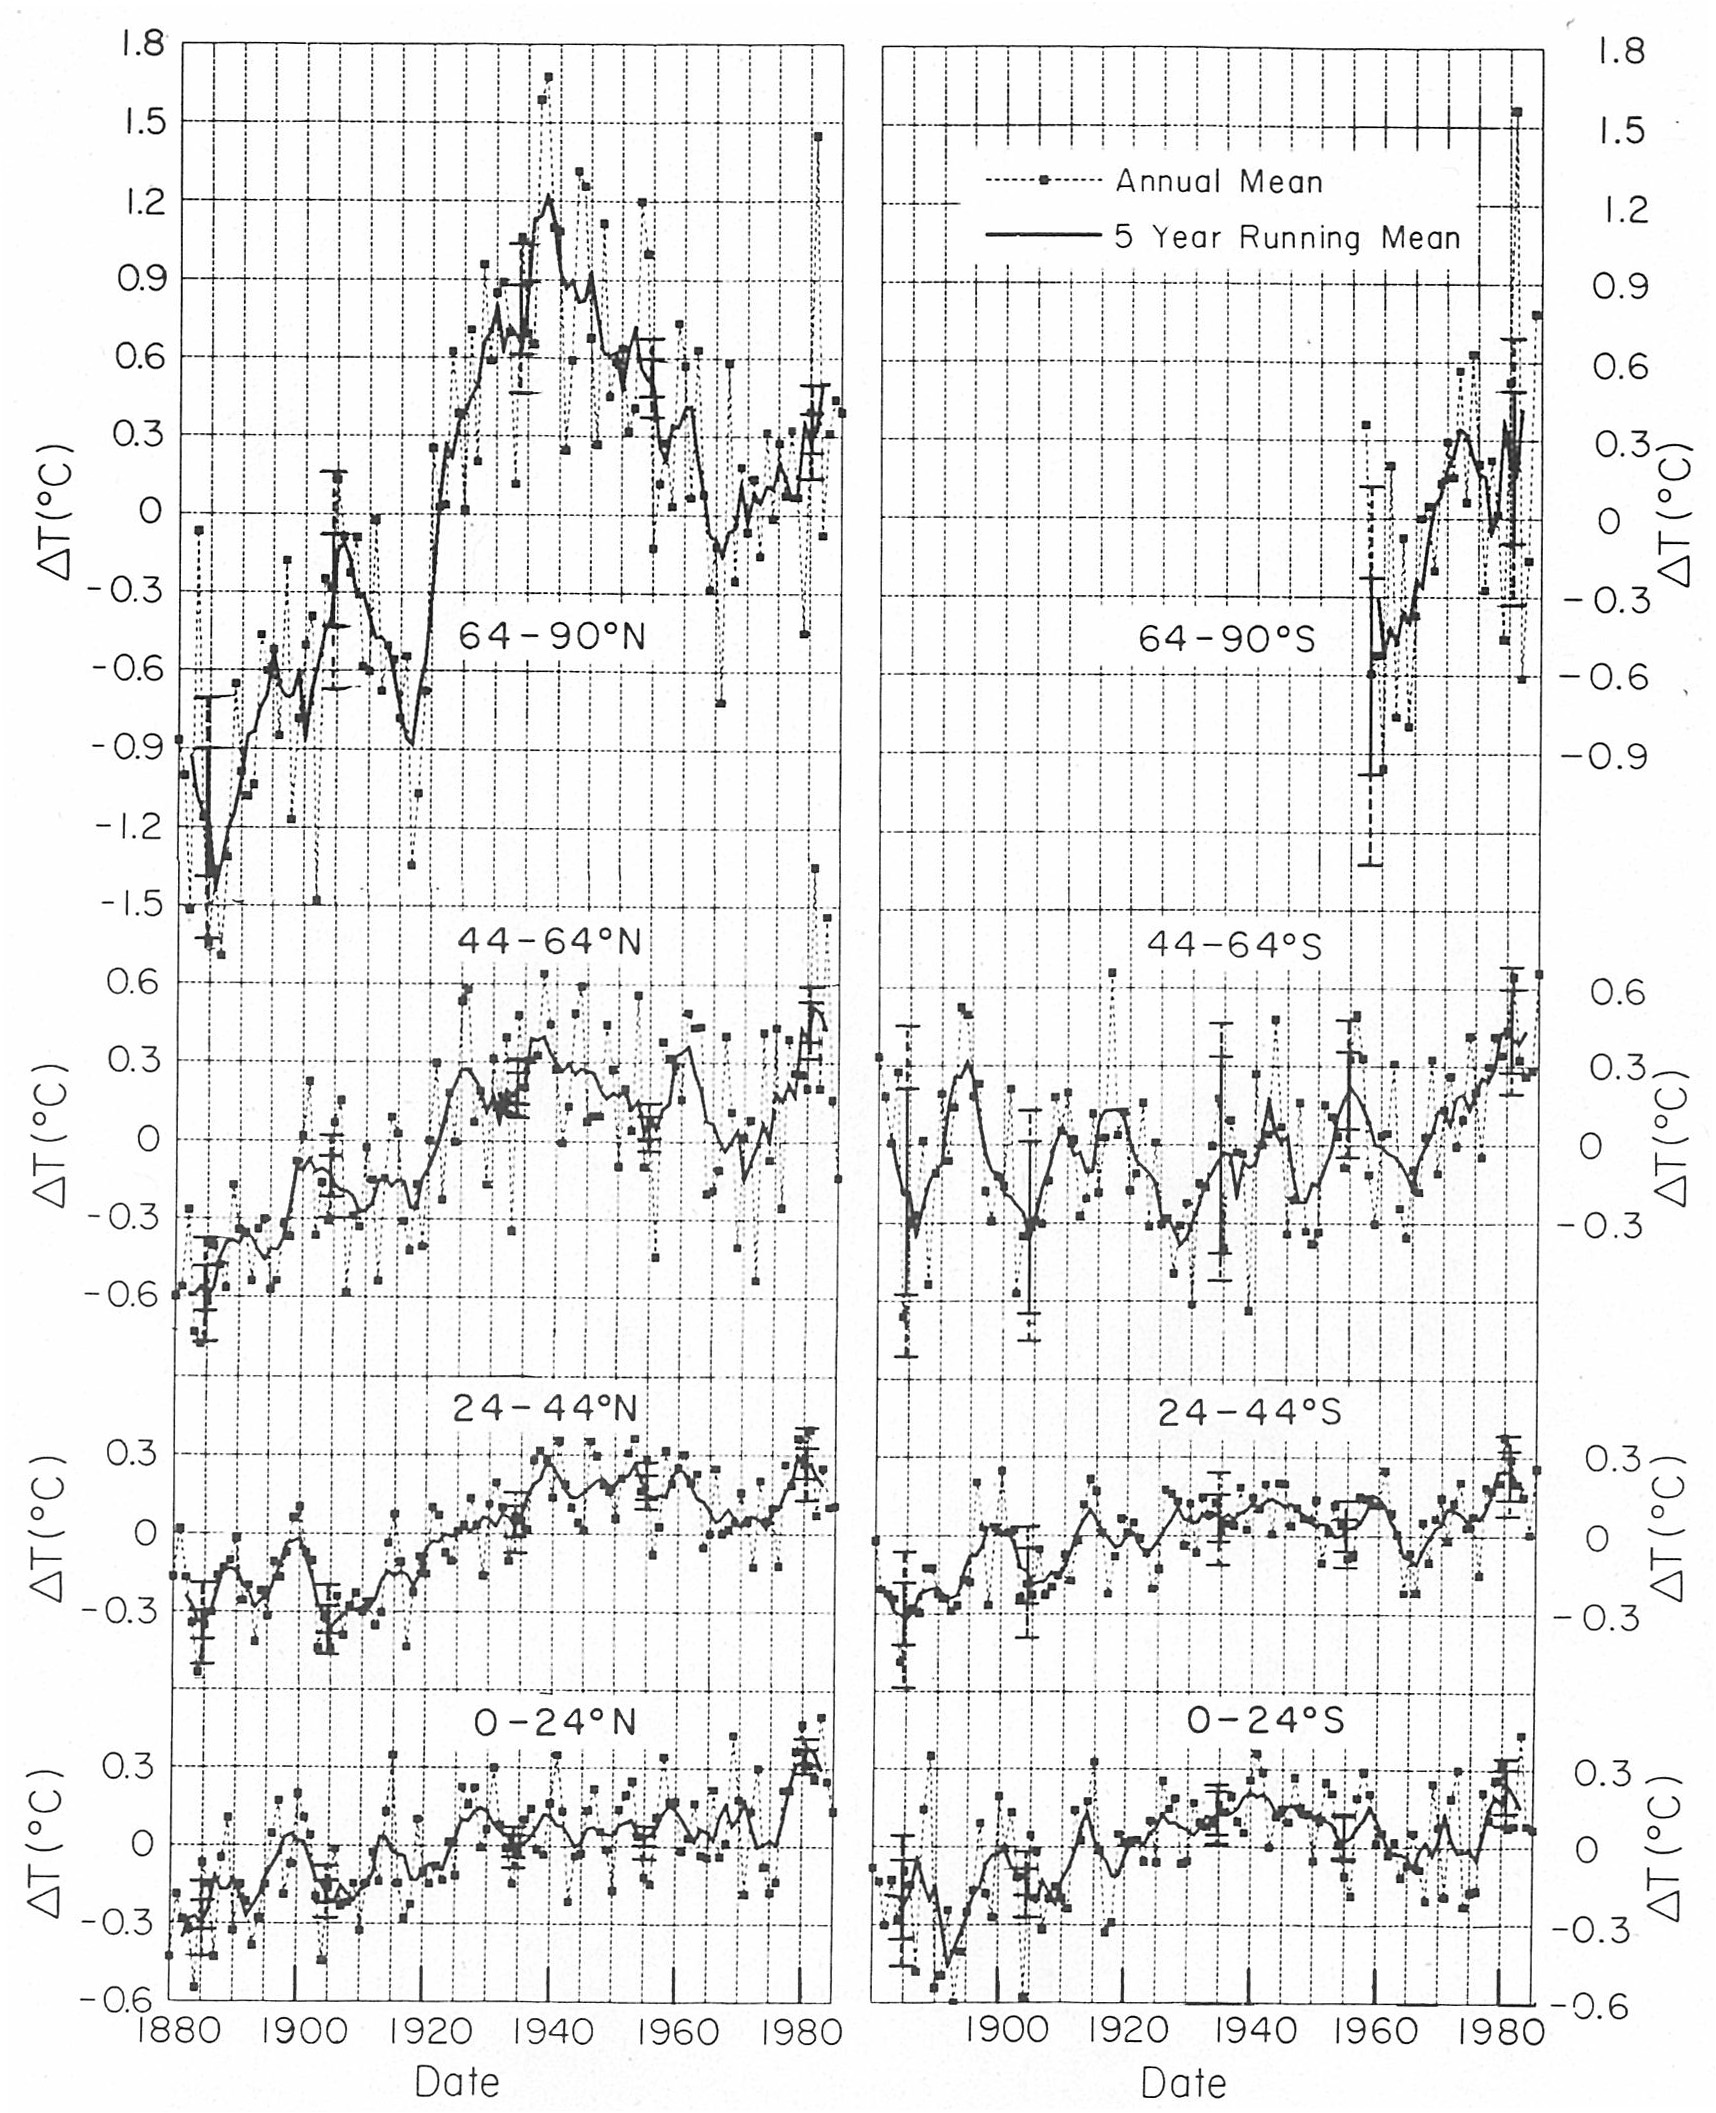
here )
The graphic below compares the most recent version of the
same graph (plotted from online data at GISS), marking two
bold points for 1937 and 1938 obtained from the printed
information in Hansen and Lebedeff 1987 (which prints out
the data now shown online). For both 1937 and 1938, the GISS
estimates have been reduced by approximately 0.4 deg C.
Despite recent warming, 2005 was the first year in which
64-90N values exceeded the former 1938 value – see dotted
line – (indeed, 2003 was the first year that exceeded the
“adjusted” 1938 value). While there are undoubtedly “good”
reasons for these adjustments (and I am not here arguing the
point one way or the other), the net effect of the
adjustments has been to consistently lower temperatures in
the 1930s relative to more recent values. Whether these
adjustments prove justified or not, modifications to the
temperature record of this magnitude surely warrant the most
careful scrutiny before turning the “lights out upstairs.”

64-90N from Hansen 64-90N zone downloaded today. Thick – 5
year running mean (often used by Hansen). Points are
selected values from Hansen and Lebedeff 1987. Dotted line
compares 1938 value from Hansen and Lebedeff 1987 to other
values.
I have a question about the NASA site. On the http://nasadaacs.eos.nasa.gov/articles/2006/2006_seaice.html page it shows a graph for summer melting here http://nasadaacs.eos.nasa.gov/articles/images/2006_seaice_graph.gif But that graph only shows the bottom half of the data. It you go to another site here http://nsidc.org/seaice/characteristics/difference.html the graph for Arctic Ice from the University of Colorado list data for both the melting and the maximum. They appear to show no significant change in their data. If you took the mean of that graph it would be close to zero. Can anyone explain this to me?
Good post and thanks for cross-posting it here.
Steve does a good job disecting Hansens’s letter, but you really have to read it to believe it.
Regarding Hansen’s statement, “My apologies if the quick response that I sent to Andy Revkin and several other journalists, including the suggestion that it was a tempest inside somebody’s teapot dome…” seems to be a pretty clear shot at President Bush as the “Teapot Dome” scandal was on the verge of bringing down President Harding who ultimately died in office in the 1920s. Hansen has publicly ripped the head of NASA and Bush in the past. Doesn’t seem like a guy with any concerns about job security.
If nothing else, this entire episode should make it more difficult for GISS, NCDC, IPCC and the rest to continue with the “trust us” routine. Regardless of which side of the issue you are on, that is good for science.
Fed agencies among serious stragglers in Y2K preparations
Some await the apocalypse; others think the problem will be merely annoying. In any case, the federal government’s own outlook inspires little confidence.
Joel Willemssen of the U.S. General Accounting Office doesn’t sugarcoat his answer. “All the government agencies will not be done on time. There will be some failures,” he says.
Jim Hansen has made Joel Willemsson into a modern day Nostradamus.
Just a quick FYI: I recently posted graphs of temperature level data for all stations in GHCNv2 on my site:
http://www.unur.com/climate/ghcn-v2/
Sinan
Sinan,
That is truly an impressive compilation of GHCN data on a station by station basis. I know it will be usefull in the work being done. Thank you for the hard work to make it available.
Anthony
Sinan, be sure to archive old versions of the data, in case of future retroactive adjustments.
Thanks Sinan.
Do you have a comments section? I have some notions for other kinds of checks that SteveMc prolly does not have time for, but which could yeild a nugget or two
Hello:
Thanks for the comments. My web site is basically read-only at this point.
If you would like to contact me, you can do it using the form at http://www.unur.com/sinan/contact.html
In any case, I am hoping that what I am doing can complement Steve and Anthony’s work in some way.
The graphs that are currently on my site are useful because they show, for each location, the maximal amount of data available. It is interesting to note that, while the U.S. is a small part of the global surface area, many of the longer, continuously updated temperature series come from the U.S.
I plan to go over my scripts and release them this week.
Sinan
Sinan that is awesome. I would have had no idea how spotty the world record is without looking at your graphs.
Another thing your presentation pointed out to me is the contrived nature of using temperature extremes to plot changes in the global temperature.
That was below my radar, and I thank you for pointing it out to me.
Perhaps surfacestations.org should have a link to the graph on Sinan’s site for each station?
I know it would be some extra work, especially retro-adding it to the site pages already online, but if it was included as each site was uploaded it would make things much easier.
The raw data must always be available. Correction factors are just guesses.
Sinan: The text on each station page for USA data says temp is measured in hundreths of a degree C. I think you must mean tenths of a degree in order for the scale to correspond to -40C to 40C
Molon Labe: Thank you for the correction. I will fix the template and regenerate the HTML pages.
There are a couple of other changes I want to make to the presentation and I will post a note here when the new version is up.
The whole shebang consists of 13,000 files and just generating and uploading them takes some time. I prefer generating the information offline and serving static content.
I have to admit. I still don’t fully understand these databases.
Why does the series for Copenhagen, DK end in 1991?
http://www.unur.com/climate/ghcn-v2/612/06186.html
Sinan
How can I find out where NOAA or other “official weather stations” are located in Central Florida? Anyone know?
Thanks.
Karen,
See http://www.surfacestations.org which is my nationwide project to locate and document such stations.
There is a master list link on the front page that has info on station locations. There is also a browsable online database of photos acquired already.