Please note that WUWT cannot vouch for the accuracy of the data within this page, as all of the data is linked from third party sources and WUWT is simply an aggregator.
Atmospheric Temperatures:
UAH Lower Atmosphere Temperature Anomalies – 1979 to Present

Surface Temperature, US. Climate Reference Network, 2005 to present:

UAH Lower Atmosphere Temperature Anomalies – 1979 to Present

RSS Temperature Lower Troposphere (TLT) – Brightness Temperature Anomaly – 1979 to Present

Note: Per John Christy, RSS and UAH anomalies are not comparable because they use different base periods, i.e., “RSS only uses 1979-1998 (20 years) while UAH uses the WMO standard of 1981-2010.”
RSS Temperature Middle Troposphere (TMT) – Brightness Temperature Anomaly – 1979 to Present

Temperature Troposphere / Stratosphere (TTS) – Brightness Temperature Anomaly – 1987 to Present

Temperature Lower Stratosphere (TLS) – Brightness Temperature Anomaly – 1979 to Present

Global Surface Temperatures:
Monthly Mean Surface Temperature Anomaly – 1996 to Present
Annual Global Mean Temperature Anomaly Over Land & Sea – 1880 to Present

Annual Global Average Land and Ocean Temperature Anomaly – 1850 to 2012

Monthly Global Average Land Temperature – 1850 to Present

HadCRUT4 Global, Northern and Southern Hemispheric Temperature Anomalies

Ocean Temperature:
Global Sea Surface Temperature Anomaly – NCDC

Global Sea Surface Temperature Anomaly – HadSST2 and HadSST3

Global Sea Surface Temperature Anomaly – Monthly

Global Sea Surface Temperature

Global Sea Surface Temperature Animation – 30 Days Including 7 Day Forecast

Global Sea Surface Temperature – 3 Months – NOAA:
http://www.cpc.ncep.noaa.gov/products/analysis_monitoring/enso_update/gsstanim.gif
Global Sea Surface Temperature – 12 Months – Naval Research Laboratory (NRL):
http://www7320.nrlssc.navy.mil/GLBhycom1-12/navo/globalsst_nowcast_anim365d.gif
Custom Sea Surface Temperature Mapping Tool – from 1981 – NOAA:
http://www.cpc.ncep.noaa.gov/products/GODAS/mnth_movie.shtml
Equatorial Pacific Sea Surface Temperature – 30 Days Including 7 Day Forecast

Equatorial Pacific Sea Surface Temperature – NOAA – 3 Months:
http://www.cpc.ncep.noaa.gov/products/analysis_monitoring/enso_update/sstanim.gif
Equatorial Pacific Sea Surface Temperature Anomalies – BoM – 3 Months:
http://www.bom.gov.au/climate/enso/surface_anim.gif
Equatorial Pacific Sea Surface Temperature – 1 Year Including 7 Day Forecast:
http://www7320.nrlssc.navy.mil/GLBhycom1-12/navo/equpacsst_nowcast_anim365d.gif
Ocean Subsurface Temperature:
BoM Global Subsurface Average Temperature and Anomalies at 150 Meters:

BoM Global Subsurface Average Temperature and Anomalies at 400 Meters:

BoM Monthly Subsurface Pacific Ocean Equatorial Temperature Anomalies down to 400 Meters:

BoM 5 Day Subsurface Pacific Ocean Equatorial Temperature Means and Anomalies down to 500 Meters:

Global Ocean Heat Content – 0-700 Meters – 1955 to Present

Accumulated Cyclone Energy
Global Tropical Cyclone Accumulated Cyclone Energy – 1970 to Present

Northern Hemisphere Temperatures:
Northern Hemisphere Temperature Lower Troposphere (TLT) 1979 to Present

Northern Hemisphere Surface Temperatures

Northern Hemisphere Sea Surface Temperature

RSS Northern Polar Temperature Lower Troposphere (TLT) – 1979 to Present

Mean Temperature above 80°N

Southern Hemisphere Temperatures:
Southern Hemisphere Temperature Lower Troposphere (TLT) 1979 to Present
 - 1979 to Present")
RSS Southern Polar Temperature Lower Troposphere (TLT) – 1979 to Present

Shortlink for this page, suitable for blog posts and Twitter feeds:
Source Guide:
Australian Bureau of Meteorology (BOM):
Home Page – http://www.bom.gov.au/
Climate Page – http://www.bom.gov.au/climate/
ENSO Page – http://www.bom.gov.au/climate/enso/
Center for Ocean-Atmospheric Prediction Studies (COAPS), Florida State University – Ryan N. Maue PhD – Environmental Prediction (NCEP) – Global Forecast System (GFS)
Home Page –http://www.coaps.fsu.edu/index.shtml
Products Page – http://www.coaps.fsu.edu/~maue/weather/
Data Page – http://www.coaps.fsu.edu/~maue/extreme/gfs/current/
Cryosphere Today – Arctic Climate Research at the University of Illinois:
Home Page – http://arctic.atmos.uiuc.edu/
Products Page – http://arctic.atmos.uiuc.edu/cryosphere/
Images Indexed By Date – http://arctic.atmos.uiuc.edu/cryosphere/IMAGES/
DrRoySpencer.com – Dr. Roy Spencer
Home Page – http://www.drroyspencer.com/
Current Temperature Page – http://www.drroyspencer.com/latest-global-temperatures/
Uploads Page – http://www.drroyspencer.com/wp-content/uploads/
Danish Meteorological Institute (DMI) – Centre for Ocean and Ice
http://ocean.dmi.dk/english/index.php
http://ocean.dmi.dk/arctic/index.uk.php
climate4you.com – Ole Humlum
Home Page –http://climate4you.com/
Ole Humlum Bibliography – http://climate4you.com/Text/BIBLIOGRAPHY%20OLE%20HUMLUM.pdf
Center for Ocean-Atmospheric Prediction Studies (COAPS), Florida State University – Ryan N. Maue PhD – Environmental Prediction (NCEP) – Global Forecast System (GFS)
Home Page –http://www.coaps.fsu.edu/index.shtml
Products Page – http://www.coaps.fsu.edu/~maue/weather/
Data Page – http://www.coaps.fsu.edu/~maue/extreme/gfs/current/
Met Office – Hadley Center
Home Page – http://www.metoffice.gov.uk/
Products Page – http://www.metoffice.gov.uk/hadobs/
Global Temperature Products Page – Products Page – http://www.metoffice.gov.uk/hadobs/hadcrut3/diagnostics/comparison.html
National Oceanic & Atmospheric Administration (NOAA) – Climate Prediction Center (CPC)
Home Page – http://www.cpc.ncep.noaa.gov/
Products Page – http://www.cpc.ncep.noaa.gov/products/
Monitoring and Data Products Page – http://www.cpc.ncep.noaa.gov/products/MD_index.shtml
Atmospheric & SST Indices Page – http://www.cpc.ncep.noaa.gov/data/indices/
Regional Climate Maps – http://www.cpc.ncep.noaa.gov/products/analysis_monitoring/regional_monitoring/
Monitoring and Data Page – http://www.cpc.ncep.noaa.gov/products/monitoring_and_data/
FTP Page – ftp://ftp.cpc.ncep.noaa.gov/
National Oceanic & Atmospheric Administration – (NOAA) – Environmental Modeling Center (EMC)
Home Pagehttp://www.emc.ncep.noaa.gov/
National Oceanic and Atmospheric Administration (NOAA) – Earth System Research Laboratory (ESRL)
Home Page – http://www.esrl.noaa.gov/
Physical Sciences Division (PSD) Products Page – http://www.esrl.noaa.gov/psd/products/
Physical Sciences Division (PSD) Data Data Page – http://www.esrl.noaa.gov/psd/data/
Physical Sciences Division (PSD) Data Maps Page – http://www.esrl.noaa.gov/psd/map/
National Aeronautics and Space Administration (NASA) Goddard Institute for Space Studies (GISS)
Home Page – http://data.giss.nasa.gov/gistemp/
Products – http://data.giss.nasa.gov/
National Oceanic and Atmospheric Administration (NOAA) – National Operational Hydrologic Remote Sensing Center (NOHRSC)
Home Page – http://www.nohrsc.noaa.gov/
Snow Analysis Page –http://www.nohrsc.noaa.gov/nsa/
Forecasts – http://www.nohrsc.noaa.gov/forecasts/
National Oceanic and Atmospheric Administration (NOAA) – National Ice Center (NATICE):
Home Page – http://www.natice.noaa.gov/mission.html?bandwidth=high
Products Page – http://www.natice.noaa.gov/products/products_on_demand.html?bandwidth=high
National Oceanic and Atmospheric Administration (NOAA) – National Climatic Data Center (NCDC)
Home Page – http://www.ncdc.noaa.gov/oa/about/about.html?bandwidth=high
Products Page – http://www.ncdc.noaa.govgov/oa/ncdc.html?bandwidth=high
FTP Page – http://www1.ncdc.noaa.gov/pub/data/cmb/?bandwidth=high
National Oceanic & Atmospheric Administration – (NOAA) – National Oceanographic Data Center (NODC)
Home Pagehttp://www.nodc.noaa.gov/
Products Page – http://www.nodc.noaa.gov/General/NODC-About/NODC-Major-Products.html
Data Page – http://www.nodc.noaa.gov/General/getdata.html
Heat Content Page – http://www.nodc.noaa.gov/OC5/3M_HEAT_CONTENT/
Naval Research Laboratory (NRL) Monterey Marine Meteorology Division
Home Page – http://www.nrlmry.navy.mil/
Products Page – http://www.nrlmry.navy.mil/proddemo.htm
Satellite Products Page- http://www.nrlmry.navy.mil/sat_products.html
NOGAPS Forcast Products Page – http://www.nrlmry.navy.mil/metoc/nogaps/NOGAPS_global_net.html
Data Page – http://www.nrlmry.navy.mil/archdat/
Multi-view – http://www.nrlmry.navy.mil/sat-bin/global.cgi
Navel Coasal Ocean Model – http://www7320.nrlssc.navy.mil/global_ncom/
FTP Page – http://www7320.nrlssc.navy.mil/global_ncom/Links/
FTP Page Global – http://www7320.nrlssc.navy.mil/global_ncom/Links/glb/
Remote Sensing Systems (RSS)
Home Page – http://ssmi.com/?bandwidth=high
MSU Page – http://ssmi.com/msu/msu_browse.html?bandwidth=high
MSU FTP Page – ftp://ftp.ssmi.com/msu/?bandwidth=high
FTP Page – ftp://ftp.ssmi.com/?bandwidth=high
Rutgers University – Global Snow Lab (GSL)
Home Page – http://climate.rutgers.edu/snowcover/index.php?bandwidth=high
Products Page – http://climate.rutgers.edu/snowcover/chart_seasonal.php?ui_set=eurasia&ui_season=1?bandwidth=high
University of Colorado at Boulder
Home Page – http://sealevel.colorado.edu/
Sea Level Calibration Page: http://sealevel.colorado.edu/content/calibration
Sea Level Release Notes Page: http://sealevel.colorado.edu/content/release-notes
Temperature Results Page – http://sealevel.colorado.edu/results.php
FTP Page – http://sealevel.colorado.edu/current/
University of East Anglia (UEA) – Climatic Research Unit (CRU)
Home Page – http://www.cru.uea.ac.uk/
Data Page – http://www.cru.uea.ac.uk/data
Additional Resources:
University of Alabama at Huntsville – Distributed Information Services for Climate and Ocean Products and Visualizations for Earth Research (DISCOVER) Project:
Home Page – http://discover.itsc.uah.edu/
Temperature Page – http://discover.itsc.uah.edu/amsutemps/amsutemps.html
Global Temp Page – http://discover.itsc.uah.edu/amsutemps/
Sea Surface Temperature Page – http://discover.itsc.uah.edu/amsutemps/execute.csh?amsutemps+001
Temperature 14,000 feet Page: – http://discover.itsc.uah.edu/amsutemps/execute.csh?amsutemps+002
Temperature 25,000 feet Page – http://discover.itsc.uah.edu/amsutemps/execute.csh?amsutemps+003
Temperature 36,000 feet Page: – http://discover.itsc.uah.edu/amsutemps/execute.csh?amsutemps+004
Temperature 46,000 feet Page – http://discover.itsc.uah.edu/amsutemps/execute.csh?amsutemps+005
Temperature 56,000 feet Page: – http://discover.itsc.uah.edu/amsutemps/execute.csh?amsutemps+006
Temperature 68,000 feet Page – http://discover.itsc.uah.edu/amsutemps/execute.csh?amsutemps+007
Temperature 82,000 feet Page: – http://discover.itsc.uah.edu/amsutemps/execute.csh?amsutemps+008
Temperature 102,000 feet Page – http://discover.itsc.uah.edu/amsutemps/execute.csh?amsutemps+009
Temperature 118,000 feet Page: – http://discover.itsc.uah.edu/amsutemps/execute.csh?amsutemps+010
Temperature 135,000 feet Page – http://discover.itsc.uah.edu/amsutemps/execute.csh?amsutemps+011
I suggest WUWT for kids needs to keep the data intact but have step by step explanations on how to read it …and what are the possible interpretations …..leaving the choice of interpretation to the reader …..this would be useful for non-experts such as myself too ….
Oh drool
Note the plots on this page (from Climategate type sources) would imply the global cooling scare of the 1960s-1970s happened for negligible reason.
Climate scientists of the time (a majority being honest academics before the later influx of enviropolitical alignments, money, and new activist individuals) are implicitly implied to be utter fools who couldn’t notice that temperatures (global, Northern Hemisphere, etc) were near-constantly rising overall with little downturn.
Except that is not how reality works. Events don’t happen ex nihilo. One of the best applications of intelligence is to cross-connect info, to see how data of many types can form a consistent and plausible whole, rather than having unexamined glaring implausibilities left.
And doing so leads to the beautiful actual history of temperatures and the climate seen in publications of the time (like plots in a 1976 National Geographic issue I’ve even seen in paper form in a library, not the highly publicized rewritten versions of later activists), which can be combined with later data from non-activist real scientist sources to explain all from the LIA to the current “pause” in global warming:
http://img250.imagevenue.com/img.php?image=45311_expanded_overview2_122_15lo.jpg
As a follower of this site and especially climate discussion in general from the 80’s, I’ll share my personal take on this issue:
10 years is imho a rough minimum span to consider when quantifying the planets temperatures or climate state. With that in mind it looks like we have hit a (slowly rising) plateau of sorts which migh last for decades more assuming there is a ~30y oscillating trend of any magnitude. From al the above graphs it can be deducted that the climate has warmed somewhat, for whatever reason. The assumption that the lower side of the 30 year oscillation actually just makes the temps stay on somewhat the same level and the positive side of the trend is fairly fast warming fits the graphs well, we will see in a few decades whather that is to continue or not.
The activity sugre of the sun in the last century is a good candidate for a very long trend, (spanning over the 30y trend) especially considering the vast mass of the planet – delays expected. CO2 is not a very likely prime forcer of the temperature but very likely does contribute to some level. In any case a warmer climate (or about status quo) is a necessity as any dip into a little ice age would cause very severe issues which I would like to see mentioned in the MSM even once.
Also noteworthy to mention is that the CO2 demonizing in MSM is a dierct result of 3 main motives:
1. Tax income needs to grow for a plethora of reasons. Big government and welfare state etc.
2. Lower the dependence to outside energy suppliers (trade deficit, unpredictability of the middle east).
3. The need to spur the research and with that the competitiveness of a nation / western civ.. linked to reason no 2 but also a standalone interest.
More scare, more money.
It is a nice plan also because people will pay taxes more and more willingly if they are both scared and secondly think it results in greated good. Very well thought out and largely a lie, Some of the money goes to actual good use of course so there is a thin silver lining.
MM says….3 main motives for CO2 demonisation. I would add No 4 ….UN Agenda 21 which should really be No 1. It all comes from there.
Yeah, right. 97% of climate scientists are willing to fake the data for some reason.
What is the agenda for the multiple 1% types with billions in foundation money who are behind the creation of agenda 21?
What are their motivations? Is it world wide governance through an un-elected UN? World wide free trade control for maximum profit? De militarization for less warfare? Reduced nationalism to allow mass migration of peoples? Uniform law of the sea? Preservation of wild spaces worldwide? There are a number of fine goals to rally behind.
I think the election of Trump has thrown a spanner in the grand plan. Between the 1% types owing the media and their buying of politicians, I doubt that Trump can succeed. The USA Constitution he supports is in reality an obstacle, a relic, a throwback to the idea of sovereign states.. and it would have been circumvented successfully if Hillary had won.
Simplified climate data reference pages would be most welcome in newsrooms as well. Just like schoolkids, most journalists don’t know that it is possible and even to access temperature and other climate data. “WUWT for kids ‘n hacks”, yes please!
…even easy…
Henry Clark says:
December 21, 2013 at 4:30 pm…
Henry, that is an excellent link. Thanks for posting it.
That link doesn’t work. Is there a newer one?
I’m confused, since about 2003 the global ocean temperatures have been pretty flat, maybe even a little negative. How is it then that the global ocean heat content graph is climbing so steep ? It seems counter intuitive.
Why are we given global temperature graphs using anamolies instead of average temperatures as compiled from measuring station reported readings? Doesn’t the use of varying bases upon which to compute anamolies skew the results and prevent accurate comparison with earlier periods?
Website work needed: UAH Lower Atmosphere Temperature Anomalies show only through June, but the link has data through August.
Updated through September, thank you.
Some of the links on this page are not working.
[Thank you for noting the issue: which ones did you have a problem with? .mod]
Perhaps a graph that shows the past GISS LOTI compared with the current GISS LOTI would be helpful?
Nothing fancy. No animation. Just what they said before compared with what they say now for the same data?
Something to make it easy to see that the “settled” science can’t even settle on what happened in the past.
That could help newcomers.
Might want to consider adding Berkely Earth take on the data. http://berkeleyearth.org/data/
Pause? What pause? I don’t see no stinking hiatus:
http://www.ncdc.noaa.gov/temp-and-precip/msu/
Why aren’t the graphs and data up to date. For example, the first temperature graph shows data only through January 2015?
I’ve been busy, graphs updated.
Thanks!
Trump is correct alarmists being fueled by money and political influence from people like gore and dupont their freon patent expired thus the refrigerant scare
The CO2 myth.
If you placed a coin on the footpath, to represent a CO2 molecule in the atmosphere. you would then need to place 2500 more non CO2 coins the same size, before you would need another CO2 molecule coin.
and then another 2500 non CO2 coins, etc. and that is supposed to significantly affect global temperatures?
The 2011 NCDC graphic at http://www.ncdc.noaa.gov/sotc/service/global/global-land-ocean-mntp-anom/201101-201112.png is outdated.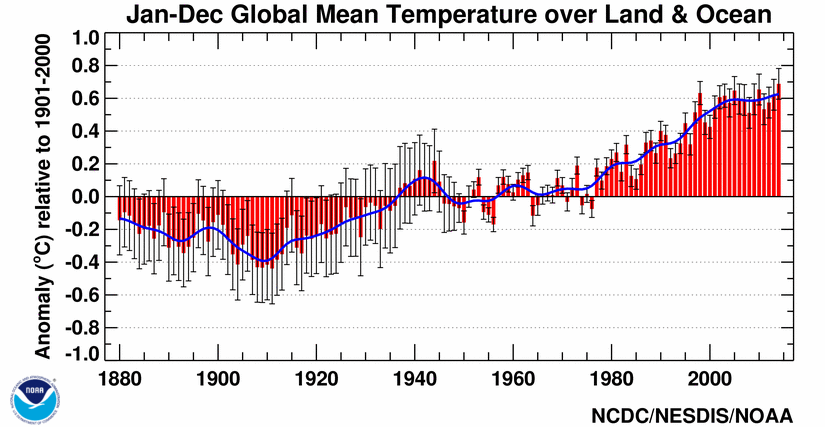
The latest (2014) is at
Thanks for all the good work!
Updated, thank you!
I think water vapor makes the story even more interesting.
http://i68.tinypic.com/35d5jsg.png
RSS Northern Polar Temperature Lower Troposphere (TLT) – 1979 to Present should be “Southern Polar” as in the graph, right?
just wow. good old ‘wish You where here.’
and we’re here in the 21st ctry.
Do the NY folk still the easter parade, ever saw that in black/White. sentimental stuff holds the feet on the ground.
Thanks to A . Watts, staff and Best 2016.
How about a question? In the 1900’s, how many mercury thermometers were there actually available to track “global” temps? I can’t imagine how many far more accurate digital thermometers and satelite temp readings are available today than 100 years ago. Would most not agree that reading a glass, mercury filled thermometer from early 1900s as compared to a modern, NSIT traceable digital thermomoter, leave at least a reasonable amount of inaccuracy and variability? I don’t think that a .15 to .2 temperature discrepency or even expected margin of error would be overstated. Aside from the instrument question, weren’t temperatrue readings from even 50 years ago mainly ” at the airport” readings not center city Chicago or L.A.?
Many weather stations have been relocated as well. A relatively minor move can be enough to substantially change the readings. From coastal to a couple of miles inland for instance or a change of altitude of a couple of hundred feet. Has anyone looked into any adjustment of weather station readings to acknowledge these alterations?