By Andy May
As seen in the first post of this series the AMO (Atlantic Multidecadal Oscillation) and the WHWP (Western Hemisphere Warm Pool) area are the two climate oscillations that explain most of the variability (64%) in the HadCRUT5 global mean surface temperature reconstruction (GMST) since 1950. Adding the Southern Annular Mode (SAM) explains 77% of HadCRUT5 variability.
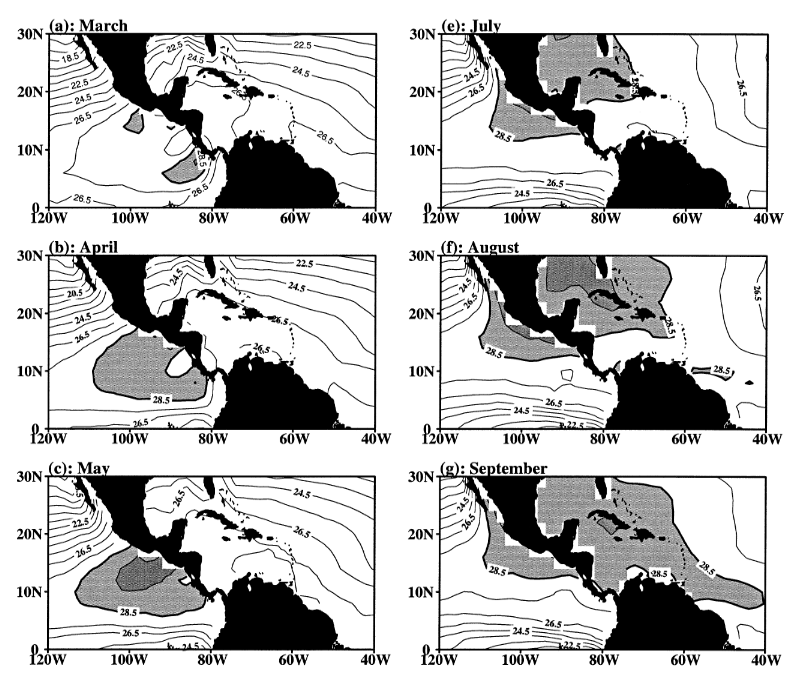
The Western Hemisphere warm pool or the WHWP is an anomaly based on the area of the ocean warmer than 28.5°C (that is within the 28.5°C isotherm) and approximately within the rectangular region from 7°N – 27°N and 110°W to 50°W. This area extends from the eastern North Pacific (west of Mexico, Central America, and Columbia) to the Gulf of America, the Caribbean, and well into the Atlantic during the WHWP peak in August and September (Wang & Enfield, 2001) and (Wang & Enfield, 2003). It is significant because deep convection starts at about 28°C (Sud, Walker, & Lau, 1999).
The WHWP nearly disappears in the Northern Hemisphere winter and begins in the eastern Pacific off the coast of Mexico and Central America each spring (think the current Hurricane Erick). It spreads northeastward across Mexico via an atmospheric bridge into the Caribbean and the Gulf of America in June and July. It typically reaches its maximum size in September (see figure 1). Unlike the western Indo-Pacific warm pool which straddles the equator, the WHWP is entirely north of the equator (Wang & Enfield, 2003). Figure 1 shows some key maps of the 1950-2000 average 28.5°C SST isotherm from Wang and Enfield’s 2003 paper.
All indices of Atlantic tropical cyclone activity include a multidecadal variation that is consistent with multidecadal variations of the AMO (Goldenberg, Landsea, Mestas-Nuñez, & Gray, 2001) and the Atlantic portion of the WHWP, sometimes called the AWP or the Atlantic Warm Pool (Wang, Lee, & Enfield, 2008). When the Atlantic portion of the WHWP is large it reduces vertical wind shear and increases the instability of the troposphere, both of which increase hurricane activity (Wang, Lee, & Enfield, 2008). The WHWP has strong ties to the AMO and a statistical connection to ENSO (Wang, Lee, & Enfield, 2008) and (Enfield & Mayer, 1997).
Due to the equatorial Atlantic easterly winds and ocean currents, water warmed by the Sun in the Northern Hemispheric summer collects in the Gulf of America and Caribbean forming the core of the AWP. While the Gulf Stream carries away a lot of this heat, it cannot keep up in the summer and the water warms until deep convection starts. The deep convection forms high level clouds that keep longwave radiation from escaping and act as a positive feedback. The increase in SST and evaporation act to lower sea level air pressure further increasing cloudiness and forming organized storms (Wang & Enfield, 2003). Atlantic and Caribbean hurricanes form within the WHWP and act as giant air conditioners that suck heat from the sea surface and take it almost as high as the stratosphere in some strong storms, they also transport heat as far as the North Atlantic and Canada. These processes accelerate the transport of the excess energy to outer space.
Hurricanes often rapidly intensify both south and north of Cuba in August and September. The WHWP very quickly dissipates after October. The heat fluxes in the WHWP are illustrated in figure 2, which is from Wang & Enfield (2003).
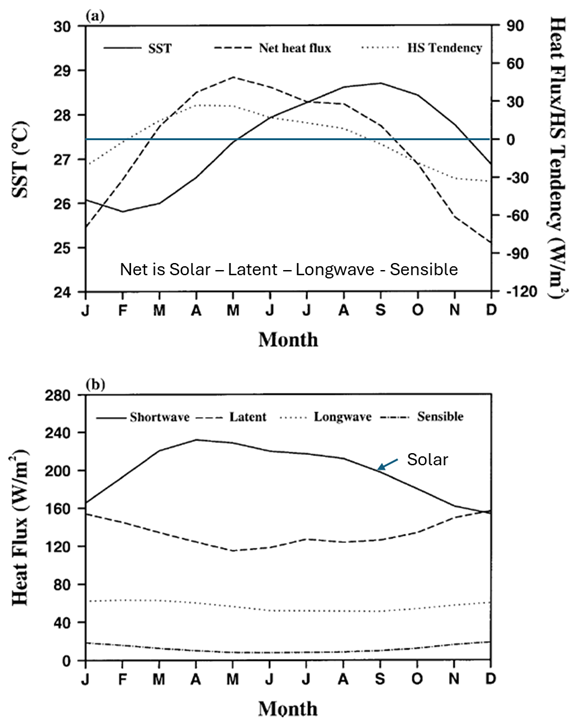
In figure 2a SST, net heat flux, and ocean heat storage are plotted by average 1950-2000 monthly values. The horizontal blue line is at zero ocean heat storage to divide ocean cooling from ocean warming, the boundaries are in February and August. SST changes follow heat flux changes by three to four months. The individual heat fluxes are plotted in figure 2b, the net flux in (a) is the shortwave (solar) flux minus the net longwave, net latent (evaporation), and net sensible fluxes which are all negative (Wang & Enfield, 2003).
The longwave radiation is computed using the graybody flux from the ocean surface and factoring in the back radiation from clouds. The latent flux takes into account evaporation, which is a function of SST and average windspeed. Sensible heat flux is mostly a function of wind speed. The average depth of the mixed layer, and thus the SSTs shown in figure 1, is about 25 meters.
The WHWP is closely correlated to both the Niño-3 anomaly and the tropical North Atlantic anomaly, R2 = 0.68 and 0.63 respectively (Wang & Enfield, 2003). Unsurprisingly, the eastern North Pacific portion of the WHWP is very closely correlated with Niño-3 with a zero time-lag. Niño-3 and the overall WHWP have a three-month lag. Figure 3 displays the full year WHWP and its 5-year running mean.

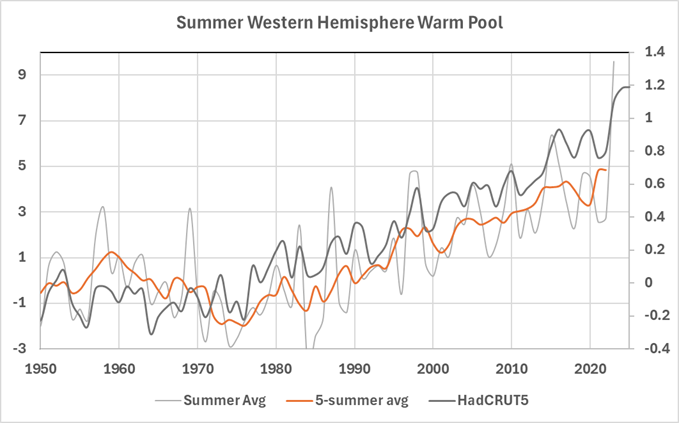
As we saw in post one, the WHWP is closely related to the global mean surface temperature (GMST) something also pointed out in Wang and Enfield, 2003. The annual development and destruction of the WHWP correlates closely with seasonal precipitation, temperature, and storminess over North and Central America. The WHWP nearly disappears every winter, so the key months for the WHWP are from May through October. Figure 4 plots the average just for these critical months, I added the HadCRUT5 GMST for comparison. The close relationship between HadCRUT5 and WHWP is easily seen.
Although the WHWP is not discussed as much as the AMO, PDO, ENSO, and other oscillations it is a good predictor of the HadCRUT5 global mean surface temperature. In combination with the Antarctic Oscillation or Southern Annular Mode and the AMO it does a very good job. This suggests that The North Atlantic and the Southern Hemisphere circulation patterns correlate very well with global climate trends, CO2 may fit in there somewhere, but it must share the spotlight with these natural oscillations.
Works Cited
Enfield, D. B., & Mayer, D. A. (1997). Tropical Atlantic sea surface temperature variability and its relation to El Niño-Southern Oscillation. Journal of Geophysical Research: Oceans, 102(C1). doi:10.1029/96JC03296
Goldenberg, S. B., Landsea, C. W., Mestas-Nuñez, A. M., & Gray, W. M. (2001). The Recent Increase in Atlantic Hurricane Activity: Causes and Implications. Science, 293(5529), 474-479. doi:10.1126/science.1060040
Sud, Y. C., Walker, G. K., & Lau, K. M. (1999). Mechanisms Regulating Sea-Surface Temperatures and Deep Convection in the Tropics. Geophysical Research Letters, 26(8), 1019-1022. doi:10.1029/1999GL900197
Wang, C., & Enfield, D. B. (2001). The Tropical Western Hemisphere Warm Pool. Geophysical Research Letters, 28(8). doi:10.1029/2000GL011763
Wang, C., & Enfield, D. B. (2003). A Further Study of the Tropical Western Hemisphere Warm Pool. Journal of Climate, 16(10), 1476-1493. doi:10.1175/1520-0442(2003)016<1476:AFSOTT>2.0.CO;2
Wang, C., Lee, S.-K., & Enfield, D. B. (2008). Atlantic Warm Pool acting as a link between Atlantic Multidecadal Oscillation and Atlantic tropical cyclone activity. Geochemistry, Geophysics, Geosystems, 9(5). doi:10.1029/2007GC001809
CO2 blankets the globe with 415 ppm. The backradiation from 415 ppm is a constant and not impacted by location. There is absolutely no way for CO2 to cause a temperature differential between locations because they are all exposed to the identical backradiation. The problem climate alarmists have is that locations have differing trends in temperature, The N Hemi is different from the equator, poles, and S Hemisphere, the land has a different trend than the sea. There are countless locations with no warming at all. The very fact that there are differing trends in temperatures proves CO2 isn’t the cause. Constants can’t cause differentials, that is basic statistics 101 and basic modeling 101. Climate Alarmists don’t get to make up math to defend their nonsense.
https://app.screencast.com/YhtT15qlGLIsC
https://app.screencast.com/DFd1viHxsRjq7
At the MLO in Hawaii, the concentration of CO2 in dry air is currently 430 ppmv which is valid only at this location. One cubic meter of this air has mass of 1.29 kg/cu. m. and contains a mere 0.845 g of CO2 at STP. Since this trace amount of CO2 can absorbed only a small amount of out-going long wave IR radiation, it can heat up such a large mass of air by a very small amount if at all.
Show me any measurements that show CO2 not blanketing the globe in 430 ppm.
There must be some variation even if only a few ppm.
The data you’re after is at https://scrippsco2.ucsd.edu/data/atmospheric_co2/
There’s a small seasonal variations — about 7 ppm — due to Spring and Summer uptake of CO2 by the extensive forests and grasslands in the Northern Hemispere.
Urban areas tend to be 10 ppm higher and rural areas 10 ppm lower.
Proof?
That is 100% certain, but what is relevant is are the slight differences are material. the W/M^2 of back radiation between 430 and 400 is negligible. CO2 shows a log decay in W/M^2. slight differences are immaterial. Also, if you do make that claim, you are going to have huge temperature differentials to explain with a immaterial change in backradiation.
If dry air containing CO2 at 430 ppmv at STP is heated to 20° C, the density is 1.20 kg/cu. m. and the concentration of CO2 is still 430 ppmv. To the first approximation, the mass of CO2 in 1 cu. m. this warm air is given by:
mass CO2 in 1 cu. m. = 0.845 g x 1.20 kg/cu. m./1.29/cu. m. = 0.786 g
This calculation is for dry air at 1 atm. If RH is 100%, the mass of CO2 is reduced by ca. 2.5%.
NOAA’s GML webpage, going directly to the “Recent trend” tab.
URL : https://gml.noaa.gov/ccgg/trends/gl_trend.html
The graph on that page (copied below) shows daily data for the last 9.5 years from four different “atmospheric CO2 abundances” measurement sites.
There are clearly differences in the amplitudes of the “seasonal cycle” at each location, not to mention the daily disparities.
CO2 is a “well mixed” GHG, not a completely uniform “blanket” wrapped around the surface of the Earth with an infinitely fast — or even “very large” — diffusion rate.
Pretty sure we were talking about a cross section, not time series. During the summer in the N Hemi the trees breath in CO2, and in the winter they exhale. Once again, we’re looking for materiality of a differential to explain the temperature differentials with constant CO2. I’m beginning to get the feeling you have never taken modeling 101, statistics 101, science 101 or math 101. Context is needed.
Your OP : “The backradiation from 415 ppm | or 430 ppm, or any concentration at a given ‘time T’ … ] is a constant and not impacted by location. There is absolutely no way for CO2 to cause a temperature differential between locations because they are all exposed to the identical backradiation.”
Harold Pierce : “At the MLO in Hawaii, the concentration of CO2 in dry air is currently 430 ppmv which is valid only at this location.”
Your reaction to that specific point : “Show me any measurements that show CO2 not blanketing the globe in 430 ppm.”
Joseph Zorzin : “There must be some variation even if only a few ppm.”
Me (to your “challenge”, paraphrased) : “Here you go …”
.
No, “we” weren’t.
“We” were surprised at your bald assertion that all four datasets on my graph should be perfectly overlapping, and they should all finish at the identical endpoint of [ 19th June 2025, 430 ppm ].
NASA has that data.
You seem to think that a molecule of CO2 is capable of absorbing one photon, then that’s it.
The reality is that CO2 absorbs one photon, passes that energy to other molecules through collisions, absorbs another photon, passes the energy on, absorbs another photon, …
Each molecule of CO2 does this, over and over and over again, tens of thousands of times a second, as long as it exists.
Not “collisions”. That’s just an archaic term for an electron emitting a photon, and an electron absorbing a photon.
Thats all there is to it.
As Feynman points out, all physical processes (excluding gravitation and nuclear) can be explained by –
Quantum electrodynamic theory is the most rigorously tested theory in history. So far, every prediction has been correct.
You don’t have to accept it if you don’t want to. Einstein tried to disprove basic quantum mechanics and failed.
Michael,
That is not true.
From: https://andymaypetrophysicist.com/2025/02/01/energy-and-matter/
Not “collisions”. That’s just an archaic term for an electron emitting a photon, and an electron absorbing a photon.
Thats all there is to it.
As Feynman points out, all physical processes (excluding gravitation and nuclear) can be explained by –
Quantum electrodynamic theory is the most rigorously tested theory in history. So far, every prediction has been correct.
You don’t have to accept it if you don’t want to. Einstein tried to disprove basic quantum mechanics and failed.
No GHE. I would be surprised if you could even produce a consistent and unambiguous description for this bizarre quasi-religious concept.
In today’s physics, I think we can safely say “photons” do not fly from place to place. They only exist when radiation, of the proper frequency, is absorbed by an atom or molecule.
Radiation, in space, is best described by Maxwell’s equations which are still in use. Now once radiation is absorbed by a molecule or atom it can be described as a photon. But not in space. Why do you think “steradians” are used to describe outgoing radiation? Photons are particles, you can’t describe the path of a particle with a steradian.
You are way off base here
At what level does absorption stop?
Wrong. Valence electrons do not alter the kinetic energy of the molecule.
The valence electrons emit a quantum of energy, commonly called a photon, when changing from a higher valence state to a lower state.
EM radiation does not “thermalize” molecules. Thermalize as it is used is a hijacked and repurposed word. Thermalize is defined as approaching or achieving thermal equilibrium.
When CO2 absorbs an IR photon in the 15μm range it is excited from the vibrational ground state of the bending mode to the first excited state. In that state the molecule rapidly bends back and forth thereby increasing the vibrational kinetic energy of the molecule. If the vibrating molecule collides with neighboring molecules that kinetic energy can be transferred as the vibrational state returns to its ground state thereby increasing the translational kinetic energy of the gas (temperature).
Yep, you are 100% correct. 1 out of every 2,500 molecules absorbs the energy of dry ice. Vibrating at the energy of -80 C, that 1 molecule may impact the energy of another molecule with the energy of dry ice. Result? At best the temperature would
be -80C is every other molecule shared that energy.
This video details the issue:
https://app.screencast.com/OWq7twX7ELhEa
Simply look at the temperature in the stratosphere. It bottoms near -60 C, that is the CO2 signature. CO2 doesn’t warm anything, it prevents the atmosphere from dropping below -80C. Quantum Mechanics defines the outcome.
The MLO observatory WAS located atop one of the most active volcanos on the planet. The laboratory was moved a couple years ago, some 200 miles away, due to impending eruptions.
Harold The Organic Chemist Says:
You should mention that the source of the temperature charts is the late John Daly’s website:
“Still Waiting For Greenhouse” available at: http://www.john-daly.com. To access the temperature charts from the over 200 weather stations located around the world, you should click on
“Station Temperature Data”. On the “World Map”, click on a region or country to access temperature data from the weather stations located there.
You should mention that these charts falsify the claims by the IPCC that the greenhouse gas CO2 causes “global warming” and is “the control knob for climate change”.
If everyone learned of the late John Daly’s website, all this global warming and climate change nonsense would vanish overnight.
If Climate Science was a real science they wouldn’t be asking does CO2 cause warming and trying to prove it, they would be asking why so many locations don’t show any warming with an increase in CO2. In science you don’t prove something, you disprove things. That is why you reject the Null, you never accept it.
Hypothesis:
CO2 doesn’t cause warming
Evidence:
https://app.screencast.com/YhtT15qlGLIsC
Null not rejected. Science 101.
The entire contiguous US shows no warming trend going back to 1895. Explain that.
https://www.ncei.noaa.gov/access/monitoring/national-temperature-index/time-series/anom-tavg/1/0
That graph shows a warming trend.
You can no longer trust temperature data from any country because since ca. 2000 the data have been adjusted and homogenize to show recent warming. Early years have been adjusted to lower temperatures. Raw temperature data can be obtained but it is hard to find.
I remember that argument being popular around 15 years ago, but it’s now outdated.
The Berkeley project conducted an independent analysis and confirmed the accuracy of the official temperature records.
Similarly, the USCRN, represented by the red line in CO2isLife temperature graph, is an independent dataset that aligns closely with the adjusted historical records.
Some people claim that the data has been manipulated to match USCRN, but those claims rely on misrepresenting studies or on wishful thinking and denial.
“…with adjusted historical records.” What are these “adjustments”?
You got a link to the Berkeley project?
Go to ACORN.SAT to learn how the BoM “adjusts” Australian temperature records.
Janet, adding CO2 to air does not raise surface temperatures.
If you disagree, please show the experimental support for your disagreement. Oh, make sure no sunlight is involved, unless your description of the GHE specifically mentions the need for sunlight, the GHE not having any effect at all, at night.
That would be supported by the Earth now being cooler than when the surface was molten, four and a half billion years of continuous sunlight notwithstanding.
Sorry, but thermometers respond to heat, not CO2, regardless of who is doing the measuring.
The GHE works at night and keeps the air from cooling to rapidly. In summertime this results in warm muggy nights.
Maybe you could describe this GHE? It can be observed that the air above deserts can cools very rapidly indeed.
Maybe the GHE doesn’t work in desert regions? It’s very puzzling, isn’t it?
Maybe you can’t describe the GHE in any consistent and unambiguous way at all!
The humidity in Death Valley currently is 3%. There is little H2O in the air so the GHE is very small. This why the desert cools very rapidly at night.
I thought the GHE was supposed to increase temperatures? The hottest places in the world are the driest – the least GHGs!
No wonder there is no consistent and unambiguous description of the GHE.
The higher the temperature the more heat gets radiated away. The heat loss is not the temperature profile, it is the area under the temperature profile.
Slower cooling means more heat gets radiated away.
From ACORN –
” however, the Forum concluded that it is likely to remain the case that several choices within the adjustment process remain a matter of expert judgment and appropriate disciplinary knowledge”
http://www.bom.gov.au/climate/change/acorn-sat/documents/2015_TAF_report.pdf
Expert judgment is not science.
Shown below is a chart of the annual average temperature at Adelaide from 1857 to 1999 from John Daly’s website. I wonder what adjustments the BoM has applied to the data?
Note that there was a cooling from 1857. The government has to be turfed out before they wreck the economy with their net zero plan.
NB: If you click on the chart, it will expand and become clear. Click on the “X” to return to text.
Only if you are high on drugs. It literally bottoms in 1978, and only steps up, once a new measurement system is introduced. If you believe there is a trend in that data, you will believe anything.
I had previously researched this and was waiting for your promised WHWP post, Andy. Here comes a lot of factual support.
Any Google AI summary returns the following, easily verified by further digging. The entire CMIP6 climate model ensemble essentially divides the ocean into three zones: the mixed layer ( which can be further subdivided by euphotic layer), the thermocline (varying by latitude), and the all the rest just being deep and cold. (The reasons for this climate model simplification have been discussed many times here previously, having to do with the CFL computational intractability of numerically solved PDEs. Any grid simplification helps modify the intractable CFL numerical solutions to PDEs climate model fundamental constraint.
The only successful (defined as no spurious tropical troposphere hotspot) CMIP6 model INM CM5 essentially just modified tropical rainfall per ARGO
—but only in their uppermost mixed zone. Several previous posts here discussed.
The problem with ANY three basic ocean zone climate (shallow mixed, thermocline, deep) ‘model’ is that it NO WAY explains the observed WHWP discussed by you here as a major observed SST factor.
A hypothesis. The WHWP is observed long AFTER the plate tectonic closing of the Panama Isthmus, which many including former Princeton geology professor Deffies thought was responsible for the present Pleistocene Ice Age(s) by cutting Pacific from Atlantic circulations.
So it must therefore be related to other very deep ocean currents related to the known but not very well mapped deep thermohaline circulation, which ARGO was never designed to track.
The thermohaline circulation has a round trip (surface to surface) cycle of about 1000 years based on d14C, and is driven very simply by polar winter ocean freezing. As sea ice freezes, it exudes salt to become ‘fresh’ sea ice. The very cold resulting now saltier ocean surface water becomes heavier from exuded salt, so sinks to the ocean floor and must then go somewhere else—hence the term thermohaline circulation. Happens twice a year at the poles. A BIG thermohaline circulation pump we can generally imagine but know very little specifically about—like explaining WHWP.
Thanks Rud, As you note the biggest problem with the models is their very oversimplified ocean structure. The modelers want everything to be related to surface air temperature, but they cannot get the sea surface temperature (SST) right! It is only 2 meters below their chosen air temperature altitude. What is their excuse for not getting the tropical mid-troposphere temperature wrong? They can’t get the SST right. Crazy. The attached plot, from AR6 WGI page 444 shows how they explain one model mismatch (tropical mid-troposphere temps in red) with another mismatch, getting SSTs wrong (in blue). Three observation datasets are in black.
So the world is rapidly warming. Many readers of this blog will be surprised to learn this basic fact
“Rapidly”?
So are we talking about an hour? half a day?
Like paint drying?
A week or more wouldn’t fit the description of “rapidly” in anyone’s world.
Oh look, one of those surprised blog readers
You wouldn’t even notice this supposed “rapid warming” if it hadn’t been shouted at you for 40 years.
Sorry Eric, the Earth is losing about 44 TW. As Fourier said, the Earth loses all of the heat it receives from the Sun to space, plus a little internal heat – currently 44 TW worth.
Maybe you mean some thermometers are reflecting increased man made heat?
Might be worth adding in the W/m^2 of that energy loss. Put it in perspective.
Might be worth adding in the W/m^2 of that energy loss. Put it in perspective.
Nah. From any perspective it’s called cooling, isn’t it?
Only a millionth or four of a Kelvin per annum, but not heating at all.
That is energy transfer from the molten core to the surface of the Earth, about half of which is radioactive decay of long-lived isotopes, it is not the heat loss from the Earth! In order to maintain a constant temperature what Fourier said is correct however if it is warming or cooling that is not true (as has happened multiple times in the past, ice ages and warm periods). That heat that the Earth receives from space is about 120,000 TW which puts the geothermal heat into perspective! Global electricity consumption is about 3 TW.
Phil, the Earth loses about 44 TW. Sunlight is irrelevant – the Earth loses to space all the heat from the Sun, plus a little remnant heat.
Fairytales of a big mostly glowing rock, a long way from the Sun, spontaneously getting colder, then hotter, then colder . . ., are believed by the ignorant and gullible.
No GHE, I’m afraid, That’s religion, not science.
“So the world is rapidly warming.”
The world is not warming any more rapidly than it has done in the recent, recorded past. The warming from the end of the Little Ice Age, 1850 to the 1880’s, was of the same magnitude and high point as the warming from the 1910’s to the 1930’s, and was of the same magnitude and high point as the warming from 1980 to the present.
The world is NOT experiencing unprecedented warming. Our favorite weather forecaster, Janice Dean of Fox News said the heatwave coming to the East coast of the U.S. “might be” unprecedented for this area as it might break heat records set back in the 1880’s.
So stick that in your pipe and smoke it. You have been fooled by the bogus, bastardized Hockey Stick global temperature chart Lie, into thinking we are experiencing unprecedented warming today. Not so.
Philadelphia last reached 100ºF in July 2012, it’s predicted to reach that for a few days next week.
“The deep convection forms high level clouds that keep longwave radiation from escaping and act as a positive feedback.”
Once again, a lack of understanding of control systems and feedback falls back on using the Climate Mafia’s hijacked and repurposed vocabulary.
Sparta,
See Lindzen, et al, 2001. Richard Lindzen is not climate mafia.
https://journals.ametsoc.org/view/journals/bams/82/3/1520-0477_2001_082_0417_dtehaa_2_3_co_2.xml
Andy, perhaps I’m missing something here, but this seems obvious. The AMO is a measure of the temperature of the North Atlantic. This represents just under 10% of the globe.
So why would the temperature of the globe not be well-correlated to the temperature of the North Atlantic? That’s like saying “The temperature of my front yard is well-correlated to the temperature of a tenth of my front yard” … of course it is. Why would it not be?
And more to the point, what predictive or understanding value does it add to notice that the temperature of my front yard is well-correlated to the temperature of a tenth of my front yard? How does that advance us?
For example. The area measured by the AMO is ~ 0° to 70°N and 80°W to 10°E. In the CERES data, that ocean area has a correlation of 0.57 with the global temperature. Then I calculated the temperature of an equal area of the Pacific, ~ 0° to 70°N and 180°W to 90°W … and it has a correlation of 0.60 with the global temperature.
… which is as we’d expect, and so I have to say, so what? What is gained by knowing that the temperature of the North Pacific is well correlated with the global temperature?
What am I missing here?
My best to you, and thanks for all of your good work,
w.
Thanks for the comment/question Willis. I hope to make my point more clear in the remainder of the series.
But specifically to your question, the AMO correlates to HadCRUT5 better than any other long-term climate oscillation. You don’t mention what your measure of global average temperature is or what time period you are looking at. How well does your measure of global temperature correlate to HadCRUT5? Does your period exceed 70 years, the length of the global climate cycle? Literally everything correlates from 1980 to today, they all monotonically increase or decrease. Time period length is huge and so is your measurement type. See my previous post, it might clarify all this.
https://andymaypetrophysicist.com/2025/06/16/climate-oscillations-1-the-regression/
Feynman also pointed out that the energy in a photon is found by multiplying a certain physical constant by the frequency of the photon. Of course, the frequency can be anything at all – so the energy of the photon can also be anything at all.
I have seen on your blog that you believe light does not consist of particles, and make some other slightly odd assertions, which are just not true, according to quantum electrodynamic (QED) theory.
Others have a choice to believe your unsupported assertions, or the innumerable experimental results confirming Feynman’s work. Of course, if you can show one experiment which disproves QED theory, then you would prove Feynman wrong.
In the meantime, I hope you don’t mind if I prefer believing Feynman to you.
Michael,
You are making a very complicated topic into a black and white issue, it isn’t. Sometimes light behaves like particles and sometimes it behaves like waves. This is not an either/or topic. Generally light travels through space as a wave, but it interacts with matter like it was a photon particle, this is probably because light striking any molecule or atom only interacts with it when it is the right frequency. How it works exactly is unknown. Read the following by Tom Shula:
At the end of his 1920 Nobel lecture (Planck Nobel Lecture 1920), Max Planck stated:
Some in climate science who use radiative transfer theory to quantify the so-called “Greenhouse Effect”, cite this as “discovering quantum theory.” Planck was skeptical of photons as particles, and I believe he was expressing that skepticism in his speech as quoted. He did not coin the term “photon”, and in his development of the Planck radiation equation, he spoke of the quantization of emission and absorption, but not of the radiation field itself.
In his paper Anti-photon, W.E. Lamb, Jr. expresses his disdain for the use of the “photon” concept backed up by extensive mathematics. The summary of his paper is:
“It is high time to give up the use of the word “photon”, and of a bad concept which will shortly be a century old. Radiation does not consist of particles, and the classical, i.e., non-quantum, limit of QTR is described by Maxwell’s equations for the electromagnetic fields, which do not involve particles. Talking about radiation in terms of particles is like using such ubiquitous phrases as “You know” or “I mean” which are very much to be heard in some cultures. For a friend of Charlie Brown, it might serve as a kind of security blanket.”
Michael Mischenko in Directional radiometry and radiative transfer_ The convoluted path from centuries-old phenomenology to physical optics also extensively discusses the problems with the photon concept. His discussion begins on page 13 where are also illustrated various configurations associated with directional radiometry pertinent to his work.
One might ask why this is important. In the radiative transfer theory (RTT) as applied in contemporary climate science, the one-dimensional radiative transfer equation (RTE) uses spectral radiance as the energy source that interacts with the IR active gases in the atmosphere. In many treatments this is “translated” to a gas of photons, “particles” of electromagnetic energy that fly around at random in space being emitted and absorbed by IR active gas molecules.
As Mischenko has shown, it is not spectral radiance or “packets of light energy” that interact with particles, it is the electric and magnetic fields that interact with the particles. A “photon” is defined not by what it is, but what it does. It is convenient as a concept for the exchange of electromagnetic energy, but it does not share the physical attributes of matter particles.
Unfortunately, that’s just not true. For example, compressing air quickly can produce air at 500 C, or any temperature at all between say 25 C and 500 C. What frequencies of photons are being emitted and absorbed?
Or, if you prefer solids, friction alone can heat a piece of iron on a vacuum to melting point. As it becomes hotter, what frequency photons is it absorbing and emitting?
You are probably unable to explain how these things occur in terms of Feynman’s QED explanation for all physical processes –
You may waffle all you want, but as far as physical reality is concerned, you don’t seem to want to accept anything that does not comply with your religious GHE beliefs.
Sorry Andy, but as Feynman said “Nature can’t be fooled”. Produce some direct experimental support for your GHE belief, and I’ll change my views.
Very confusing comment, you are all over the place. Let’s stick to the original points:
In today’s physics, I think we can safely say “photons” do not fly from place to place. They only exist when radiation, of the proper frequency, is absorbed by an atom or molecule.
With regard to the GHE,
See here:
https://andymaypetrophysicist.com/2025/02/10/the-climate-catastrophe-a-spectroscopic-artifact/
And here:
https://andymaypetrophysicist.com/2025/02/17/the-anthropogenic-greenhouse-effect-a-spectroscopic-triviality/
Heinz Hug has generously explained his experiments in this area and his interpretation of his results. Very much worth the time.
Andy, you still haven’t provided a consistent and unambiguous description of the GHE.
Belief in something which cannot be described is religion, not science.
The post is not about GHE, it isn’t even mentioned in the post. You are way off topic. Here is another post on the topic that I did write in 2016:
https://andymaypetrophysicist.com/2016/10/31/the-greenhouse-effect/
I also recommend Heinz Hug’s post link above.
If you have no questions on this post, comment on those.
Andy, your post mentions –
implying that you believe CO2 has some role in something or other.
Your link doesn’t help at all, as you say –
but then go on to state the obvious
In other words, agreeing with Fourier who said the same thing over 100 years ago, stating that the Earth loses to space all the heat it receives from the Sun, plus a little internal heat.
So you see why there is no consistent and unambiguous description of the GHE. Claiming that it is a “difference” between two calculated temperatures (one completely nonsensical and the other imaginary), tells you precisely nothing at all.
The Earth, and the Moon have cooled to their present temperatures from an initial molten state, unless you have a simpler explanation which is supported by observation.
Just as a matter of interest, the present estimated heat loss of the Earth is roughly that of a sunless body of 35 K or so. If the energy from the Sun is sufficient to maintain an isothermal Earth temperature of 254 K, the final temperature is 289 K.
The same as needing less energy to raise water to,100 C, if you start with water at 35 C, rather than 0 C. Curious, isn’t it?
No need for a GHE (which can’t be described), at all!
.
Thank you Andy. Very enlightening. A photon is a quanta of energy, it is not a quanta of mass (i.e. a particle). A simple example is that a radio antenna doesn’t “shoot” a bunch of bullets out in every direction for that would imply that the signal is not continuous in time and space.
Very true. All calculations of radiation assume it is continuous in 3D space, photons only become involved when radiation is absorbed by matter.