It’s by far the most important scientific question of our age: Do human emissions of CO2 and other such “greenhouse gases” cause significant global warming, aka “climate change”? Based on the belief that an affirmative answer to that question is a universally accepted truth, our government has embarked on a multi-trillion dollar campaign to transform our economy by, among other things, eliminating hydrocarbon fuels from electricity generation (without any demonstrated workable plan for the replacement), outlawing the kinds of vehicles we currently drive, suppressing fossil fuel extraction, banning pipeline construction, making all your appliances work less well, and much more. Express any doubt about the causal connection between human activities and climate change, and you could very well get labeled as a “climate denier,” fired from your academic job, demonetized by Google or Facebook, or even completely ostracized from polite society.
But is there actually any real proof of the proposition at issue? In fact, there is not.
I had two important posts on this subject back in 2021: one from January 2, titled “Causation Of Climate Change, And The Scientific Method,” and the other from October 28, titled “‘The Climate Is Changing And Human Activities Are The Cause’: How, Exactly, Do We Know That?” Those posts covered the basics of how causation is generally established under the scientific method. Those posts also reviewed certain articles published at the time that gave good reasons to doubt the truth of the proposition that human greenhouse gas emissions are a main driver of significant climate change. Go to those posts for discussions of and links to the 2020/21 articles that I reviewed at the time.
The reason for today’s post is that a couple of important new articles have come to my attention that further make clear that the proposition that human activities, particularly “greenhouse gas” emissions, are causing significant climate change has not been proved and, based on existing data, cannot be proved. I’ll provide links and summaries, and let you draw your own conclusions as to the significance of these new articles.
But before that, let’s review one more time the basics of how causation is extablished under the scientific method. This is from my January 2, 2021 post:
We start with the basic maxim that “correlation does not prove causation.” Instead, causation is established by disproof of all relevant alternative (“null”) hypotheses. Everybody knows how this works from drug testing. We can’t prove that drug A cures disease X by administering drug A a thousand times and observing that disease X almost always goes away. Disease X might have gone away for other reasons, or on its own. Even if we administer drug A a million times, and disease X almost always goes away, we have only proved correlation, not causation. To prove causation, we must disprove the null hypothesis by testing drug A against a placebo. The placebo represents the null hypothesis that something else (call it “natural factors”) is curing disease X. When drug A is significantly more effective at curing disease X than the placebo, then we have disproved the null hypothesis, and established, at least provisionally, the effectiveness of drug A.
And yet somehow these principles don’t apply in the field of climate science. Instead, all the inside clique of the climate science community have decided to agree that the new way to prove causation is to show really, really good correlation with the preferred hypothesis, in which case subjecting the proposition at issue to a test of invalidation against a null hypothesis can be dispensed with. The climate science community calls its system for establishing causation “detection and attribution” studies. The basic idea is to come up with a model (i.e., a hypothesis) that predicts global warming based on increased greenhouse gases, and then collect data that show a very close match between what the model predicted and the data. Correlation with the model predictions is the claimed proof of causation. There are hundreds of such studies in the climate literature. My January 2, 2021 post linked to a classic of the genre, a 2018 IPCC-sponsored article written by a collection of some 36 co-authors who constitute a virtual “who’s who” of the insiders of the climate science cult (e.g., Michael Mann, Phil Jones, Tom Wigley, Ben Santer, etc., etc., etc.). The title is “Detection of Climate Change and Attribution of Causes.” Key quote:
There is a wide range of evidence of qualitative consistencies between observed climate changes and model responses to anthropogenic forcing, including global warming, increasing land-ocean temperature contrast, diminishing Arctic sea-ice extent, glacial retreat and increases in precip- itation in Northern Hemisphere high latitudes.
Just get yourself enough “qualitative consistencies” with your hypothesis and proof of causation will be yours!
The authors of the two new papers beg to differ. First, we have a paper by John Dagsvik and Sigmund Moen of Statistics Norway, dated September 2023, titled “To what extent are temperature levels changing due to greenhouse gas emissions?” This paper is particularly significant because it has been issued by a governmental agency — the government statistical agencies being otherwise all in lockstep in support of the human-caused global warming narrative. Excerpt from the Dagsvik and Moen paper (page 5):
At present, there is apparently a high degree of consensus among many climate researchers that the temperature increase of the last decades is systematic (and partly man-made). This is certainly the impression conveyed by the mass media. For non-experts, it is very difficult to obtain a comprehensive picture of the research in this field, and it is almost impossible to obtain an overview and understanding of the scientific basis for such a consensus (Koonin, 2021, Curry, 2023). By looking at these issues in more detail, this article reviews past observed and reconstructed temperature data as well as properties and tests of the global climate models (GCMs). Moreover, we conduct statistical analyses of observed and reconstructed temperature series and test whether the recent fluctuation in temperatures differs systematically from previous temperature cycles, due possibly to emission of greenhouse gases.
And the conclusion of Dagsvik and Moen (from the abstract):
[W]e find, . . . that the effect of man-made CO2 emissions does not appear to be strong enough to cause systematic changes in the temperature fluctuations during the last 200 years.
A good deal of the discussion in Dagsvik and Moen covers various deficiencies and inadequacies of the existing temperature data series — inadequacies that make it impossible to draw conclusions from existing data about causation of temperature increases from human greenhouse gas emissions. Here is one comment on the data from page 10 that I find particularly significant:
For all three surface air temperature records, but especially NCDC and GISS, administrative changes to anomaly values are quite often introduced, even for observations several years back in time. Some changes may be due to the delayed reductions of stations or addition of new station data, while others probably have their origin in a change of technique to calculate average values. It is impossible to evaluate the validity of such administrative changes for an outside user of these records.
For more than you will ever want to know on that subject, see my thirty part series “The Greatest Scientific Fraud Of All Time.” Bureaucrats altering the data to support their preferred narrative have rendered the data completely useless for any legitimate public policy purpose.
A second important new paper is from Antonis Christofides and co-authors dated September 26, 2023. They introduce their paper with a long post of that date at Climate, Etc. titled “Causality and Climate.” The part of the full technical paper relating to the climate science application can be found at this link. If you go to that last link and try to read through it, you will find technical math that will quickly have your head swimming, even if you are a quasi math geek like myself. However, their fundamental point as to causality in climate science is not very complicated: if you plot recent temperature increases against increases in CO2 in the atmosphere, it’s the temperature increases that come first, and the CO2 increases follow. Thus, if there is causality, it must be that the temperature increase is causing the CO2 increase, rather than the other way around.
Here is the key chart from the post at Climate, Etc.. The authors present it as a quiz: look at the chart, and the explanations, and without any further mathematical analysis, draw a conclusion as to the direction of causation:

From the technical paper:
[T]he surprising finding [is] that, while in general the causal relationship of atmospheric T and CO2 concentration, as obtained by proxy data, appears to be of hen-or- egg type with principal direction 𝑇 → [CO2], in the recent decades the more accurate modern data support a conclusion that this principal direction has become exclusive. In other words, it is the increase of temperature that caused increased CO2 concentration. Though this conclusion may sound counterintuitive at first glance, because it contradicts common perception (and for this reason we have assessed the case with an alternative parametric methodology in the Supplementary Information, section SI2.4, with results confirming those presented here), in fact it is reasonable. The temperature increase began at the end of the Little Ice Period, in the early 19th century, when human CO2 emissions were negligible; hence other factors, such as the solar activity (measured by sunspot numbers), as well as internal long-range mechanisms of the complex climatic systems had to play their roles.
I would make this comment as to both the Sagsvik and Christofides work: They both are using the only available data, which is data emanating from government sources that have been tampered with and altered. However, the important point is that even that data would appear to refute, and certainly does not prove, the endlessly repeated claims of impending climate doom from human CO2 emissions.
It never fails to amaze me how scientifically illiterate “climate scientists” are about basic science (chemistry, physics, biology, math, etc.).
Such as the author’s point that the data prove that warming preceded atmospheric CO2 increases. Like DUHH!!!
Here’s the basic science that the warmunists ignore:
The world’s oceans store about 50 times the mass of carbon than is contained in the atmosphere. Pretty simple calculation based upon measurements of the concentration of dissolved CO2 in seawater extrapolated across the known volume and mass of the oceans.
And it is also well known and proven that the solubility of CO2 in water is a function of temperature. For instance the solubility in water at 7 deg C is 1.331 on a volume of gaseous CO2 to liquid H20 basis, while at 17 deg C it drops to 0.956. That is a reduction in solubility of CO2 in water of 0.375 or 28%. Or 2.8% per deg C sensitivity. Of course there are other factors that affect how much carbon off gases from seawater, both chemical and physical, besides temperature. But the “bottom line” is that warmer oceans release more CO2 gas by a very significant amount given the huge identical in the volume and mass of carbon in the oceans vs that in the atmosphere.
Apparently the warmunists believe that microbe on the flea on the end of the dog’s tail is wagging the dog … and not the (rather obvious) other way around.
“In other words, it is the increase of temperature that caused increased CO2 concentration.”
Or rather that temperature changes usually seem to precede CO2 concentration changes, and that which comes later cannot cause that which occurred earlier. (Or least for those of us who choose to live in an Einsteinian Universe on a practical day to day basis.)
Good luck trying to tell that to Steven “kinetics-can-tell-you-nothing” Mosher.
There are some other arguments that could be made with data, but I no longer feel inclined to help catastrophists over their own inadequacies.
The more I dive into my studies of classic scientific practice and the established scientific method, the more I become convinced that science absolutely demands PEDANTRY.
That is, consistent precision in the application of science tenets, practices and treatments.
Which is why such principles as the null hypothesis and correlation does not equal causation exist.
Otherwise, scientific rigor is discarded, and everything is concluded on the basis of conjecture.
(oops – did I just describe the alarmist version of climate science?)
We have substituted arm waving for rigorous logic and verifiable facts.
We’ve known for decades from ice core samples that they have causation backwards. Recent papers with high resolution modern measurements leave no doubt. Harde 2023 is another one showing this.
https://www.researchgate.net/publication/373256379_Science_of_Climate_Change_About_Historical_CO2-Data_since_1826_Explanation_of_the_Peak_around_1940
False narratives and outright lies are often based on false assumptions. “Consensus” climate science is a house of cards with zero empirical support in the real world. Multiple lines of empirical evidence show it to be preposterous nonsense.
Americans can accelerate the next glacial period by driving battery-powered cars.
If Francis Menton believes that in order to prove causation (i.e. man-made CO2 emissions cause increasing temperatures), it needs to be tested against a “null hypothesis”, then the only “placebo” would for the entire world to stop burning fossil fuel. Some alarmists in the West might try to impose this on Europe or the USA, but unless somebody can convince China to go “net zero”, we will never see the “null hypothesis”.
Which means that causation will never be proven.
An alternative is to use the models, based on the current paradigm, to make predictions. If temperature and precipitation are not within at least 10% of what actually happens, then the models have failed the test of utility. The Scientific Method then requires the model be rejected, or at least modified.
“Our current atmospheric level is around 218ppm – fact”
I hope it is a LOT higher than that… that is close to plant starvation
… did you mean 418ppm
Yes, well spotted bnice, thank you
It is far more impossible than that. As we know CO2 is about 400 PPM right now. We know that humans emit almost 5% of the annual emissions.
That means that the 95% of the CO2 doesn’t cause anything, but the 5% of THAT, which is human emitted, is said to cause the warming.
That implies that only 20PPM of CO2 in the atmosphere is responsible for climate change. That is one CO2 molecule per 50,000 ‘other’ molecules in atmoshpere.
It is so preposterous that I’m totally amazed that so many smart people with a math background don’t see that. It doesn’t pass the sniff test.
Speaking of EV’s…here in Oregon, it snows. But as the EV market increases, gas tax revenue decreases. Now, ODOT, Oregon Department of Transportation is saying they have to cut back on snowplow operations because of budget cuts – and they are funded with gas tax money.
Very nice.
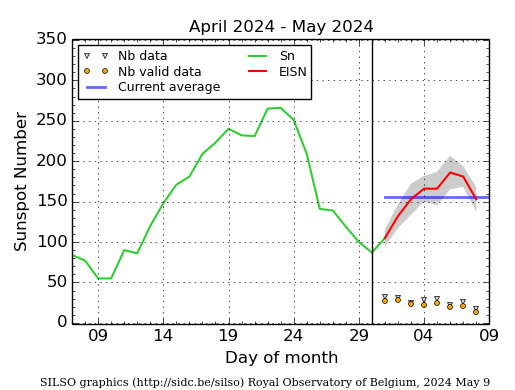
Very faint spots on the solar disk.
I know it does not have any direct influence on the energy balance.
The proof is simple. Look at the output of climate models and they show the globe warming everywhere. That is what is supposed to happen if CO2 is a driver of global energy uptake. The data reveals that some places have sustained cooling trends and some places have no trend. Some warming trends have been apparent for centuries.
All the current warming and cooling trends are following the changes in peak solar intensity. Believe it or not, the sun drives climate and Earth’s orbit drives most of the temperature change but humans are certainly impacting local climate. Urban heat. More or fewer trees. Air stilling from wind turbines.
OK, let’s say CO2 has a significant effect on (very slightly) elevating the world’s temperature, so what? There’s been simply no significant negative effects. https://wattsupwiththat.com/2021/04/25/wheres-the-emergency/
Christofides and coauthors mislead using the same mathematical trick as Murray Salby did long ago. From their 2020 paper:
“We note that differencing is of very common use in economics literature (e.g., [4,5]). In particular, for the [CO2] it proposed taking the logarithm before differencing (something resembling techniques used in economics [5]) and thus the time series that were correlated were Δ𝑇 and Δln[CO2], where the differences are taken over 12 months. By studying lagged correlations of the two, the study asserted that, while both causality directions exist, the results support the hypothesis that the dominant direction is T → CO2.”
Sounds reasonable, but here is the trick: human CO2 emissions have been approximately exponentially increasing over the past few decades, leading to an exponential increase in atmospheric CO2. By taking the logarithm of CO2, they convert the exponential into a straight line increase. By then taking the differences, they convert the linear increase into a constant offset. And finally, they analyze this with the correlation, cross-covariance, and other functions that all begin by _subtracting off a constant offset_. All told, their process is perfect designed to make the human CO2 emission disappear.
This leaves only the real, but much smaller effect of short term temperature changes influencing CO2. Because they have neatly subtracted off the enormous long term trend from their analysis, they give the impression that these tiny month-to-month fluctuations are the dominant effect.
But it’s only dominant because they have specifically designed their process to make human emissions invisible.
I can’t speak to the other papers mentioned in the OP, but everything by Christofides follows this same methodology, which makes all his papers worthless.
Francis. Happily, some people were onto these matters years ago.
….
Probable-Possible, my black hen,
She lays eggs in the Relative When.
She doesn’t lay eggs in the Positive Now,
Because she’s unable to postulate How.
F. Winsor & M. Parry, quoted by Jeff Masten in “Epistemic Ambiguity and the Calculus of Risk: Ethyl Corporation vs. Environmental Protection Agency,” South Dakota Law Review, 1976.
….
How extraordinary! … The richest, longest-lived, best-protected, most resourceful civilization, with the highest degree of insight into its own technology, is on its way to becoming the most frightened.
Aaron Wildavsky, political scientist, University of California, New York Times, 1979.
….
In “The Apocalyptics” 1984, Edith Efron.
In my view, Efron’s book is required reading about bureaucratic scare campaigns. It lays out the modus.
Geoff S
Climate is chaotic so it will behave in an unpredictable way whether CO2 is added or not. Basic thermodynamics/ Boltzmann limits possible warming. The big fear generated is sealevel rise but there’s no way of predicting whether precipitation will increase over Antarctica and Greenland to counteract possible melting or not. The only sensible way forward is to deal with issues when they arise with adaptation. One adaptation will be is to prepare for fossil fuels to run out over the next hundreds of years. Certainly no panic needed at present.
This is quite a long comment so I have split it into two parts. Part 1:
Thank you for the post and for highlighting several relevant papers. These discussions of atmospheric CO2 growth often highlight mass balance arguments, but usually ignore the value of isotope data which, in the case of stable isotopes, must individually satisfy mass balance considerations. Before I get into detail, however, it may help some readers if I add a brief description of Keeling plots as well as a simple explanation of δ13C, which initially may seem very strange – how can a ratio be a negative number?
Put simply, the δ13C of a CO2 sample is the difference between the measured 13C/12C ratio and the 13C/12C ratio of a fixed standard, expressed in per mil (‰) terms. Thus, a negative δ13C means that the sample has a lower 13C/12C ratio than the standard. The units of ‘per mil’ mean per thousand, so exactly the same as if expressed as a percentage (per hundred) but multiplied by 10. So, for example, a δ13C of -13‰ means that the sample has a 13C/12C ratio that is 1.3% lower than the 13C/12C ratio of the standard. This is very neat mathematically, because it can be treated just like the actual ratio, provided any equations are consistent in their application and it is widely used in the scientific literature in this way.
The other general point is that both 13C and 12C are stable isotopes, which means that both must separately satisfy mass balance principles. The presumption regarding total CO2 rather than 12CO2 for mass balance is OK, as it comprises 98.9% of total CO2, but it is not OK to invoke a model that fails to achieve mass balance for 13CO2. The mass balance equations for 13CO2 lead to a very useful plot known as the Keeling plot, where δ13C is plotted against the reciprocal of atmospheric CO2.
First, here is a fairly good reference (pdf) on Keeling plots including the basis as set out in the relevant mass balance equations: Kőhler et al (2006). The basic concept is that a linear relationship between 1/CO2 and δ13C indicates a constant value for the δ13C of the incremental CO2 and this value is given by the intercept of the plot. Figure 1B in the Kőhler paper shows the data for the Law Dome ice core going back to 1750 and provides an intercept δ13C of -13.1‰ with an R squared of 0.96.
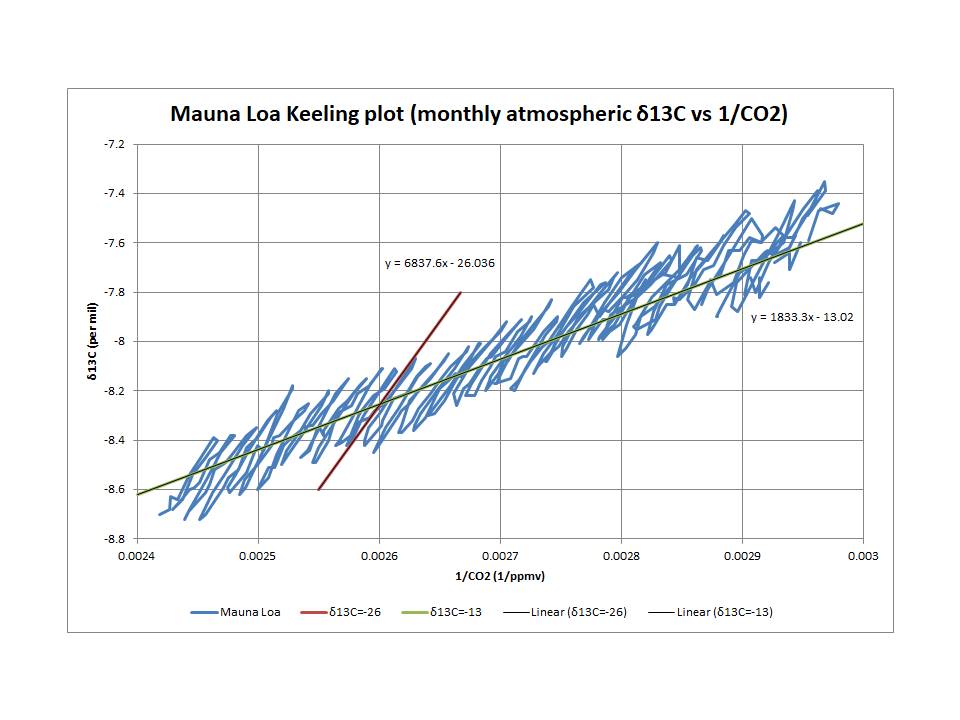
The following two Keeling plots are based on direct atmospheric observations at Mauna Loa downloaded from the Scripps CO2 program keeping in mind that, given a linear relationship, the intercept of the linear fit is indicative of the average net δ13C of incremental atmospheric CO2.
This plot shows both the seasonal cycle and long term trend. We are clearly dealing with (at least) two distinct trends. As such, we should not attempt to fit a linear relationship to the underlying data points. We can, however, highlight the approximate value of the two major trends. The red and green lines drawn over the data are not curve fits, but they are indicative of the true value, which shows that the annual cycle reflects a δ13C of about -26‰, consistent with it primarily reflecting the terrestrial biosphere, whereas the longer term trend reflects a δ13C of incremental atmospheric CO2 of about -13‰, much higher than variations in the biosphere or for fossil fuels (circa -28‰ according to NOAA).
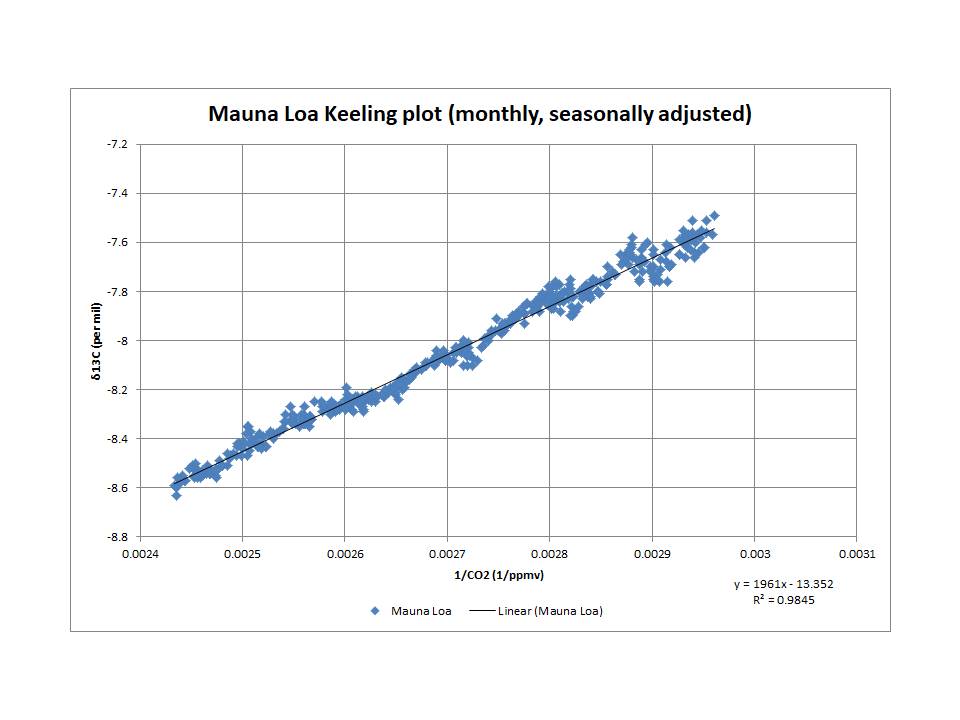
The second plot is with the seasonal cycle removed (removed by Scripps). This provides a strong linear relationship reflecting the long term growth in atmospheric CO2 with an intercept of -13.4‰ and an R squared of 0.98.
According to my analyses, the equivalent values for two other observatories are:
Point Barrow: -13.2‰ and an R squared of 0.96.
South Pole: -13.0‰ and an R squared of 0.99.
Part 2:
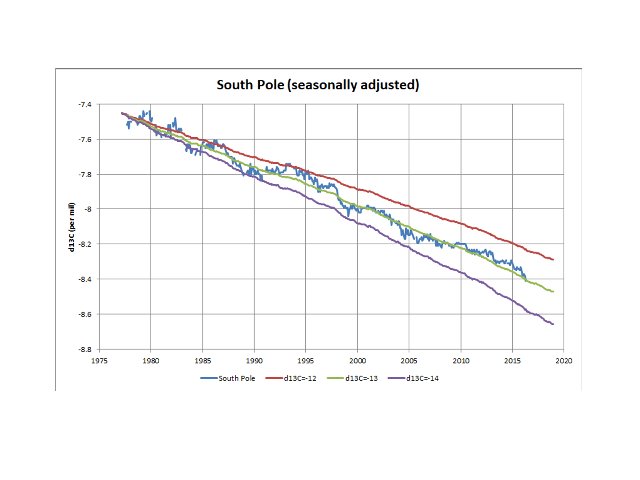
Finally, here is a plot of atmospheric δ13C with time, also highlighting what the trend would look like if the incremental CO2 had a consistent δ13C of -12‰ or -14‰. This confirms the longer term trend (beyond fluctuations due to ENSO variations and Pinatubo). See, in particular, the rapid drop in δ13C associated with the 1997-1998 El Niño and the ‘flat’ trend immediately following this, associated with the subsequent La Niña event.
Note that the measurements at the South Pole (since about 1977) provide almost exactly the same net δ13C for the incremental atmospheric CO2 as the Law Dome data show (since about 1750). The implications of this observation are potentially very significant. It strongly implies a single source (or a constant relationship between multiple sources, which must be highly unlikely) for all the incremental atmospheric CO2 since circa 1750, but a source that is also directly affected by ENSO changes and major eruptions. Models that are based on, or reflect, significant changes in source/sink relationships over time beyond the short term variations that reflect ENSO/Pinatubo need to be reconsidered in the light of this information.
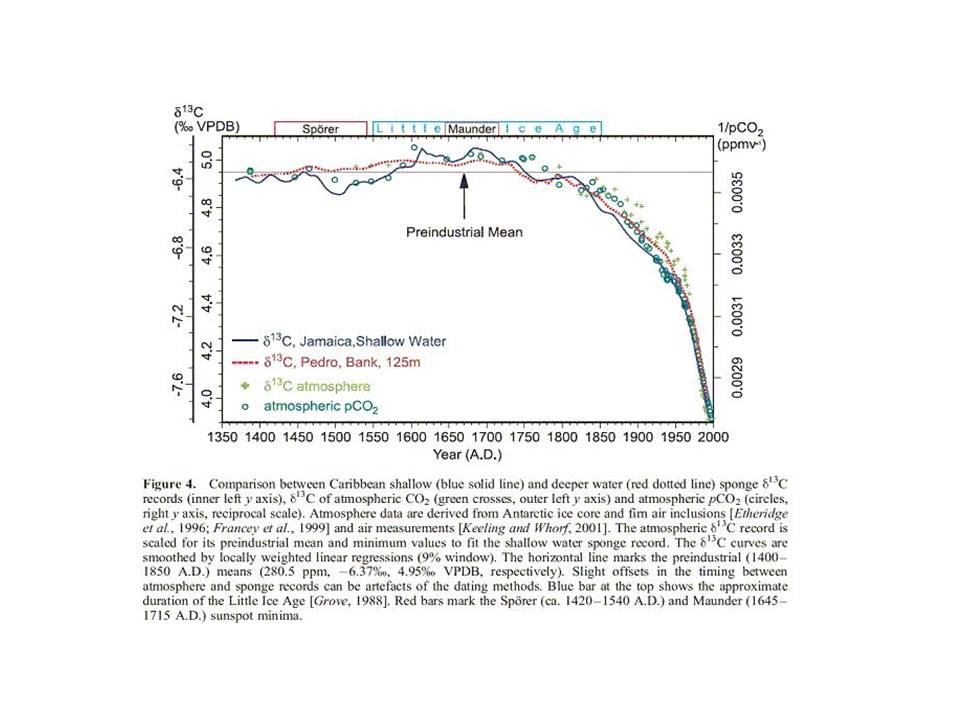
Ferdinand Engelbeen often shows the following plot and has stated elsewhere (at Climate Etc.):
“And that humans are the main cause of the CO2 increase can be seen in the fast drop of the 13C/12C ratio in both atmosphere (ice cores, firn, direct measurements) and ocean surface waters (coralline sponges):
http://www.ferdinand-engelbeen.be/klimaat/klim_img/sponges.jpg”
No, this plot provides no direct proof of humans being the “main cause” based on the “fast” drop in the 13C/12C ratio. What this plot shows is further evidence for a single source of additional atmospheric CO2 since about 1750 with an average net δ13C value of -13‰, a much higher 13C/12C ratio than the value estimated for fossil fuels at around -28‰. The scale of atmospheric δ13C (far left scale) is linear, whereas atmospheric CO2 (right hand scale) is expressed as the reciprocal. The excellent alignment of the trend in δ13C with the trend in 1/CO2 is entirely consistent with a constant net δ13C based on the same mass balance principles on which the Keeling plot is based. We can even determine that value directly from the plot by comparing scales.
(-7.57*345 + 6.48*286)/(345-286) = -12.9‰
CO2 values of 345 and 286 ppmv are derived from the reciprocals of 0.0029 and 0.0035 respectively and the equivalent δ13C values of -7.57 per mil and -6.48 per mil are those on the far left scale that align with these reciprocal points; the calculation itself is based on the 13C mass balance.
So, I repeat, “Models that are based on, or reflect, significant changes in source/sink relationships over time beyond the short term variations that reflect ENSO/Pinatubo need to be reconsidered in the light of this information”.
The plot linked in Ferdinand’s quote is not showing up so here is a version direct from the original paper:
Over on Francis Menton’s Manhattan Contrarian blog, MC reader ‘g’ says this: “Let’s stop arguing and take sensible measures to stop climate change. Why are most deniers in other fields?”
Here is my response to MC reader ‘g’:
For purposes of discussion, let’s define ‘climate change’ as a steady increase in global mean temperature occurring on decadal time scales, whatever its causes might be.
The earth has been gradually warming for at least 150 years, possibly for as long as 300 years. More recent warming is happening at a bit faster rate, but not as fast as the climate models predict.
That said, if you are truly concerned about a steady rise in the earth’s global mean temperature over time, a reliable means for quickly stopping that steady rise in GMT lies in what is called solar geo-engineering through solar radiation modification (SRM).
Solar geo-engineering using SRM can quickly produce a 2C reduction in the earth’s global mean temperature by means of injecting 80 million tons of sulfur dioxide annually into the stratosphere.
SRM as a remedy for climate change is easily done in comparison with the time and cost of Net Zero, but only at considerable risk from unintended environmental consequences.
OK ‘g’ and all others who say we should just get on with it. If you are truly concerned about the steady rise in the earth’s global mean temperature, whatever its causes, then you will support using solar geo-engineering through SRM as a quick and effective remedy, regardless of any unintended collateral damage it might cause.
The failed tropospheric hotspot prediction of all climate models show that dangerous water amplification is not taking place. This failed prediction disproves AGW.
“. . . dangerous water amplification is not taking place.”
Pan evaporation is decreasing which also goes against the water amplification narrative.
What caused previous warnings MWP, RWP, etc. Where is the proof the same mechanism is not responsible today?
ferdberple;
A very good question!
The previous warmings were due to a very low incidence of volcanic eruptions, with the result that most of the time the atmosphere was free of dimming SO2 aerosol pollution, resulting in the incoming solar radiation striking the Earth’s surface with increased intensity, and thus causing . more warming.
For the RWP, VE!4 and higher eruptions averaged ~8/century, and the MWP ~11/century (for the 20th century, there were 78 eruptions).
And the SAME mechanism is occurring today, with decreasing SO2 aerosol levels in our atmosphere due to global “Clean Air” and Net-Zero efforts.
See: “Net Zero Catastrophe Beginning?”
https://doi.org/10.30574wjarr.2023.19.3.1996