From the NASA/GODDARD SPACE FLIGHT CENTER.

Sea ice in the Arctic Ocean is in a downward spiral, with summer minimum extents about 40 percent smaller than in the 1980s. But predicting how the sea ice is going to behave in a particular year is tricky: There are still many unknowns about the conditions of the sea ice cover, to say nothing of the difficulties of forecasting weather and ocean behavior over seasonal timescales.
NASA researchers are working to improve their forecasts of the size of the Arctic sea ice cover at the end of the summer melt season — but the goal is not just to have a better prediction of sea ice coverage. The challenge of making summer sea ice forecasts allows scientists to test their understanding of the processes that control seasonal sea ice growth and retreat, and to fine-tune computer models that represent connections among the ice, atmosphere and ocean.
A grassroots initiative launched in 2008 compares the efforts of different research teams each year to predict end-of-summer Arctic sea ice. This year, three NASA teams are among over three dozen groups that submitted at least one prediction. The participating groups in the Sea Ice Prediction Network (SIPN) use different methods, ranging from statistical analysis to dynamic models, gut feelings and combinations of techniques. Teams can submit forecasts in June, July and August based on the current sea ice conditions at those times. Each fall, the project releases an analysis of the year’s submissions, reviewing lessons learned and providing guidance to future research efforts.
The comparison of different methods allows scientists to go beyond simply collecting observations of sea ice characteristics to test hypotheses about the drivers of sea behavior in a particular year. As an example, such methods will allow researchers to more closely examine the impact of summer ice thickness or the presence of melt water ponds at the beginning of the melt season. It will also let them determine whether a singular characteristic of the ice is more useful than analyzing a combination of factors.
Among other data, the participating teams use sea ice concentration — how much of a given area is covered in ice — and extent, which takes into consideration all areas of the Arctic Ocean and surrounding seas where ice covers at least 15 percent of the ocean surface. Higher sea ice extents and, more importantly, higher concentrations make the ice more resistant to melt, because less of the ocean is exposed and thus less able to absorb solar warmth. The concentration and extent datasets are based on methods developed back in the 1970s and 1980s by scientists at NASA’s Goddard Space Flight Center in Greenbelt, Maryland, and currently curated by the NASA data archive at the National Snow and Ice Data Center (NSIDC) in Boulder, Colorado.
In addition, a long-running NASA aerial survey of polar ice called Operation IceBridge provides measurements to SIPN teams on spring sea ice thickness, melt ponds and snow conditions, which are three other parameters that influence the summer melt season.
Alek Petty, a sea ice researcher at Goddard, has submitted forecasts to SIPN for the last two years that are based on a statistical model that analyzes satellite measurements of sea ice concentration and melt onset. One aspect of the summer melt season Petty tests with his model is the question of how melt ponds — the bright blue puddles of melt water that appear on the sea ice in the spring and summer — can also help predict of the extent of sea ice at the end of the summer. Petty can run his model with data on the spring melt pond coverage obtained by a climate model run by researchers in the United Kingdom.
“One of the difficulties with the melt pond model is that we don’t have many good observations of melt ponds in the Arctic for validation,” Petty said. “That’s what Operation IceBridge is now trying to provide with their recent summer sea ice campaigns.”
Richard Cullather, a climate modeler at Goddard, uses a dynamic model of the climate system that takes into account the interactions among Arctic sea ice, the ocean and the atmosphere. This year, his fourth participating in SIPN, he applied sea ice thickness measurements from satellite data to define the conditions of the sea ice pack before the beginning of the melt season. Cullather expects that this addition will improve the forecast.
“It seems that the ice that remains in the late summer is a function of how thick the ice was to begin with,” Cullather said. “We ran our forecast in June without the sea ice thickness and it came with a much higher prediction than when we actually introduced the thickness measurements. That suggests that adding in the thickness observations is changing our values.”
NASA IceBridge data, along with measurements from ESA’s (European Space Agency) CryoSat-2 satellite, provide key thickness information. With NASA’s Ice, Cloud, and land Elevation Satellite-2 (ICESat-2), a mission scheduled to launch in 2018 that will measure the height of the sea ice above the ocean surface, improved thickness information will become available to inform melt predictions.
Finally, Walt Meier, a sea ice scientist who worked at Goddard until July and is currently with NSIDC, uses a simple statistical method that looks at the total extent of sea ice from 2005 to 2016 and averages the daily changes in extent day by day through the end of September.
“I only use data from the past 12 years because before 2006, the edge of the sea ice pack at the beginning of the melt season was located much farther South, so it would melt more quickly in July and August than it does now,” said Meier, who has participated in SIPN since its beginnings and is a member of the leadership team.
Despite the sea ice pack starting the melt season from a record low maximum yearly extent in March, none of the predictions from Petty, Cullather and Meier call for this year’s September extent to be less than that of 2012, which is the lowest ever observed during the satellite record of Arctic sea ice measurements that began in 1979. Still, their forecasts are suggesting an extent in line with the Arctic sea ice’s long-term downward trend.
A common challenge to existing forecasts is that as the sea ice has dramatically thinned over the past decades, the impact of weather phenomena such as large summer cyclones on the ice cover has increased. Also, weather cannot typically be predicted more than 10 days in advance.
“Summer storms can have different effects,” Cullather said. “If the ice is reasonably thick, the storm can distribute the ice pack so it then covers a larger extent. If the ice is very thin and you spread it, it’ll allow it to melt faster because there’s more open water being warmed by the sun.”
“There’s more and more interest in seasonal predictions of the Arctic sea ice, but at the same time things are challenging because of the changing conditions of the ice pack and how it responds to weather,” Meier said. But improvements in the models and statistics, together with a growing record of sea ice measurements, make forecasters optimistic about the future. “The hope is that the models can outrun the changes in the Arctic, that we’ll be able to catch up and produce more reliable forecasts.”
###
Here is the arctic cap as it appears today from cryosphere U of Iliinios
http://arctic.atmos.uiuc.edu/cryosphere/NEWIMAGES/arctic.seaice.color.000.png
Here is the image from the same time in 1980
http://arctic.atmos.uiuc.edu/cryosphere/IMAGES/ARCHIVE/19800901.png
Yet the graphs show that extent today is Significantly less that the average. The image of today clearly shows the extent and thickness to be much higher……what am I missing
The first chart is doesn’t match the September 1 date.
One day. Of no consequence. Thanks for the comparison, Jamie. Had not known of that additional resource.
ristvan, the August 31,2017 chart is wrong. Cryosphere has not been updating the current sea ice chart for a long time now.
There is currently LESS sea ice now than in August 31, 1980.
Jamie
Unfortunately their charts are messed up and your 2017 is not correct.
What is 9/1/1980 or 9/1/2017 September 1 (US) 9th January (EU).
I think there is a mix up with dates.
“Special Sensor Microwave Imager and Sounder (SSMIS) on the Defense Meteorological Satellite Program (DMSP) F-17 satellite that provides passive microwave brightness temperatures (and derived Arctic and Antarctic sea ice products) has been providing spurious data since beginning of April. Working on resolving problem or replacing this data source.”
http://arctic.atmos.uiuc.edu/cryosphere/
The first chart is probably for month of March.
Yeah…there must be something wrong with image
Here’s Aug 2013…..much different…..although it not march…..must be the latest image…but the satellite is giving poor data
http://arctic.atmos.uiuc.edu/cryosphere/IMAGES/ARCHIVE/20130831.jpg
Sunsettommy
The Cryosphere reports from University of Illinois Urbana were providing spurious (unreliable jumps of 1-3 Million sq Km’s per day) in March and April 2016, then went down completely in mid-April 2016. They have been providing bad anomalies (false area reports) automatically since then. No person at Cryosphere is now studying ice mass, ice area, ice anomalies this scholastic year.
Scratch that source.
RACookPE1978, thanks for the clarification. I wasn’t sure if it was this year or last year.
Jamie,
Yes. Arctic sea ice is lower now than in 1980. But is higher than 2007, 2011, 2012, 2015 and 2016. Soon it will probably be higher than 2008 and 2010, too.
Arctic sea ice fluctuates naturally in about a 35-year cycle. The cycle from 1977 to 2012 was declining, following the PDO shift in ’77. Now Arctic sea ice is gaining. No climatic trend lasts forever.
But even at the current low, Arctic sea ice extent is higher than it has been for most of the Holocene interglacial, ie the past 11,400 years. There is no human fingerprint on Arctic sea ice, except maybe for soot.
Well Cryosphere Today is now Cryosphere Yesterday. Their sea ice extent graphs have been off the wall since one of the satellites when tits up.
They never bothered cross-calibrating another source of data and keep producing BS graphs using broken data. I don’t know whether this applies to the pics you posted but it needs to be checked.
If they cannot get the total ice area sorted out , there is little chance they have such maps based on sound data.
Anthony removed the CT ice extent from the sea ice page a few months ago since it had been broken of about a year and a half.
Greg
The steady deterioration of many sources of climate data available online, hints strongly at an approaching end of the current warming period.
Jamie, that first graph is incorrect. It shows ice in Kara Sea which sats show is currently ice free. Same in East Siberian and Laptev Seas. Something amiss at Chryosphere Today!!
The idea of a downward spiral is complete and utter fraud. They pick a high point for ice and work over a few decades – it is well known arctic temps in the 1930’s were almost the same if not warmer (NASA’s own data – https://judithcurry.com/2014/01/27/early-20th-century-arctic-warming/ ) , and we have tons of observations that the melts were similar to much worse – it’s all smoke and mirror bullcrap. Yes, when we have a natural warming cycle, we have more ice melt – especially at the polls as tropical heat moves toward the poles and is dissipated in a well known process. The arctic melt season this year was short lived, and inline with the average melt during this naturally occurring warm period. The bizarre thing, if you overlay a map of Ice now with ice cover from national Geographic in 1971, during the ice age scare, the amount of extra melt, is not at all alarming, considering natural warmer temps in the arctic ( https://realclimatescience.com/2017/09/small-reduction-in-arctic-sea-ice-since-1971/) – meanwhile, Greenland is through it’s melt season and is challenging records for gains in ice. The billions wasted on Arctic research alone is disgusting – it’s like an exercise in watching grass grow….cold periods more ice, warmer periods less ice.. WOW.. they have spent trillions since about 1989, to try and convince us the arctic is disappearing, and not simply cycling – if the evidence is so damn conclusive (a joke), then we can’t prevent it anyway – so why more F-ing studies? https://realclimatescience.com/2017/09/small-reduction-in-arctic-sea-ice-since-1971/
“The scientific method” – Well yes, that is making observations, drawing conclusions and formulating theories. Give NASA, say, a thousand years – by then they might have enough observations to be able to find a discernible pattern.
I disagree. They seem to be narrowly focusing on forecasting minimum summer sea ice extent based on observations made during the previous winter/spring. This isn’t an exercise to predict decadal sea ice behavior for example. This seems like a relatively plausible endeavor.
What caught my attention was this quote:”The challenge of making summer sea ice forecasts allows scientists to test their understanding of the processes that control seasonal sea ice growth and retreat, and to fine-tune computer models that represent connections among the ice, atmosphere and ocean.”
Isn’t there a logical disconnect between this statement and the constant drone we hear as to the ability of the GCM’s to accurately simulate the way the real climate behaves? If the ability of the GCM’s to accurately represent the “connections among the ice, atmosphere and ocean” is something in need of testing for the purpose of a relatively trivial task of predicting how much ice will melt in a season, when you already know ocean conditions (el nino – la nina, atlantic oscillation, etc.) along with starting sea ice depth, etc., how can you simultaneously be confident that you have sufficiently modeled the “”connections among the ice, atmosphere and ocean” to accurately represent changes in climate over decades and in response to a change in a single input (CO2)?
My Mark 1 eyeball looking at simple graphs has told me that low winter extents don’t ussualy mean that your are going to have a low summer extant. Yet NASA hasn’t figured it out nor has Tony McLeod, seaice and Griff, no matter how many times I have told them. Well Tony has probably finally learned but due to our bet he shouldn’t be around to tell us so.
Making them worse would be more of a challenge.
Since they start by assuming that Arctic sea ice is going to keep on declining indefinitely, they’re sure to be wrong.
Making them worse would be more of a challenge.
LOL
Fire the prognosticators who get it wrong. Seriously why pay them otherwise?
They have been doing the Arctic sea ice prediction since 2008, almost 10 years, and there hasn’t been much progress. In July the average prediction was 4.50 million km2 for the September average. For the August prediction it increased to 4.54.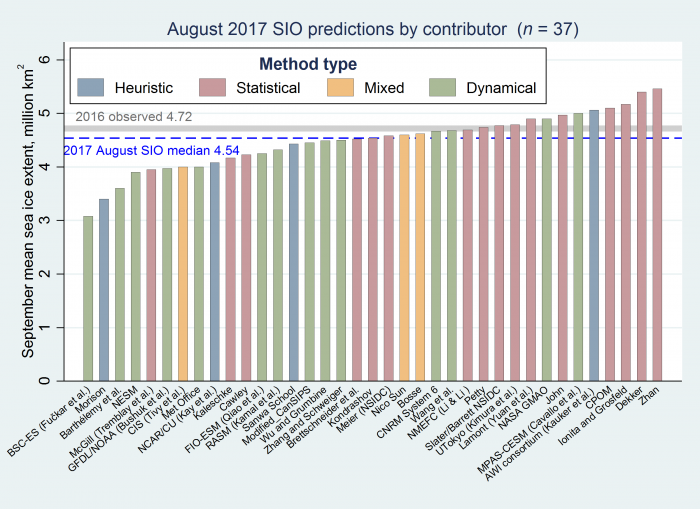
The problem is the ice is already above the 2016 level of a year ago, and very likely to end that way. So it is another year when most of the models have failed… again.
It is clear that the models that are performing better are the statistical ones, and this should be worrisome to the scientists. If the physical models are performing worse than the statistical ones, the logical conclusion is that they don’t understand very well what are the driving factors for the melting. That explains why the prediction exercise is not going too well after 10 years and the melting prediction is so poor.
https://www.arcus.org/sipn/sea-ice-outlook/2017/august
Here is the correlation between AMO and September Arctic sea ice. AMO is probably one of the factors that influence Arctic sea ice melting, or both depend on the same factor, as the relationship has been confirmed by scientists. It is interesting that the correlation breaks down below 5 million km2, probably indicating that very low levels of Arctic sea ice are more at the mercy of weather elements than anything else. This also complicates very much Arctic sea ice predictions.
http://peakoilbarrel.com/wp-content/uploads/2017/08/613654-1.png
True. For models to work, they need to predict August and September WX a year in advance.
Low sea ice years are due to late summer cyclones. Also El Niños.
Right now, in 2017, the Arctic sea ice extent is a good 0.5M km^2 higher than 2016.
The basic numbers say the minimum (under the sea-ice-outlook methodology) will be around 5.2 M km^2.
That is quite a bit higher than one would have said a month ago but August 2017 has seen a very low rate, particularly late August when the ice extent actually increased for four days in a row.
Tough to say this low melt rate will continue throughout September but only the very highest sea ice outlook predictions above are going to be close.
Sorry, I meant to say the September ice extent will be 5.2 M km^2, not the minimum daily number which could be around,4.8 M km^2 (noting there is 225,000 km^2 added due to the north pole hole in satellite coverage).
“NASA scientists seek to improve sea ice predictions.”
Uh, oh. Wasn’t that what they said about surface temperature readings?
“NASA researchers are working to improve their forecasts of the size of the Arctic sea ice cover at the end of the summer melt season……………..
“The hope is that the models can outrun the changes in the Arctic, that we’ll be able to catch up and produce more reliable forecasts.”
Color me curious but, WHY? Seems like a lot of tinkering busy work and expense with such little applicable value that no real purpose or need is even mentioned.
There are many other truly dire needs that are lacking attention and funding.
What would be the loss if all of the ice measuring, studying, monitoring of freeze/melt cycles and forecasting came to an abrupt halt?
Who would miss it but those living off the busy work?
Why should I be nervous when Nasa and company want to improve sea ice extent measurement? They ‘improved’ sea level measurements when, during the Pause, SLR was flattening. They added in an ocean basin elastic rebound factor to account for decreasing volume of the sea basins. This means that official sea level is now some height above physical sea level. If they wanted to use sea level to determine how ice melt is effecting sea level, they should have SUBTRACTED this factor to obtain what ice melt is contributing, but they should not change a metric that doesn’t have a physical existence.
Oh, also the abandonment of high tech sea temperature buoys in favour of ships intake measurements and night sea air temperatures to ‘correct’ the record that gave us the Pause!
Oh, and they changed the Saffir-Simpson Scale which made Harvey a Cat 4 instead of an old fashion Cat 3, which they measured from an airplane that higher up has a stronger wind. They are supposed to measure at 12 feet above ground.
Oh, and although all state record high temperatures and number of days above 100F were set in the 1930s and 40s and the aggregated annual temperatures for the lower 48 were higher than 1998 and still were by 2007. This was fixed by GISS’s Hansen by pushing the earlier record down by about 1.5C!! Later it was found out that similar charts for Canada, Greenland Iceland, Siberia, South Africa, Paraguay… also supported the older US temperature pattern and they were similarly pushed down.
“Improve sea ice predictions”?
Why!?
What beneficial purpose does predicting sea ice minimums perform?
Reminds me of similar games; “blind man’s bluff” and “pin the tail on the, er, donkey”.
Only, when these games are played by people of mature years; they tend to be drunk or senile.
These characters are not practicing science. They’re playing model games, glory and rent seeking based on belief and wishful thinking.
It is sad to see what ex-scientists become when they cease practicing science.
It makes work for federal bureaucrats.
My questions were:
How are “sea ice minimums” any sort of “falsifiable science”?
Sea ice minimums are a pretense at calculating the percentage of sea ice cover in a grid.
As has been demonstrated in the past, simple Arctic storms easily rearrange sea ice, drastically changing area and thickness.
That makes guessing a “sea ice minimum” an attempt tp prophecy random factors; all too often using “gut feelings and beliefs”, not following practical repeatable ice forecasts.
Guessing sea ice minimums may make for fun wagers, but the current state of sea ice science as practiced by the sea ice climastrologists is fakery; which is why the sea ice fakirs get away with their alarmism sophistry.
Sheesh! Even way back in high school, we measured ice by volume when calculating heat exchange; not by visible surface ice.
How to improve sea ice predictions:
Step One: Stop assuming the heat is from an imaginary source and research where the actual heat is actually coming from.
In terms of actuals, were are very close to this year’s minimum point. The area of 100% concentration is nearly equal to the overall area.
This passage bothers me:
“We ran our forecast in June without the sea ice thickness and it came with a much higher prediction than when we actually introduced the thickness measurements. That suggests that adding in the thickness observations is changing our values.”
Obviously someone wrote the code to include the models response to the thickness measurements. Why would he sound suprised when the model responded? The question should be whether the modeled response is accurate or not?
Am I missing something?
Been reading about Russian nuclear icebreakers. Now they have a nuclear LNG tanker with full icebreaker capability that can move through 2 (two) meter thick ice. Saw in a video that slabs of ice get thrown on to unbroken ice. Thick ice takes longer to melt. Wonder what effect use of these vessels will be on future arctic ice.
NW passage commercial ships with ice breaker capability may destabilize and reorganize ice flows by creating weak joints with no study of the consequences. They get to just get up and go run through it.
“But predicting how the sea ice is going to behave in a particular year is tricky”
There are a whole lot of things that we don’t know and things we will never know but our ego has gone so far ahead of us that we have an unrealistic expectation that we should know everything. It is for this readon that we can can no longer say “we don’t know that”. The best that we can do is “it’s tricky”.
While on the subject of ice… NANSEN data hints at imminent minimum which looks like placing 2017 #5
NASA scientists seeks to upgrade climate ice models from useless vomit to just plain garbage as a first step.
When have we ever seen their previous forecasts published?
They do this so often. By announcing improvements, they are saying all before were bad.
For whom are they published? Polar bears can’t read.
Who would be foolish enough to believe them, anyway?
NOAA should bite the bullet and purchase the dancing monkey with the dart board.
Looking at the profile of the last glacial maximums and minimums it will be hard to forecast in the short term (10s of years) something that only becomes apparent over thousands of years. It has taken around 50,000 years or more to reach glacial maximums and the route there was extremely erratic. Based on the knowledge we have so far we are already cooler than 5/6,000 years ago indicating that the next cooling phase has already begun. It may not be possible to confirm that we are cooling for at least another 1000 years as short term temp fluctuations can be interpreted as long term trends. We didn’t do too well predicting what would happen before the 2008 financial crisis and there were huge amounts of ‘clever’ people involved, or they were considered clever by people who considered themselves clever.
What amazes me, when watching the graph for arctic and Antarctic sea when the graph of one takes a significant uptick over the course of a day or two there is almost always the exact opposite reaction on the other graph. It zero sense to me but I have noticed it dozens of times, more than I think could be covered by meat coincidence, can’t fathom any possible connection but it there no the less.
Omg auto spell argh!!!!
Arctic sea ice predictions? Come on man. This is surreal. We are so caught up in the pointless fight no one has bothered to work out the scientific and practical implications of the alternative paths.
The warmists of course ignore the fact that there has been a lack of warming for the last 20 years which is one of a more than a dozen independent analysis results that disproves their hypothesis that the warming in the last 150 years was primarily caused (CO2 is assumed to be responsible for more than 50% of the warming in the IPCC reports, 100% in all warmists discussions) by the increase in atmospheric CO2.
Basic fundamental signal analysis unequivocally shows the warming in last the 150 years is natural, caused by solar cycle changes.
The authors of the paper that is discussed in the above video clip explain their analysis and its implications.
They transferred the temperature data 1850 to present from the time domain to the frequency domain by a Fourier Transfer which is a standard technique to enable the researchers to determine the portion of the signal that is cyclically changing vs non-cyclic changes which in turn can be used to determine the nature of the forcing.
The increase and decrease in temperature is all periodic with the same periods as in the past. There is zero evidence in the analysis of a monatomic increase in temperature in the transformed data. If CO2 was the mechanism responsible for the warming there would be evidence of a monatomic increase at all frequency in the frequency domain which there is not.
The period of the oscillations in the planetary temperature data matches known solar cycle variance.
The analysis conclusion is all of the warming in the last 150 years is periodic, there is no evidence of any monatomic CO2 warming in the frequency domain analysis.
There are hundreds of papers that support the above conclusion.
http://earthobservatory.nasa.gov/Newsroom/view.php?id=24476
The best way NASA could improve Arctic Ice Extent predictions is to start adding 100,000 KM^2/yr in Ice Extent growth over the next 30 years to account for PDO and AMO both being in their 30-yr cool cycles form 2019.
This year’s Arctic summer Minimum will be roughly 1,000,000 higher than the 2012 record low, and will be ranked around the 6th lowest since 2007…
CAGW’s dire predictions of an “ice-free” Summer Arctic Minimum from 2012 has come and gone in peels of laughter and eye-rolling.
NASA and CAGW have become a laughingstock…
National Aeronautics and Space Administration. WTF has that got to do with ice predictions (and volcanoes for that matter). Do these guys have a mission statement or do they just get to fart about with whatever they like?
Why cherry pick the 1980s sea ice extent as “normal”.