From the NASA/GODDARD SPACE FLIGHT CENTER.

Sea ice in the Arctic Ocean is in a downward spiral, with summer minimum extents about 40 percent smaller than in the 1980s. But predicting how the sea ice is going to behave in a particular year is tricky: There are still many unknowns about the conditions of the sea ice cover, to say nothing of the difficulties of forecasting weather and ocean behavior over seasonal timescales.
NASA researchers are working to improve their forecasts of the size of the Arctic sea ice cover at the end of the summer melt season — but the goal is not just to have a better prediction of sea ice coverage. The challenge of making summer sea ice forecasts allows scientists to test their understanding of the processes that control seasonal sea ice growth and retreat, and to fine-tune computer models that represent connections among the ice, atmosphere and ocean.
A grassroots initiative launched in 2008 compares the efforts of different research teams each year to predict end-of-summer Arctic sea ice. This year, three NASA teams are among over three dozen groups that submitted at least one prediction. The participating groups in the Sea Ice Prediction Network (SIPN) use different methods, ranging from statistical analysis to dynamic models, gut feelings and combinations of techniques. Teams can submit forecasts in June, July and August based on the current sea ice conditions at those times. Each fall, the project releases an analysis of the year’s submissions, reviewing lessons learned and providing guidance to future research efforts.
The comparison of different methods allows scientists to go beyond simply collecting observations of sea ice characteristics to test hypotheses about the drivers of sea behavior in a particular year. As an example, such methods will allow researchers to more closely examine the impact of summer ice thickness or the presence of melt water ponds at the beginning of the melt season. It will also let them determine whether a singular characteristic of the ice is more useful than analyzing a combination of factors.
Among other data, the participating teams use sea ice concentration — how much of a given area is covered in ice — and extent, which takes into consideration all areas of the Arctic Ocean and surrounding seas where ice covers at least 15 percent of the ocean surface. Higher sea ice extents and, more importantly, higher concentrations make the ice more resistant to melt, because less of the ocean is exposed and thus less able to absorb solar warmth. The concentration and extent datasets are based on methods developed back in the 1970s and 1980s by scientists at NASA’s Goddard Space Flight Center in Greenbelt, Maryland, and currently curated by the NASA data archive at the National Snow and Ice Data Center (NSIDC) in Boulder, Colorado.
In addition, a long-running NASA aerial survey of polar ice called Operation IceBridge provides measurements to SIPN teams on spring sea ice thickness, melt ponds and snow conditions, which are three other parameters that influence the summer melt season.
Alek Petty, a sea ice researcher at Goddard, has submitted forecasts to SIPN for the last two years that are based on a statistical model that analyzes satellite measurements of sea ice concentration and melt onset. One aspect of the summer melt season Petty tests with his model is the question of how melt ponds — the bright blue puddles of melt water that appear on the sea ice in the spring and summer — can also help predict of the extent of sea ice at the end of the summer. Petty can run his model with data on the spring melt pond coverage obtained by a climate model run by researchers in the United Kingdom.
“One of the difficulties with the melt pond model is that we don’t have many good observations of melt ponds in the Arctic for validation,” Petty said. “That’s what Operation IceBridge is now trying to provide with their recent summer sea ice campaigns.”
Richard Cullather, a climate modeler at Goddard, uses a dynamic model of the climate system that takes into account the interactions among Arctic sea ice, the ocean and the atmosphere. This year, his fourth participating in SIPN, he applied sea ice thickness measurements from satellite data to define the conditions of the sea ice pack before the beginning of the melt season. Cullather expects that this addition will improve the forecast.
“It seems that the ice that remains in the late summer is a function of how thick the ice was to begin with,” Cullather said. “We ran our forecast in June without the sea ice thickness and it came with a much higher prediction than when we actually introduced the thickness measurements. That suggests that adding in the thickness observations is changing our values.”
NASA IceBridge data, along with measurements from ESA’s (European Space Agency) CryoSat-2 satellite, provide key thickness information. With NASA’s Ice, Cloud, and land Elevation Satellite-2 (ICESat-2), a mission scheduled to launch in 2018 that will measure the height of the sea ice above the ocean surface, improved thickness information will become available to inform melt predictions.
Finally, Walt Meier, a sea ice scientist who worked at Goddard until July and is currently with NSIDC, uses a simple statistical method that looks at the total extent of sea ice from 2005 to 2016 and averages the daily changes in extent day by day through the end of September.
“I only use data from the past 12 years because before 2006, the edge of the sea ice pack at the beginning of the melt season was located much farther South, so it would melt more quickly in July and August than it does now,” said Meier, who has participated in SIPN since its beginnings and is a member of the leadership team.
Despite the sea ice pack starting the melt season from a record low maximum yearly extent in March, none of the predictions from Petty, Cullather and Meier call for this year’s September extent to be less than that of 2012, which is the lowest ever observed during the satellite record of Arctic sea ice measurements that began in 1979. Still, their forecasts are suggesting an extent in line with the Arctic sea ice’s long-term downward trend.
A common challenge to existing forecasts is that as the sea ice has dramatically thinned over the past decades, the impact of weather phenomena such as large summer cyclones on the ice cover has increased. Also, weather cannot typically be predicted more than 10 days in advance.
“Summer storms can have different effects,” Cullather said. “If the ice is reasonably thick, the storm can distribute the ice pack so it then covers a larger extent. If the ice is very thin and you spread it, it’ll allow it to melt faster because there’s more open water being warmed by the sun.”
“There’s more and more interest in seasonal predictions of the Arctic sea ice, but at the same time things are challenging because of the changing conditions of the ice pack and how it responds to weather,” Meier said. But improvements in the models and statistics, together with a growing record of sea ice measurements, make forecasters optimistic about the future. “The hope is that the models can outrun the changes in the Arctic, that we’ll be able to catch up and produce more reliable forecasts.”
###
Pen Hadow looks for a new assignment to evaluate downward spiral of the sea ice in the Arctic Ocean.
As I recall in the late 70s and early 80s, they were so concerned about global cooling and ice ages, that they were hot to scatter soot on all of that sea ice to stop the ice age in its tracks.
G
a few nuts thought that. not the majority.
Steve, PIOMAS is a model?
“a few nuts thought that. ”
Just like a few nuts, many of them the same people, think that ENHANCED ATMOSPHERIC CO2 is a problem…
…..which it isn’t !!
Crushed nuts and dodgy used car salesmen.
In terms of Arctic sea ice volume, it seems to be a peculiar downward spiral that doesn´t seem to go down:
dmi?
if so its a model.
Steve, Like RSS ESTIMATIONS of sea ice thickness? 😉
Yeah I noticed that when Griff was going on about it. The data from 2008-2017 is basically flat with 2012 the obvious low standout. So I was wondering where all the decline came from and then when you look at the min max one you can see it is all historic 1980-2008. It definitely isn’t accelerating, I don’t have a problem showing it as a linear decline which would mean ice free in 30 or 40 years. There obviously must also be a chance it isn’t going to go any lower for a number of years given it hasn’t really moved in decade.
“Sea ice in the Arctic Ocean is in a downward spiral …”
Not a good start to improving ice predictions. First you need to honestly and accurately describe what has already happened. The Death Spiral is Dead
https://climategrog.wordpress.com/2016/09/17/the-death-spiral-is-dead/
With current Arctic sea ice extent at the same level as it was a decade ago, the constant assertions melting at “unprecedented rates” or death spiral etc are becoming farcical .
Like the iconic polar bear, this particular canary just refuses to fall off its perch.
At the moment, Arctic sea ice is well above a decade ago, and most years since then.
The day 241 Arctic sea ice extent doesn´t seem to be in a downward spiral either: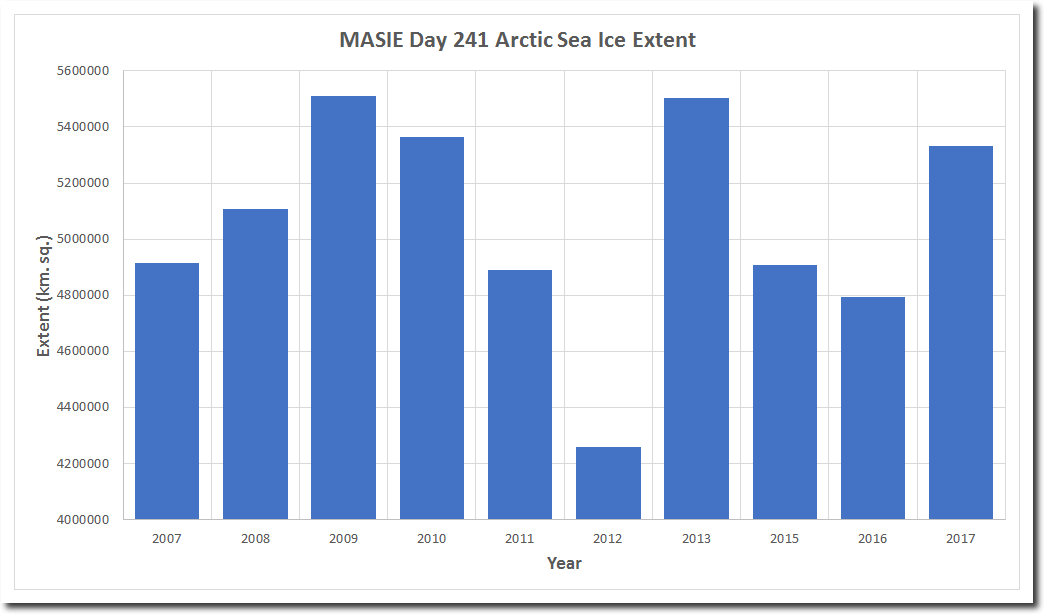
Yup. Five-year uptrend confirmed.
masie?
if so it cannot be used for year to year comparisons.
ur on roll
Steve, you going to say no to this too?
http://www.natice.noaa.gov/ims/images/sea_ice_only_small.jpg
Sunsetonmy
How does the same chart look using volume / concentration. That is, area plus thickness calculation.
It would make an interesting comparison.
Area is one dimensional and not a complete value.
No , area is TWO dimensions, not one. volume is three.
Both are relevant in different ways, neither is “better”.
Area/extent is relevant to feedbacks since most depend upon the exposed surface: evaporation, insolation, outwards IR emissions. . Volume is relevant as an indication of shortage of energy.
storage of energy !
Greg
Your comments are not correct.
A top down image of sea ice area is one dimensional. It provides no consideration of the thickness. It is area.
From one year to the next the area may be the same but the thickness may be on average 30% less. There is a considerable difference in both the energy required to reduce the volume, and the residual energy.
The key influence’s controlling area, also control thickness.
Therefore by only using area without consideration of thickness limits the understanding of volume loss per year and the energy required to affect the change.
Regards
“masie?
if so it cannot be used for year to year comparisons.”
From masie faq:
“Use the Sea Ice Index when comparing trends in sea ice over time or when consistency is important. Even then, the monthly, not the daily, Sea Ice Index views should be used to look at trends in sea ice. The Sea Ice Index documentation explains how linear regression is used to say something about trends in ice extent, and what the limitations of that method are. Use MASIE when you want the most accurate view possible of Arctic-wide ice on a given day or through the week. ”
So MASIE gives the best information on the amount of ice at any given point in time but still the results aren’t comparable. And since it shouldn’t be done NSIDC presumably presents results for several years together from pure perversity:
http://masie_web.apps.nsidc.org/pub/DATASETS/NOAA/G02186/plots/4km/r00_Northern_Hemisphere_ts_4km.png
ozonebust, you obviously do not have enough scientific or maths training to understand what “one dimension” means.
One dimension is a scalar or linear measurement, eg this road is a mile long; 2 dimenstions gives an area for example: this field is 600 sqr yards. Area or extent is a two dimensional measurement, The fact that this is measured from above has no relevance. The volume estimations are also made from above and that is 3D.
The key influence’s controlling area, also control thickness.
That’s your assertion, I explained wyy both area and volume are relevant and why both are useful in different ways. You reply with unargumented assertion. I guess you must be a warmist and/or “climate expert”.
” influence’s ” is a possessive, not a plural.
Not only are you scientifically illiterate you are literally illiterate.
Is downward spiral a new type of correlation? like linear, logarithmic, sigmoid and such?
SHOCK! If sea ice is either thinner or significantly further south, it melts more quickly.
Who knew?
More grant money please.
No ! The more there is, the more surface area (most of it is under water) the faster it melts. The melt rate depends on how much surface area is in contact with that surface water that went up there from the tropics. We are talking of kg/s, not percent.
G
Yes, by all means fine tune those computer models. Maybe one year we can see somebody actually sail a boat to the North Pole as has been predicted for how long now? While you’re at it, work on those models that predicted 5 degree global warming by the end of the century.
Why not just have a computer model sail a predicted boat to the modeled ice free pole.
Would you adjust the model based on the assigned number of captains on the modeled boat?
Shhhh! You’ll just give them more silly ideas, and the press will be too stupid to see the silliness of it.
The description “Downward spiral” is loose-talk over-the-top and alarmist. For sure there is a distinct downward linear trend – as can be seen here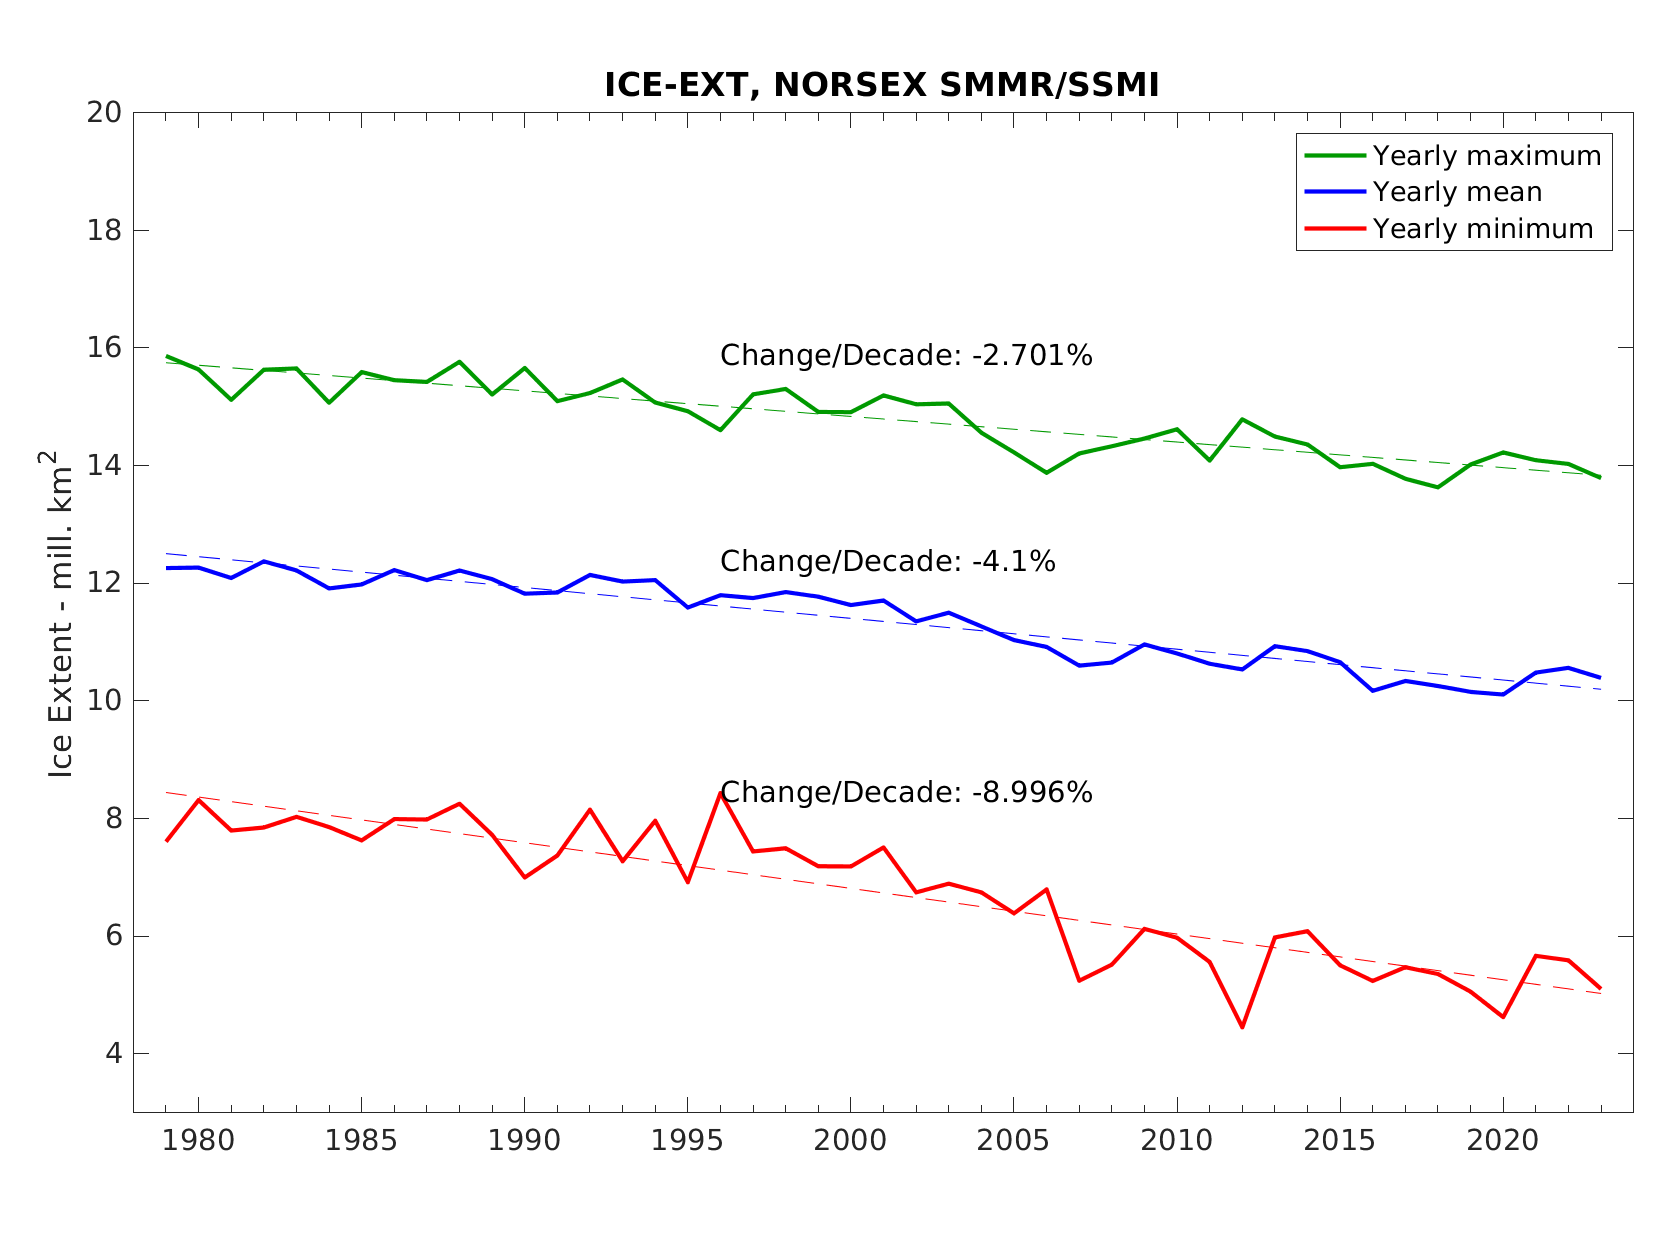
Except for the fact that the ice level in 1979 was an anomaly with exceptionally high ice levels.
RAH, I have tried to source this Vinnikov et al. 1980 graph. I find it hard to believe sea ice “amount” could have been graphed this accurately pre-satellite. I would love to see the source and justification. Must have been created by temperature proxy estimation.
Yes the age of the coming ice age; 1976-79.
G
Duncan,
There were satellite observations in the 1960s and ’70s, just not by a sea ice-dedicated satellite.
And before that, ice edge observation maps were made by various services earlier in the 20th century.
another fake chart with no real data behind it.
[I call bullshit on Mosher, these are two charts from two separate scientific reports. One is Vinnikov et al. 1980, and the other is from NOAA data of the last 30 years, superimposed. There’s real data there even if presented in a way you don’t like. -Anthony]
I note that Walt Meier used recovered Nimbus satellite pictures from 1964 and his number is bang on for the graph in September 1964.
There are also satellite-based estimates from 1972-1979 which are a somewhat higher than the above graph.
So it is more like the sea ice continually expanded through the cold 1970s which peaked at about 1979. I can link to the data if someone wants.
Bill,
IMO ice expansion began in the late ’40s and proceeded through the ’70s, with of course large annual differences.
Steve Mosher, the Vinnikov paper contains the chart, oh you didn’t know that came from a “peer reviewed” and published paper?
Snicker….
Why don’t you stop being an insufferable snob?
I like it when Anthony speaks his mind 🙂
Here’s the source of the Vinnikov graph. DOE report (1985), page 152, Figure 5.2
https://www.osti.gov/scitech/servlets/purl/5885458
Arctic sea ice extent dropped 15% from 1925 to 1945. Similar percentage drop from 1979 to 2015. It’s cyclical
Nice graph. Note that the decline in maximums is not large, it is the fluctuations in annual minimum that drive the average. And note that up to 1996 the minimums were flat, then a sharp drop to 2007, and flat since. And we know there was an unusual flux of old ice out through the Fram Strait starting about 1998.
My comment pertains to JCalvert’s graph.
BS, her is Vinikov;
http://climate.envsci.rutgers.edu/pdf/VinnikovScience.pdf
Your graf is a spleis made by The Great “Sea Ice Communicator”, AKA Tony Heller.
You cite the wrong paper (from 1999, not 1980) and can’t even spell “Vinnikov”, very convincing. The correct citation is:
Vinnikov, K. Ya., G. V. Gruza, V. F. Zakharov, A. A. Kirillov, N. P. Kovyneva, and E. Ya. Ran’kova, Recent climatic changes in the Northern Hemisphere, Soviet Meteorology and Hydrology, 6, 1 – 10, 1980.
Agree that if anyone should be doing this, it ought to be NOAA, not NASA. But whoever wants to forecast summer Arctic sea ice should definitely not hire Griff. As his betters told him would be the case, he was, as always, as wrong as wrong could be.
Not only will there be no new record low this year, but 2012 will probably the low for the next 70 years or so, until the next low point in the 35-year sea ice cycle.
Past highs and lows of Arctic sea ice:
Low: 2012
High: 1977 (year of PDO flip)
Low: c. 1942 (free navigation of Siberian sea route, aka NE Passage)
High: c. 1907 (year btw Peary’s two NP attempts)
Low: c. 1872 (year after Hall’s Polaris expedition, first to attempt the NP)
High: c. 1837 (Franklin died ten years later).
Note difference in approach of Hall, who hoped to reach the Pole by sea, and Peary, who went over the ice.
Let’s not forget Clarkson 2007 who did it by car.
[That attempt was successful, but remember, they drove to the Magnetic North Pole, not the geometric north pole. .mod]
Guess I should have said next 65 years, since we’re already five years into the waxing Arctic sea ice cycle.
Yes, it’s early days but I suspect that OMG. OMG low in 2012 was the turning point. That is bracketed by the OMG lows of 2007 and 2016.
https://climategrog.wordpress.com/2016/09/17/the-death-spiral-is-dead/
I think the next five year span will show a positive trend.
Sorry Gloateus, I disagree with your NOAA hiring recommendations.
Griff has a nearly perfect record of predictions. The fact that he is essentially always wrong has great predictive value, so good that NOAA should definitely hire him. We can easily take his Arctic sea ice predictions, and then plug the opposite results into the models for improved accuracy.
\sarc off
Pill,
Of course you’re right. On the Street, the 100% loser would be worth his weight in blue chip securities, as a perfect counterindicator.
But to be of use to NOAA, he’d have to make sea ice predictions more precise than “a new record low is a sure thing”.
Maybe I missed it but I didn’t see any mention of measuring current inflow from the N. Pacific or Atlantic. Back when the “catastrophic” melting began there were a couple of “peer” reviewed journal articles that fairly well documented that the ice began this period of melting due to warmer water inflows from the North Pacific. (associated with PDO??) As I understood it that set up a loop. More warmer water meant more melt and exposed sea surface. Then even after the warmer water began to retreat the ice would continue to melt do to the amount of exposed sea surface. The authors speculated that there was some mechanism that would ultimate reverse the ice melt or it could be just a given amount of time after warmer water stopped flowing into the Arctic Ocean.
It’s the PDO and AMO. Arctic sea ice is cyclical, although general global climate plays a role, too.
But since the mid-19th century global climate has been in a warming cycle, so the current 35-year waxing and waning is liable to continue at least until the next LIA cooling.
I think that surface wind flows are of importance to understanding sea ice changes, along with temp changes on both sides of the Arctic/oceans connection. Greenland temps, for example, starting dropping at the end of the second week of August. That was partly due to shifting wind patterns south of Greenland. As a result of those wind changes the Greenland SMB has once again soared as the melt ended on August 15th, early as I had forecast back in late June of this year that there was a strong probability that the melt would end early from other indicators which I view daily. In this case I noted a cold footprint which set in early around late June in upper central Siberia. …https://earth.nullschool.net/#current/wind/surface/level/overlay=temp/orthographic=-274.15,57.51,581/loc=94.643,62.883
This new Siberian cold spot sits around 30 degrees of longitude closer to Europe than in the past 4 years of my observing. Which leads me to wonder if that means that this upcoming winter’s cold front will extend an equal distance or greater to the ever increasing deep cold spells which have struck that region of the world in the last 3 winters. Last winter the edge of -10F or lower reached eastern Poland. A shift of 30 degrees further west would bring minus temps into France. The changes in the Greenland SMB over the last 3 winters are another clue to the ongoing climate shift, imo, which I see see as a probable herald to a moderate cold spell setting in around the NH. …http://www.dmi.dk/en/groenland/maalinger/greenland-ice-sheet-surface-mass-budget/
I am pretty sure from some solidly based past papers that the change in any one year is dictated primarily by winds and currents. Sorry I don’t have references. Might even have come from NASA/NOAA. That means that trying to predict using past years’ numbers is a useless way of predicting this year’s number.
And just by the time they figured it out the Arctic ice will be returning. By 2030 its extent will be like back in the 1970s. Which makes prediction of its extent extremely easy and reliable.
Of what we can be sure however is that having now four instead of three, as a century ago, molecules of CO2 per 10,000 dry air molecules has no detectable effect on Arctic sea ice extent.
CO2 was rising during the high ice decades of the ’50s, ’60s and ’70s, and has continued rising since 2012, as the ice has recovered from its record low that year.
By the same token, Antarctic sea ice grew alarmingly from 1979 to 2014 during steadily rising CO2. Then came the 2015-16 Super El Nino, which, along with other weather events, led to lowered SH sea ice.
Ocean oscillations control sea ice. CO2, not so much. As in, not at all.
Mixed emotions about the science because the duplication of effort suggests overall too expensive and wasteful. NSIDC is in Colorado under NOAA, not NASA. It is the lead repository for all NASA satellite cryosphere data. And responsible for NOAA sea ice research. Why are NASA scientists working on duplicative Arctic sea ice models that are the primary responsibility of NSIDC? In my corporate world this would never be allowed.
Hi Rud
” based on a statistical model”
Could it be that Gavin Schmidt a climatologist, climate modeler (applied mathematics) is the Director of the NASA Goddard Institute for Space Studies – GISS (New York division only?)
you mean the person hand-picked by DR Doom to carry-on his ‘good work ‘
Don’t you see? The whole effort has required someone (Schmidt) who was willing to make and repeat such pronouncements as “Hottest year/month ever recorded…” and to run a blog supporting CAGW that disallows any dissenting viewpoint, whatsoever.
Gavin Schmidt is just such a man.
He’s a computer programmer, not a climatologist.
Gloateus: And apparently not too good at either.
The public has more respect for NASA than NOAA. That NASA scientists believe in “climate change” is right up there with the Big Lie of 97% as a substitute for thought and research.
Except of course for the fact that 49 NASA retirees signed a letter in 2012 objecting to the politicization of the agency in the cause of CACA.
It should be NOAA’s job. Pretty soon NOAA will be launching noaanaughts to Mars.
Arctic sea ice conditions HAVE been improving since the extreme levels of the late 1970’s.
Unfortunately, the recovery back downwards to more normal Holocene levels seems to have stalled.
There would be huge benefits for fishing, commerce, travel etc etc from having less sea ice
Biodata shows that current levels are much higher than for most of the Holocene.
And that is the main problem for the people living up there..
There is TOO MUCH DARN SEA ICE.
I mean , look at the massive effort that the Russians have put in to try to make the region navigable for even a few month. These new ice-breaking oil tankers. Nuclear powered icebreakers that can actually melt the ice around them.
What difference does it make, anyway?
+10
Lower sea ice levels would be a massive benefit… that’s what difference it would make.
More specific question:
What difference does it make if an annualized prediction accuracy is improved from -/+ 15% to +/- 3% ?
John Bell
It means that you start to understand the mechanisms that control sea ice area and thickness. Once established it will be another nail in the practice of using CO2 as a cause for all things that change from how they used to be.
Again, what we should be asking is
“What SHOULD the level of Arctic sea ice be” ? give reasons for your answer.
Depends on whether or not some yutz is trying to sail to the Pole. If so, there should be just enuf ice to trap him (and his 3 co-captains) 500 miles away from his stated goal and hold him ’till rescue.
Otherwise it should be whatever Griff seys it be.
it’s all about the Money Money Money …. don’t worry bout the price tag …..
The arctic is screaming!. Oops. Mark Serreze, head of NSIDC, already said that.
Quick, grant money before it melts. Seth Borenstein @AP told us in 2007 that ‘climate prophet’ James Hansen says it’s gonna melt before 2019, so we have only one season to go before there is no ice to research. 🙂
“The challenge of making summer sea ice forecasts allows scientists to test their understanding of the processes that control seasonal sea ice growth and retreat , and to fine-tune computer models that represent connections among the ice, atmosphere and ocean.”
Based on so many forecasts that the ice would be gone by now I would have to say that their understanding of the processes is near nil and their computer models need more than a fine tuning. How many Wadhams are there up there now?
Lets us have a guess the ‘models ‘ will forecast things getting worse , which by ‘lucky chance’ is a good match for those using them . Now where is my PHd and fat research grant ?
Arctic ice melts from the bottom up and freezes from the top down.
Indicate Gloateus’ highs & lows of Arctic sea ice on approximation of net effect on avg global temperature of SST oscillations, Fig 4 in http://globalclimatedrivers2.blogspot.com . When SST is up, Arctic sea ice is down. Time between low and high on Fig 4 is 32 yr vs 35 yr for measured ice. It will be interesting to see what NASA predicts.
Really? Actual scientists asking for “gut feelings” for summer sea ice predictions?
Why not just ask a gypsy as she peers into a crystal ball?
WUWT used to put in a blog commenters estimates and they were among the best.
Clearly their agenda isn’t science, though they pretend that it is. Arctic sea ice is the last bastion of Alarmist pseudoscience.
Re alarmist pseudoscience cue the griffster 😉
“It seems that the ice that remains in the late summer is a function of how thick the ice was to begin with,”
Oh sweet frikkin jebus!!
he said this, I cant believe he actually said remaining ice depends on how much you started with.
rant seeking losers.
USGS admit openly they know frikkin next to nothing about arctic tides and currents.
*rent
Your original also works
AND, he didn’t even start with the initial condition!!
He said he started with a bunch of other variables and got an output that was higher than reality. So then, AFTER introducing the initial condition as a part of the model, they gots a gooder answer.
(I need to know how much fuel I need to drive to Vancouver BC (850 miles) this weekend. I am going to base it on the mileage that I got last time I traveled eastery to Great Falls, Montana. My odometer read 153,002 when I got to Great Falls, and I used 52.537 gallons of gas to get there; how do I model & project my Vancouver fuel needs?)
“The hope is that the models can outrun the changes in the Arctic, that we’ll be able to catch up and produce more reliable forecasts.”
What the heck does that gobble-de-goop mean? Buehler? Anyone?
they have no idea what they are doing, the fact they cant agree on methods or predictions makes that clear
Good observation. They are being paid to play.
NASA-Goddard Space Flight Center should focus on ‘Space Flight’ and leave earthly sea ice measuring and modeling to NOAA-NSIDC. This is yet another example of Waste, Fraud, and Abuse within the the US government agencies. The funding for this activity at NASA-Goddard should be stripped and the associated employees reassigned or laid off. The manager(s) responsible should be fired.
I’ll give them a slight clue:
CYCLES