There are now 2 UPDATES at the end of the post.
# # #
Guest Post by Bob Tisdale
This post presents a very simple way to illustrate the tempering effect of the oceans on global warming. The idea for this simple presentation came from the response of the reality-impaired wing of the catastrophic human-induced climate change movement to the deep-ocean-warming portion of yesterday’s blog post On The Blog Post “Hiatuses in the rise of temperature” at ClimateLabBook. The cross post at WattsUpWithThat is here, and an archived edition of the response from Miriam O’Brien (a.k.a. Sou) at HotWhopper is here.
It is often said that more than 90% of the heat caused by manmade greenhouse gases is absorbed by the oceans. But as skeptics often note, the absorbed heat has little impact on the temperatures of the oceans to depth, and that’s because of the seemingly limitless capacity of the oceans to store heat.
INTRODUCTION
More than 3000 ARGO floats were distributed around the global oceans in the early 2000s to the measure temperature and salinity in all ocean basins for the depths of 0-2000 meters, about 1.25 miles…from the Southern Ocean surrounding Antarctica to the Arctic Ocean. From that ARGO-based data and other measurements, the National Oceanographic Data Center (NODC) now determines and provides data for the annual change in the heat stored by the oceans, starting in 2005. Ocean heat content data from the NODC for the depths of 0-2000 meters are presented in terms of Joules*10^22 (here), and the NODC provides the vertically average temperature anomaly data (here) from which the heat content is calculated (along with the salinity data). The temperature data are presented in terms many people are familiar with, degrees C.
The units used to present the ocean heat content (Joules times 10 to the 22nd power) look like an astronomically large number. Feel free to add 22 zeroes in your mind to the following graphs. And since few people have any idea what those units mean, we helpful people try to present them in more-familiar terms (deg C) as well.
The reality-impaired wing of the catastrophic human-induced climate change movement doesn’t like it when we present data in familiar terms. They claim silly things like we don’t want our readers to know data indicate the oceans are absorbing heat. Again, see the archived version of the post here. What’s really strange about that is, if you were to do a Google Image search of “NODC ocean heat content” the vast majority of the images presented by Google are those I prepared for my blog posts and the posts at WattsUpWithThat. In Figure 1, I’ve highlighted all of the illustrations I prepared or that were prepared by others and included in my posts that show up on a screen cap.

Figure 1
To me, it doesn’t look like I’m trying to hide the fact the oceans have absorbed heat. In fact, I’ve explained, using data, the naturally occurring processes that cause the oceans to warm at the surface and at depth. See the free illustrated essay “The Manmade Global Warming Challenge” (42MB).
THE SIMPLE PRESENTATIONS OF THE TEMPERING EFFECT OF THE OCEANS ON GLOBAL WARMING
Well, I came up with a very simple way to keep alarmists AND skeptics happy. I’ve presented the NODC ocean heat content data in terms of Joules*10^22 and the NODC vertically averaged temperature data in terms of deg C—ready for this?—on the same graph. See Figure 2. In it, the data have been zeroed at 2005.

Figure 2
The caption for it and Figure 3 reads, A hypothetical energy imbalance resulting from the emissions of manmade greenhouse gases has caused the oceans to absorb heat from 2005 to 2013 at a rate of about 8.6*10^22 Joules/decade, according to the NODC data for the depths of 0 to 2000 meters, but due to the heat capacity of the oceans, the oceans for those same depths have only warmed at a rate of about 0.03 deg C/decade, also according to NODC data.
For those who would prefer the NODC data to not be zeroed at 2005, see Figure 3.

Figure 3
Again, the warming rate illustrated in Figure 2 and 3 is only +0.03 deg C/decade. Let me repeat a portion of yesterday’s post:
That’s read 3 one-hundredths of a deg C per decade, which is a very tiny warming rate. It would be even tinier if we had data for the oceans from the surface to the ocean floor.
The oceans are deeper than the 2000 meters reached by the ARGO floats. So we have to look elsewhere to see if the deep oceans below 2000 meters have warmed. The title of Llovel et al. (2014) explains the findings of the paper Deep-ocean contribution to sea level and energy budget not detectable over the past decade. “Not detectable” says it all. Phrased differently, there has been no detectable warming of the deep ocean (below 2000 meters) from January 2005 to December 2013, the time period covered by Llovel et al. (2014), which happily coincides to the period we’re discussing.
From the NOAA OceanToday webpage Deep ARGO, we learn that the depths of 0-2000 meters include only about one-half of the volume of the global oceans.
Based on those findings, we can assume the trend in the temperature of the oceans, from surface to ocean floor, from 2005 to present, is one-half the +0.03 deg C/decade trend calculated for the depths of 0-2000 meters, or a warming rate of +0.015 deg C/decade. That’s read 15 one-thousandths of a deg C per decade.
That minuscule warming rate of the oceans serves only as the background for the surface warming. It can’t magically come back to haunt us.
CLOSING
I want thank Miriam O’Brien (Sou) from HotWhopper. Without her nonsensical response, I would not have come up with the idea for this post. Now, in the not-too-distant future, every time someone performs a Google Image search of “Tempering Effect of the Oceans on Global Warming”, or some derivative thereof, they’ll see Figures 2 and 3 from this post…and read the all-important caption.
(Sarc on.) I’d like to also thank the always-helpful William Connolley of Wikipedia fame and the blog Stoat for trying to post my full name and address on that thread at HotWhopper. A special thanks to Mariam O’Brian for leaving the U.S. Copyright Office website address for my book Who Turned on the Heat? (On sale for only U.S.$5.00.) Now global warming skeptics from all around the world can easily find my name, address, phone number and email address. When they’re in the neighborhood, they can take me out for a cup of coffee*. Or those who have always wanted to tip me for my work, but didn’t want to use PayPal, can now send me checks by mail. How convenient! (Sarc off.)
*PS: Please call first.
*PPS: Skeptics can also use my new-found home address to send me Christmas cards
# # #
UPDATE: The following is a screen cap of a Google Image search (from the morning of December 1, 2014, a day after this post was originally published): The Tempering Effect of the Oceans on Global Warming

That didn’t take long. Never does. As I wrote above… every time someone performs a Google Image search of “Tempering Effect of the Oceans on Global Warming”, or some derivative thereof, they’ll see Figures 2 and 3 from this post…and read the all-important caption.
Once again, thank you, Sou (Miriam O’Brien). Someday Miriam will figure out she’s helping skeptics, not hurting them. Will that stop her rants? I think not. It will simply make her madder.
UPDATE 2: Believe it or not, this is one of the posts that Sou (Miriam O’Brien) has chosen to comment on at HotWhopper. See my post Miriam O’Brien says: Warmer oceans matter. It includes an archived version of her painfully flawed rebuttal. Miriam has also given me another idea for a post on ocean warming.
I have a point of confusion here. I hope people can help out. I took graph 3, the not zeroed one, and extrapolated the heat content line back to 0 on the Y axis. The graph hits 0 at the year 1993, so at that point the oceans had a heat content of 0.0. The temperature line back to 1993 gives a temperature of -0.043 deg. This obviously makes no physical sense, so the “Joules*10^22” is still being scaled to something? Thanks for any clarification. It is an important point, because the way the data gets presented, it looks like the the ocean’s heat content, and by extension, it’s temperature is doubling every 12 (or so) years.
Hi TonyL, the ocean heat content data are in fact anomalies, but the NODC argues against using the term anomaly, saying its redundant. See Levitus et al. (2012)…first page, top of the right-hand coluimn:
http://data.nodc.noaa.gov/woa/PUBLICATIONS/grlheat12.pdf
“It is often said that more than 90% of the heat caused by manmade greenhouse gases is absorbed by the oceans. ” The ratio of ocean heat content to atmosphere heat content is more like 1000 to 1 than 9 to 1. How do we know the ocean won’t adsorb 99% of he heat caused by manmade greenhouse gases?
First someone has to explain how the deep oceans absorb any percent. It doesn’t of course, the oceans warm the atmosphere not the other way around.
If it’s going into the Oceans then AGW is not a danger. The world can take it.
But why would the missing heat be going into the Oceans? It wasn’t – supposedly – in the latter part of the 20th Century. What changed?
What has changed is the weather.
In the beginning of the CAGW scare, CO2 killed frogs, spread malaria, increased droughts, created refugees, increased sea level etc. ad nauseum.
In the beginning I don’t recall any mention of CAGW causing bad winters or arctic vortices or temperature hiatuses but, sure enough, these things happened. I’m sure surprising many warmistas.
Now we see them scramble to blame “No warming” on CO2.
Chasing heat around the depths of the seas is the newest tack in obfuscation.
The CAGW theory is dead.
And if its not there no there’s no danger either!
RobRoy says: “Now we see them scramble to blame ‘No warming’ on CO2.”
You forgot cooling, too.
Bob, and or others. Can some one please tell me where I find one of these heat content measuring devices? Last time I studied heat, we called them “thermometers”. Has something changed?
The Challenger Deep at the southern end of the Marianas Trench lies lower than 36,000 feet down. From Wiki:
“At the bottom of the trench the water column above exerts a pressure of 1,086 bars (15,750 psi), over 1000 times the standard atmospheric pressure at sea level. At this pressure the density of water is increased by 4.96%, making 95 litres of water under the pressure of the Challenger Deep contain the same mass as 100 litres at the surface. The temperature at the bottom is 1 to 4 °C. The trench is not the part of the seafloor closest to the center of the Earth.”
Today the sea surface temperature at Guam is 29.4°C. Lots of cold water down there to absorb whatever scant back radiation might be emitted from an extra CO2 molecule out of 10,000 dry air molecules above the western tropical Pacific. Given the amount of H2O in the air, that hypothetical minuscule increase in radiation probably doesn’t occur to any appreciable extent anyway.
milodonharlani,
Couple of problems with this. I’ll start with what isn’t a problem. Given water’s short lifetime in the atmosphere and it not being well-mixed, estimating its global percentage of the atmosphere is notoriously difficult. The canonical value is 5,000 ppmv. CO2 at 400 ppmv means there is 12.5 times more water vapor than CO2 in the atmosphere. 5,400 ppmv / 1000 = 5.4% of the atmosphere, or if you like 540 / 10,000 molecules in the atmosphere — and 40 of those 10,000 being CO2. So your “one extra CO2 molecule out of 10,000 dry air molecules” is correct — generous even as you’ve awarded CO2 0.2 of a molecule extra.
Now for the first problem: the balance of the dry atmosphere is mostly composed of diatomic molecules which, by virtue of their symmetric vibrational modes, don’t appreciably absorb/emit in the IR spectrum. So the 0th approximation you’re going for here is that 8% of the greenhouse effect is up to CO2 and 92% is due to water vapor. Right?
Well, no and that’s actually a second problem. Did I mention water vapor is not well-mixed? Where water isn’t in the atmospheric column above the surface, CO2 is. Only now the water molecules aren’t masking a generous portion of CO2’s absorption spectrum, so the CO2 has a greater relative effect in dry conditions. How much? Hold that question because there’s more. Most of the water that evaporates eventually precipitates out in relatively short order (esp. compared to CO2), which generally means being part of a cloud. Clouds are far better emitters than water vapor alone. But … clouds also reflect downwelling solar radiation back out into space. Zillions of other dynamics here to consider as well.
In short, simple ratio calculations aren’t going to cut it.
The only thing for it is to do a lot of theoretical work from first principles — yes, with the help of models because there aren’t enough napkins in the world for the math involved — and then go out and check the resulting hypotheses against observation. Andy Lacis and Kevin Trenberth + friends put together a very readable paper in 2013 which breaks it down for us: http://www.tellusb.net/index.php/tellusb/article/view/19734/html Scrolling down about 1/8 of the page, they kindly break down the results of their work. The most relevant figures are the two rightmost columns of the following table:
Table 2. Single-addition and single-subtraction normalised LW greenhouse flux attribution (after Lacis et al., 2010)LW absorber W m−2 Fraction
H2O 74.70 49.0%
Cloud 37.30 24.4%
CO2 31.00 20.3%
So we’ve gone from 8% of GHGs by volume — which is nothing to sneeze at — to 20% by net global effect. Water in vapor and cloud form combine for 75% of the total GH effect, which by the way according to this paper, sums up to 152.6 W/m^2. Which is a whopping great amount of energy, and it’s quite fortunate that we’ve got CO2’s contribution. If I understand the middle (single subtraction) column of Table 2 correctly, pulling out CO2 completely would lose us 24 W/m^2 of our greenhouse. Multiply that by the canonical rule-of-thumb value of 0.8 K/W*m^-2 = 19.2 K lower temperature at the surface. Brrr.
Not bad for 0.8 molecules / 10,000 in the dry atmosphere. Why shouldn’t we like a molecule that we’ve grown used to having around to keep us warm? All the fuss is, of course, about the 108 ppmv CO2 we’ve added since 1880. (Or sometimes the 122 ppmv since 1750). Another rule of thumb calculation is 5.35*ln(CO2 doubling) gives the change in radiative forcing for a given increase (or decrease) of CO2. So 5.35*ln(1-398/291) = 1.7 W/m^2. By coincidence, factoring in all the other positive and negative forcings from here: http://data.giss.nasa.gov/modelforce/Fe.1880-2011.txt and the net change since 1880 is also 1.7 W/m^2.
Which still is a whopping great amount of energy. There are various calculations out there for comparison; mine works out to that being 60 times the flux generated by human industrial activity. If you like Watt hours, it’s 7.774E18 Wh due to increased radiative forcing, vs. 1.317E17 Wh consumed by humans per year.
Apropos the Joules / OHC conversation, it’s 2.799E22 J/year increased forcing, vs. 4.74E20 J/year human energy consumption.
If you’d rather see those figures in terms of the estimated energy imbalance at TOA (0.43 +/- 0.15 W/m^2) multiply the above by 0.2471. About now I’m a bit weary of math, so I’ll leave 0.2471 * 2.799E22 J/year against OHC heat content change for someone else to look at.
Here’s the deal. Over most of the planet, H2O swamps out CO2. The global average is around 30,000 ppm, not 5000. It’s over 40,000 in the moist tropics, but drops to a level comparable to CO2 in the cold polar desert regions, which is where CO2 can have an effect.
But here’s the rub. In those regions, the GHE occurs mainly at night and in the long winters, when it makes little to no difference. If Barrow, Alaska’s average winter (night) temperature is, say, -26 degrees C, then adding one degree from a doubling of CO2 (which of course hasn’t happened yet & well might not do so over the next century), raises this only to -25 degrees.
Allowing for CO2’s higher radiative effect doesn’t compensate for its bands already being swamped by H2O over most of the planet, where it might matter.
The upshot is that adding about one CO2 molecule per 10,000 dry air molecules since AD 1750 has so far had no detectable effect, especially since the global average of H20 is two orders of magnitude higher. Will adding two more (to make six) CO2 molecules be measurable? Maybe, but it will also be negligible, restricted in effect & geographical range.
So for a first order approximation, just taking straight percentage of GHG molecules in the air is close enough for government work. There is no basis for concern, let alone alarm, over the so far beneficial increase in CO2 & none even for two more molecules per 10,000, should that ever happen, which is unlikely.
milodonharlani,
Aargh, blockquote tag fail …
Bob, Please can you add the word “ANOMALY” to “Ocean Heat Content” at the top of Figures 2 and 3.
The Ocean Heat content was not zero in 2005 😉
AndyG55, the NODC argues against using the term anomaly, basically saying its redundant. See Levitus et al. (2012):
http://data.nodc.noaa.gov/woa/PUBLICATIONS/grlheat12.pdf
Really what they are giving is the CHANGE in the OHC relative to a particular starting point.
It should be stated as such on graphs (maybe anomaly is not the correct word)
btw, what is the total heat content in the oceans? It certainly wasn’t zero in 2005. !!
As more than one of my calculus professors were delighted to do when skipping multiple steps in a proof, I would comment that with a globe covered with 70% water the fact that the oceans have a substantial and moderating effect upon climate should be intuitively obvious. And I use “moderating” in the absolute sense, not to be understood as causing a moderate climate, but that the effects of oceans substantially change the effects of all other variables effecting climate. And there are many, most of which have not been quantified, particularly their complex interactions.
Good post Bob Tisdale.
The Cult of Calamitous Climate seems to deny the obvious, that our planet is 70% covered by water.
I guess one deprogramming technique would be to force the believer to share a room with a large tank of water, no amount of fiddling with the thermostat will provide the instant gratification we desire.
I have noticed a trend of late an increasing use of weaselling phrases and a twisting away from the consensus standard, the land surface temperature record is apparently no longer a reliable prop for the cause.
Katastrophic Klimate Kult?
Yes, indeed. Heating the swimming pool room is hopeless and heating the swimming pool requires a lot of energy.
Dead on
Cult of Calamitous Climate — got to love it.
Eugene WR Gallun
CCC is not KKK.
The original reference was meant to… Sigh, the internet is a slough of despond.
The CACA Cult.
{Catastrophic Anthropogenic Climate Alarmism Cult}
Oops–sorry for using brackets.
Great work Bob, and very interesting to read. However I think that our ability to read ocean temperatures is a lot less than 0.03 degrees C./decade at present and the error and noise is larger than the result. Also the fact that the oceans are sucking up heat, only really shows that there have been less clouds recently (since the 1980s) and has absolutely nothing to do with poor old CO2.
i have a question.
It seems to me that the oceans did not magically start absorbing heat when CO2 rose a few years back. The oceans must have been absorbing heat before CO2 rose. Even if we grant that there has been a rise in surface temperature of a couple degrees with the rise in CO2 — that rise in temperature is very small compared to the previous surface temperature. (Starting surface temp. +_extra CO2 heat of a couple of degrees is still almost the same as the starting surface temperature.)
Therefore most of the heat absorbtion occurring now was occurring before the rise in CO2. So if you measure the heat rise of the oceans now — it must be rising at almost exactly the same rate as it was before the rise in CO2 and the extra heat that CO2 has supposedly generated.
So it seems to me whatever rise is being measured in ocean temperature is “natural” and is a function of the surface temperature and has been occurring for thousands of years — with the new extra CO2 heat adding practically nothing to that rise.
You seem to be attributing all the rise in ocean temperature (as small as it may be) to CO2 heat. But really on a tiny tiny percentage of that tiny tiny rise could possible be caused by CO2 heat.
My question? What am I missing? I drank more Wild Turkey for Thanksgiving than I ate of turkey and seem to have suffered extensive brain damage. So is my idea a turkey that can’t fly???
Eugene WR Gallun
Eugene,
For your conclusions to be sound, you’d have to have (at a bare minimum) a pretty good handle on where the energy was coming from and going, how much CO2 was in the atmosphere, when those changes happened, at what rates, and why. Which brings me to …
… from what source have you determined the trends in ocean and surface temperatures over the past thousand years?
So are you saying that the oceans just started absorbing heat when the pause began? That before the pause the heat absorption and heat loss of the oceans were in perfect balance?
And so before the pause, even though air temperatures were rising, the oceans were not absorbing heat? Then suddenly when air temperatures reached a certain level Mother Nature waved her hand and the oceans began absorbing heat like a son-of-burp? And thus we have the pause?
My common sense says that seems unlikely.
I think about this and say either the oceans absorb a truly tiny tiny amount of heat (or no heat at all) or the oceans have been absorbing heat for millions (sorry about that thousands written above) of years.
So if you want a factor affecting climate over millions of years i announce the continual warming of the oceans. So have the oceans been warming over millions of years? Damned if i know. I am the theorist and leave the petty details (like data) to others. (We theorists don’t need no stinkin’ data.}
For the oceans to be warming long term they would have to absorb more heat then they emit — but as they continued to warm, still the heat they were emitting would also rise ( a warming ocean emits more heat but what it emts, of course, never exceeds what it absorbs.
So anyway, to get back to my original post if the oceans are continually warming you have subtract the amount of “natural” warming from the warming shown by recent collected data.
if the deep oceans have been warming over millions of years that warming would have to be very very small. You would be surprised how big numbers get when you start to multiple them by many millions.
Is this too looney for WUWT. Should i try posting on Real Clear Science.
Eugene WR Gallun
I still have not recovered from the Wild Turkey.
.
Eugene,
The oceans warm by insolation. CO2, GHE, IR, none of these contribute heat to the ocean. There is a small, indeterminable amount of geothermal heat contributed to the oceans but nothing from the atmosphere.
This is what Tisdale neglects to make clear. Here is the truth: IR does not, cannot warm water.
The keerap about CO2 and missing heat is just more bogus science from the evermore desperate AGW crowd.
Your common sense serves you well, but the global warmers have little of that.
mpainter
“The oceans warm by insolation. CO2, GHE, IR, none of these contribute heat to the ocean. There is a small, indeterminable amount of geothermal heat contributed to the oceans but nothing from the atmosphere.
This is what Tisdale neglects to make clear. Here is the truth: IR does not, cannot warm water.”
and
“For absorbency of water with respect to IR, it is measured as less than ten microns.”
Surely a discrepancy here?
If the water absorbs the IR it must heat up, if it heats up some might be lost by evaporation but some heat will conduct to the water below.
It is part of insolation, you know?
Thanks, Bob, for putting things in perspective and context.
Figure 3 and its caption are excellent!
Well it is just as well the heat is hiding in the oceans. I remember reading that the top 3 metres of the ocean has as much heat capacity as the whole of the atmosphere. So if enough heat is accumulating that the top 2000 metres is raised by 0.03C/decade, just think what would have occurred if all that heat had ended up in the atmosphere – better hope we don’t get any 1998 style El Nino’s soon.
jimmi_the_dalek, no need to worry. All of the extra heat is hiding in the South Atlantic and Indian Oceans, not in the Pacific (or North Atlantic, for that matter):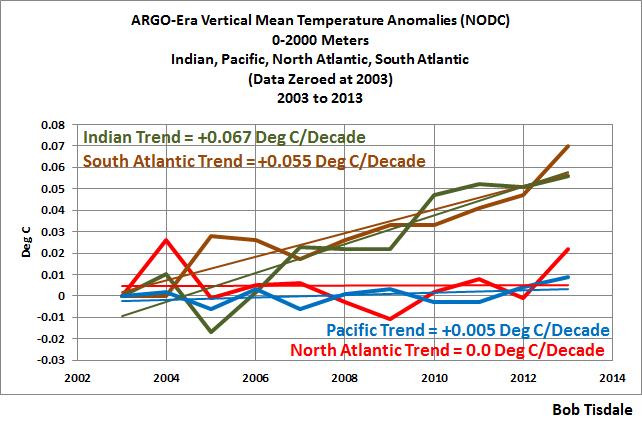
That graph is from the following post:
https://bobtisdale.wordpress.com/2014/10/23/finally-some-reality-from-realclimate-but-unfortunately-they-remained-unreal-about-some-things/
The density of ARGO floats in the South Atlantic is lower, particularly around and south of where most of the UK floats are. The southern Indian Ocean has a lower density of floats too. So maybe an issue here is missing some of the cold: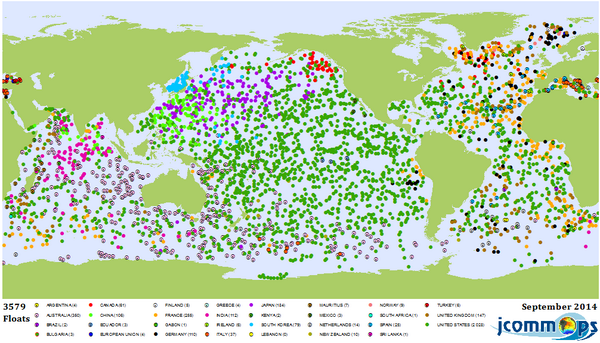 :large
Looking at the CO2 graph on the CO2 page at WUWT, on the 160K timescale the track is very spiky and seems to generally track global temperatures. We are in a spike at present but the Ocean temperatures are not changing! From my personal experience of fizzy beverages I would expect more CO2 in the headspace when the liquid is warmer, however CO2 concentration in the air is increasing, but temperature in the ocean is not.
Also there was a spike during the last interglacial and that could not have been caused by man.
Anyone know what causes these spikes? In any event there looks to be an efficient negative feedback process in place, not that higher CO2 levels appear to be a problem.
Thanks for this, Bob. I have always been suspicious of the ocean energy content thing because it was not reflected in sea level change. This is much better.
A simple analysis at “agwunveiled” identifies two factors that explain average global temperature change since before 1900, including the flat of the last decade or so, with 95% correlation. It also posits a mechanism for why CO2 change has no significant effect on climate.
I have real trouble accepting the accuracy of the ARGO data–see adjustments
http://earthobservatory.nasa.gov/Features/OceanCooling/
The ocean heat content absorption is actually a small number. It is again about half of what was originally expected.
It is equivalent to 0.55 W/m2/year which is far less than the human-made forcing of 2.3 W/m2/year and the feedbacks which should be on-top of that of 1.7 W/m2/year. In other words, the energy is escaping almost as fast as CO2 is supposed to be slowing it down.
Slightly rising temperatures and slightly rising ocean heat content is not what the 3.0C per doubling of CO2 theory predicts.
0.8 10^22 joules/year can also be compared to the annual solar radiation budget which is 386.4 10^22 joules/year.
The oceans are warming at a rate of 1 billion Hiroshima bombs per decade, not 0.003°C per year.
You are quite wrong.
The oceans are warming at the rate of 6.03 x 10^23 barbecued chickens per annum.
Come on M Painter, this is a science site. How much do these chickens weigh? And were they sauced or is it just me?
Robert B, are you doubting the NODC’s data or the Hiroshima bombs/decade figure?
Just pointing out of the preferred units of alarmism, Bob. I forgot the \sarc
Your graph seems to say that OHC increased about 70% in eight years….not sure that’s what you mean.
The figures are in anomalies from some baseline.
Just did a little number crunching. The absolute heat content of the oceans is somewhere around 1.5 10^27 joules in total just using the average temperature of the oceans on average (3.9C). (And also ignoring the energy contained inside the atom structure of the ocean molecules which would be a shockingly monstrous number).
So, if the ocean heat content is rising at 0.8 10^22 / year, that is only 0.0005% of total per year.
Missed the reference to ‘anomalies’ in the OHC data.
Somehow I can’t wrap my brain around joules. How much has the global ocean temperature increased since 1979 in F or C??
For those trying to understand joules.
1 joule is the equivalent of 3,018,412,315,122,250,000 photons from the Sun.
In 1 second at mid-day, the Sun provides about 1000 joules over 1 metre by 1 metre (or 3 10^21 photons).
In 1 year, the Earth gets about 11,663,145,185,632,400,000,000,000,000,000,000,000,000,000 photons from the Sun.
So generally, we are talking about a huge number of photons from the Sun being absorbed in the electrons in the trillions upon trillions of molecules on Earth every second.
These electrons in the trillions upon trillions of molecules emit that energy back to space and back to the atmosphere as Infra-Red (IR) photons. Each 1 joule of IR energy at Earth temperature is equivalent to 15,092,061,575,611,200,000 photons (yes there are more of them). The earth emits, …
…. 58,315,725,928,161,800,000,000,000,000,000,000,000,000,000 IR photons back to space each year.
Are you starting to see the picture here. There is just an untold amount of photons flying through everything and being absorbed by everything and being emitted by everything all the time and every single picosecond. And not just an untold amount, it is a staggering monstrous number hitting you every single second.
How many solar photons are being absorbed into the electrons of the oceanic molecules each year?
– 24,147,298,520,978,000,000,000,000,000,000,000,000,000.00 that is.
Did that help? Probably not. But I dare you to figure out how a doubled CO2 effects any of those numbers. Climate science just faked it.
Bill, are all photons =?
Don Gleason, the NODC argues against using the term anomaly with their OHC data, basically saying its redundant. See Levitus et al. (2012):
http://data.nodc.noaa.gov/woa/PUBLICATIONS/grlheat12.pdf
Just saying the vertical scale makes no sense…
But does it make them right it certainly leaves me somewhat confused, is that the inention
You really loved those Calvin and Hobbes comics, didn’t you Bob? You have that mischievous “Calvin’esque” type slant to this article. I love it. Keep your sense of humor.
TRM, I will admit I enjoyed Calvin and Hobbes, but I way…way preferred Larson’s “The Far Side”.
Cheers.
Two masked burglars, who happen to be cows, check the freezer of the house they’re robbing.
They are aghast at the abject horror within.
Body parts.
While Bob’s post is undoubtedly correct, it is worth noting that the accumulation of energy in the oceans looks to be reasonably consistent with Hansen’s energy imbalance estimate of 0.85 watts/m2.
If we assume all ‘excess’ energy has gone into the oceans since 2005, i.e. the surface/air temperature has remained unchanged and nothing has gone towards melting ice then the 8.64×10^22 Joules per decade equates to an imbalance of ~0.76 watts per m2. That’s based on a quick calculation made after a couple of pints and a brandy so I could be wrong – but I don’t think I’m too far out.
If correct, though, it does suggest that surface warming could pick up quite strongly again in the future.
Hansen’s guess [sorry, estimate] may be incorrect.
There may be no “excess” energy to go into the oceans as it is all hypothetical.
If it follows the current pattern there is no logical reason to expect surface warming to change at all as the hypothetical energy has not caused a rise in 18 years [RSS].
Therefore how could it cause one in the next 18 years.
Wishful thinking is not rational thinking.
If there’s no excess energy going into the ocean, why is ocean heat content increasing? Magic?
Bill2, are you overlooking the fact that the ARGO float data had to be adjusted to show warming? Are you overlooking that there are naturally occurring coupled ocean-atmosphere processes that can cause the oceans to warm to depth? Are you overlooking the fact that, for the depths of 0-2000 meters, only the Indian Ocean and the South Atlantic show warming, and that the absence of warming in the other 2/3rds of the oceans (Pacific and North Atlantic) clearly indicate a problem with the hypothesis of manmade “global” warming?
That graph is from the following post:
https://bobtisdale.wordpress.com/2014/10/23/finally-some-reality-from-realclimate-but-unfortunately-they-remained-unreal-about-some-things/
Bill 2,
[chortle] May as well be since Bob only trusts adjusted data when it suits his argument.
Brandon Gates, I present data that are readily available to the public. No chortle required.
John Finn, the last time I bothered to look and the last time Gavin Schmidt corrected their annual model-data comparisons at RealClimate, the models were way too high.
http://www.realclimate.org/index.php/archives/2012/02/2011-updates-to-model-data-comparisons/
Remember the post where Gavin had to correct his past model-data comparisons because he forgot to account for the fact that the oceans only cover 70% of the planet?
http://www.realclimate.org/index.php/archives/2012/05/ohc-modelobs-comparison-errata/
Gavin stopped extrapolating the models beyond 2005 a that time. They looked bad.
Bob, I’m only commenting on the data presented above using a calculation based on the following:
Energy accumulation = 8.64 x 10^22 Joules per decade
Number of Seconds in a decade = 3.15 x 10^8 seconds
Surface Area of Ocean = 3.61 x 10^14 sq metres
which implies an imbalance of 0.76 watts/m2
But doesn’t that explain why the model-data comparisons were bad?
I recognise we’re dealing with a short time period and its only a rough estimate but I’m a bit surprised to find the ARGO data agrees quite so strongly with Hansen et al estimates.
John Finn, Hansen’s estimate of ocean heat content is in W/m2. It is not the same as the heat content in joules that Bob is noting here.
There are conversion formulae. 1.0 W/m2 equals 1.13 10^22 joules over one year across the whole oceans.
1.0 W/m2 across the whole Earth surface over one year equals 1.62 10^22 joules.
Since the Earth land surface and the atmosphere are accumulating basically 0.0 joules right now, maybe 0.02 10^22 joules going into ice-melt if that is not exaggerated, …
… One can calculate that only 0.5 W/m2 is being absorbed by the Earth each year.
Then there is also a question about how Hansen came up with his 0.85 W/m2 should be there, because his earlier work was much higher than that. He would have had to up his estimate of the increased outgoing long-wave radiation to lower his estimate. That was not shown however.
Quite, So 1.0 w/m2 over a decade = 11.3 x 10^22 per decade. Bob reports an increase of 8.64 x 10^22 Joules per decade and therefore
Energy absorption = 8.64/11.3 = 0.76 w/m2
Exactly as I calculated using a long-winded method.
Not if you use the data presented in Bob’s post you can’t. This is a bit of a concern. I was expecting much lower rates of OHC uptake particularly given the weak solar activity since 2005.
Isn’t heat content approximately proportional to temperature? Therefore, the percentage change in temperature should equal the percentage change in heat content (and the slopes of the two lines should look the same on a percentage change basis). This isn’t strictly true if one considers state-changes (i.e. ice to water), or an increase in volume due to melting glaciers or aquifer depletion. Presumably there IS a difference due to these factors (otherwise why even mention it), but to appreciate the difference we need to see both temperature and heat-content plotted as percentage change, otherwise we are comparing apples and oranges. Does anyone know of a plot comparing percentage difference?
Ian, I haven’t seen one.
Oops. With even a sarcastic suggestion, I’m expecting you to receive enough offers for coffee that your tonsils will be floating in caffeine to 2050.
Doug, my personal info had never been made public before Connolley decided to share it with the folks at HotWhopper…even though it was a matter of public record. Never before had an offer for coffee.
Cheers
So we’re talking 0.3 deg C / century … about 1/10th of the IPCC guessamate
Neo, are you confusing the warming of surface and the subsurface oceans?
Seriously, does anyone honestly think 3000 is a suffiently big number when referring to the number of devices used for measuring the temperature of the Earth’s oceans?
It is a drop in the ocean…
The floats are also adrift and poorly distributed, but better than what came before them.
It will probably never be possible adequately to take the planet’s average temperature from its surface. That would require millions (5.1 million if one per 100 sq km, ie an area a little smaller than San Francisco) of perfectly sited, perfectly functioning thermometers, requiring power sources which would introduce error for which adjustments would not be standard, simple and easy.
In Gavin’s simple faith, data from a surface station 1200 kilometers distant is OK. In that case, only 113 stations would be required, of which the US would merit just two, possibly at sea level in Florida and atop Mt. McKinley, Alaska, with an intermediate station in southern Saskatchewan.
http://www.nasa.gov/topics/earth/features/gavin-schmidt.html
Jeez, I can’t even get a first comment past moderation at hot slopper. Go figure!
gymnosperm, I believe every comment from everyone at HW is moderated and that Sou manually reviews each one before approving. Try back during waking hours in Australia.
Why bother?
I am not an expert, but a large portion of the overall heat of the earth comes from radioactive decay within the earth itself. The conduction of this heat to the earth’s surface is quite dependent upon lave flows beneath the oceans. Seemingly substantial variations in heat flow related to changes in lava flow could have far greater impact upon Ocean temperatures than atmospheric conditions. Has anyone considered this?
douglas cassel,
But of course. In consideration of it we might want to ask some questions:
1) How much a portion of the energy put into the oceans can be explained by heat rising up from the mantle through the crust?
2) How do fluids behave when they’re heated from the bottom up vs. top down?
3) Are undersea volcanoes responsible for the 100k/40k year glaciation cycles?
4) With all that energy coming up from below, why isn’t the day/night temperature more constant?
According to Al Gore it is ‘millions of degrees’ just two kilometres below the surface. So yes it has been considered.
Do I need /sarc?