Guest Post by Bob Tisdale
This is the second in a series of posts about the blog HotWhopper, specifically about the misunderstandings about climate-science basics displayed by its author and proprietor Miriam O’Brien (a.k.a Sou from Bundangawoolarangeera). The first in the series was Open Letter to Miriam O’Brien of HotWhopper (a.k.a. Sou), which was cross posted at WattsUpWithThat here. In this post, we’ll discuss her misunderstandings about a very basic climate metric—one called sea surface temperature.
Keep in mind that Miriam O’Brien’s blog Hot Whopper found a new focus after Miriam, blogging as “Sou”, was permanently banned from WattsUpWithThat for her troll behavior. See Anthony Watts’s post My Blog Spawn. Since her departure from there, Miriam’s new focus has been, of course, the blog posts at WattsUpWithThat. Seemingly, Miriam O’Brien opposes anything and everything presented at WattsUpWithThat.
THE TOPIC OF THIS POST
The paper Kuffner et al. (2014) A Century of Ocean Warming on Florida Keys Coral Reefs: Historic In Situ Observations was getting a good amount of press a month or so ago. See the USGS press release here. For much of the paper, Kuffner et al. focused on two sets of sea surface temperature records for two coral reefs that are part of the Florida Keys. Kuffner et al. used sea surface temperature measurements made by lighthouse keepers back in the late 19th Century to early 20th Century and compared them to the buoy-based samples of sea surface temperatures that started in the late 20th Century. The more-recent buoy-based readings were warmer than the early lighthouse-keeper observations, so Kuffner et al. (2014) concluded (This quote is from their abstract):
Results indicate that the warming observed in the records between 1878 and 2012 can be fully accounted for by the warming observed in recent decades (from 1975 to 2007), documented using in situ thermographs on a mid-shore patch reef. The magnitude of warming revealed here is similar to that found in other SST datasets from the region and to that observed in global mean surface temperature.
As a visual reference, my Figure 1 is Figure 3 from Kuffner et el. 2014.

Figure 1
That paper raised a number of very obvious questions:
- What happened to the sea surface temperatures in that region between the turns of the 20th and 21st Centuries?
- Did they remain flat, increasing slowly until the 1970s, when they skyrocketed? The abstract might lead some people to think that was the case, or,
- Did they cycle, consistent with the variability of the Atlantic Multidecadal Oscillation? or,
- Did they warm early in the 20th Century and cycle since then.
- Long-term data, covering the periods examined by Kuffner et al. and running continuously between them, are available. Kuffner et al. even refer to them in their abstract with, “The magnitude of warming revealed here is similar to that found in other SST datasets from the region…” Why didn’t Kuffner et al. (2014) present that basic background data?
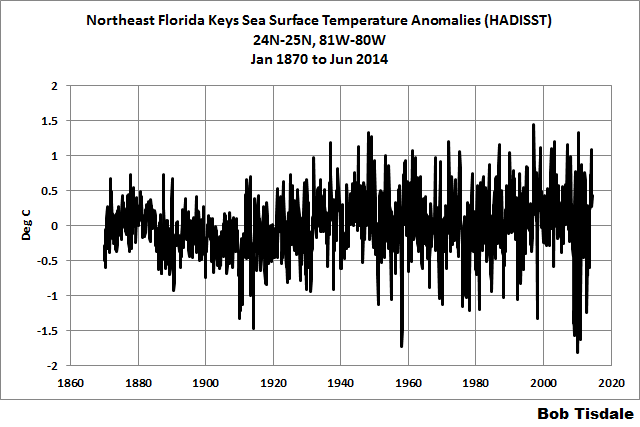
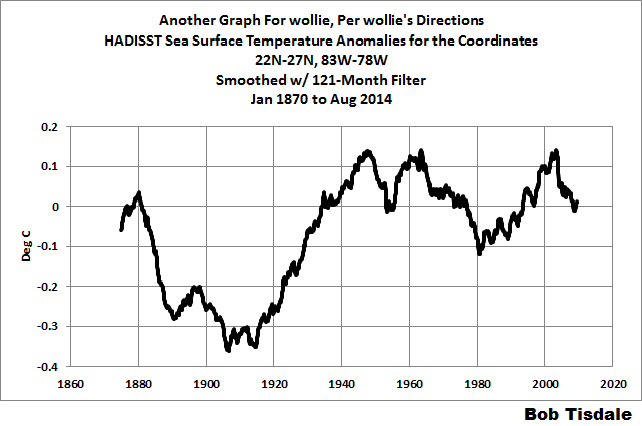
I presented long-term data in my post Data Reveal Florida Keys Sea Surface Temperatures Haven’t Warmed in 80+ Years* to answer those questions. I selected a very small region of the Florida Keys that encompassed the two reefs focused on by Kuffner et al. Using a sea surface temperature dataset with a high resolution (HADISST), I presented the long-term data in raw form here, and then smoothed them with a 121-month filter to highlight the underlying variability. See Figure 2 (which was Figure 3 from my earlier post). The greatest warming in the region took place from around 1910 to the early 1940s, which undermined the claim by Kuffner et al. that “the warming observed in the records between 1878 and 2012 can be fully accounted for by the warming observed in recent decades (from 1975 to 2007)”.

Figure 2
The recent downturn in the data also doesn’t help their cause.
I also examined how far back in time we could go with the long-term sea surface temperature data for that part of the Florida Keys while not showing any warming (based on the linear trend). See Figure 3 (which was Figure 4 from my earlier post). Based on the linear trend, the sea surfaces for that part of the Florida Keys haven’t warmed since 1930, more than 80 years. And as I wrote in my earlier post, Yet, somehow, we’re supposed to believe manmade greenhouse gases are causing harm to the coral in recent years.

Figure 3
Kuffner et al. also set their eyes on August sea surface temperatures, because they are seasonally warmest and would do most harm to the coral reefs. I then presented the August sea surface temperatures for that region, based on the HADISST data. Refer to my Figure 4 (which was Figure 5 from the earlier post). The long-term August data confirmed that coral have had to deal with sea surface temperatures that are said to be “stressful” almost every year, and that sea surface temperatures regularly reached and exceeded levels that are said to be “very stressful” in the 1940s, 50s and 60s…and, if the early data are believable, on occasion, they were above very stressful levels in the late 1800s and early 1900s. In fact, many of the peak August temperatures in the 1940s, 50s and 60s were higher than they have been recently.

Figure 4
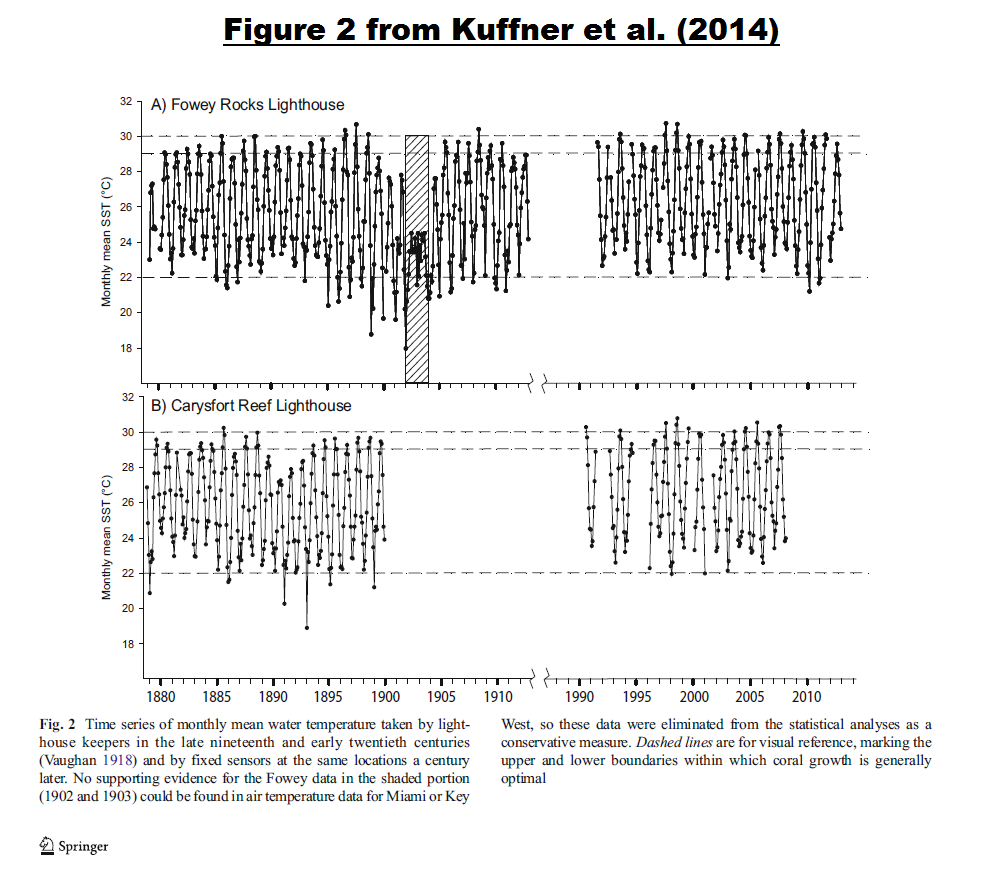
Kuffner et al. show similar excursions into “very stressful” temperatures in the late-19th and early-20th centuries in their Figure 2. They even provided dashed lines to highlight those temperatures, but they failed to point them out. Those “very stressful” temperatures disappeared when Kuffner et al. used multidecadal averages for their Figure 3 (shown above as my Figure 1).
Bottom line, Kuffner et al. referred to local long-term sea surface temperature datasets in their abstract—“The magnitude of warming revealed here is similar to that found in other SST datasets from the region…”—but failed to present that data. The basic reason they did not present it appears to be that it does not support their claim that “the warming observed in the records between 1878 and 2012 can be fully accounted for by the warming observed in recent decades (from 1975 to 2007)”.
For some reason, Miriam O’Brien of HotWhopper was displeased with my post and published Perennially Puzzled Bob Tisdale surfs the surface at Florida Keys. (An archived version is attached to link. My thanks to blogger 7DaBrooklynKnight7 for the archived version.) Her post is quite humorous. I think you’ll enjoy it.
Unsuccessfully, Miriam O’Brien tried a number of different tactics to counter my data presentations, without ever addressing the fact that my data presentations were correct.
Miriam’s Misdirection 1 – Miriam claimed that the region I selected was too large. But, of course, she failed to show that there was any difference between the sea surface temperature data I presented and the sea surface temperature data presented by Kuffner et al.
A blogger called 7DaBrooklynKnight7 noted in a comment:
i checked that knmi website and the average august sst from the fowey rocks and carysfort reef buoys (for 1991 to 2012) is the same (29.9 deg c) as the august sst from the hadisst for the coordinates used by tisdale. please check my work.
That wasn’t well received by Miriam.
I did confirm 7DaBrooklynKnight7’s statement. For the period of 1991 to 2012, the average of the August sea surface temperatures for the Fowey Rocks and Carysfort Reef buoys (29.9 deg C) is the same as HADISST for the coordinates of 24N-25N, 81W-80W that I used in my post. The data for the Fowey Rocks and Carysfort Reef buoys were provided by Kuffner et al. through the webpage here. The Excel spreadsheet with the Carysfort Reef buoys data are here, and the Fowey Rocks data are in the spreadsheet here. And, of course, the HADISST data are available at the KNMI Climate Explorer.
Miriam’s Erroneous Claim 1 – After stating correctly that I had presented “gridded data estimated from combining observations from ships, from buoys, from satellites, with data gaps filled by interpolation”, Miriam then incorrectly claimed that I was “only interested in the temperature of the thin skin of the sea surface”. She repeated that claim of “skin” temperature in the post and in her comments on the thread.
It turns out, the only “thin skin” is Miriam’s, who responded with insults when a blogger point out her errors. More on that later.
HADISST is a sea surface temperature dataset, not a sea skin temperature dataset as Miriam claims. The metric presented by Kuffner et al. (2014) in their Figures 2 and 3 was sea surface temperature—same metric I presented. Miriam is correct that HADISST includes the skin temperature observations from satellites, but she fails to acknowledge:
- that satellite data only extend back in time to the early 1980s,
- that there are also “surface temperature” measurements from buoys and ship inlets in that time, and,
- more importantly, that adjustments have been made to account for satellite biases. The make-up and corrections applied to the HADISST dataset were discussed in the paper Rayner et al. (2003) Global analyses of sea surface temperature, sea ice, and night marine air temperature since the late nineteenth century.
Miriam even provided a link to Rayner et al. at the end of her blog post. She either failed to comprehend the paper or she missed the part of the paper where Rayner et al. state:
We adjusted the satellite SSTs to be unbiased relative to the in situ data (Appendix C).
This was pointed out to Miriam by blogger 7DaBrooklynKnight7:
according to the rayner paper you provided they also adjust the satellite data with data from ship inlets and buoys, like the buoys at the reefs, to take care any biases from the satellites sensing the skin.
That also was not well received by Miriam.
Miriam’s Misdirection 2 – Miriam wrote:
But in this case, because deniers want to pretend that coral bleaching doesn’t happen, the world isn’t warming etc etc, they decide to ignore the careful measurements taken on site over the years. Data that is much more appropriate when considering the actual reef. Deniers decide that this time around they prefer data that’s been “tampered with”. Data from multiple sources, with gaps interpolated.
I never claimed that coral wasn’t stressed by high sea surface temperatures. That’s an outright fabrication. In fact, I presented a graph that showed that sea surface temperatures in that region reached levels that are said to be “stressful” to coral almost each and every year, and that sea surface temperatures regularly reached and exceeded levels that are said to be “very stressful” in 1990s and 2000s….and in the 1940s, 50s and 60s, too. Her post is riddled with off-the-cuff remarks that have no basis in fact. I present data, Miriam fabricates.
Miriam apparently wants to dismiss decades of research into the adjustments required to correct for different methods used for sampling sea surface temperatures. Granted, many persons are concerned about the adjustments, especially when, globally, they suppressed the warming during the late-1930s and early-1940s that existed in the source ICOADS data, which impacts the amount of warming during the early warming period of the 20th Century. See Figure 5, which is Figure 15 from the post Multidecadal Variations and Sea Surface Temperature Reconstructions.

Figure 5
The best part: Miriam obviously forgot that Kuffner et al. presented sea surface temperature data from “multiple sources”. Kuffner et al. presented thermometer readings taken by lighthouse keepers during the late 19th and early 20th centuries, using one technology with biases. And they presented temperature measurements taken from buoys in the late 20th and early 21st centuries.
Miriam’s Misdirection 3 – Miriam wrote (my boldface):
He was only interested in the temperature of the thin skin of the sea surface – averaged over a wide area well beyond the corals the scientists were researching. Yet leaving out some of the area that the researchers did cover.
The long-term sea surface temperature data that I presented was for coordinates that included the two reefs presented in Figures 2 and 3 of Kuffner et al. (Fowey Rocks and Carysfort Reef). The only other temperature data presented by Kuffner et al. in a time-series graph was the sporadic late 20th century subsurface temperatures for the Hen and Chickens Reef. (See their Figure 4.) It wasn’t a long-term sea surface temperature comparison, like those at Fowey Rocks and Carysfort Reef, and was not applicable to my post.
A Few More Comments by A Blogger on the HotWhopper Thread – Blogger 7DaBrooklynKnight7 presented many of the realities I’ve discussed in this post. But he also made a couple of other observations. 7DaBrooklynKnight7 wrote:
one last thing. i also checked that knmi website and they have more sst data. there’s one from noaa that does not use satellites in recent years. the noaa ersstv3b, for the florida keys, the sea surfaces have cooled sinse 1930.
Cooled, he wrote? From a dataset that excludes satellite data? It turns out that the negative trend is so slight that it’s basically flat.
Keep in mind that the minimum grid size of the NOAA ERSST.v3b data is 2-deg latitude by 2-deg longitude. So this is a larger area than what was presented in my first post about Kuffner et al. ERSST.v3b also extends further back in time, and the further back one goes, the less realistic the data become. (The hump that peaks in the 1880s looks suspicious.) With that in mind, Figure 6 presents the sea surface temperature anomalies for the coordinates of 23N-25N, 81W-79W. Also shown is the linear trend for the period of January 1930 to September 2014. A cooling rate of -0.008 deg C/decade is essentially flat. Sorry, 7DaBrooklynKnight7, you got a little carried away with “cooled” since 1930.

Figure 6
But, along with the similarities in the buoy temperatures and the HADISST-based readings discussed above, the ERSST.v3b dataset (which does not use satellite data) do help to dismiss Miriam’s complaints about satellite “skin” temperatures. (NOAA actually removed the satellite data from their ERSST data.)
Blogger 7DaBrooklynKnight7 also asked a very basic question of Miriam:
something else you’ve overlooked. are the data from the lighthouses and from the buoys included in the hadisst data?
Miriam ignored the question.
And that’s a question that I cannot answer with any certainty. The buoy data should be included (key word “should”) in the ICOADS sea surface temperature dataset, which is the source data for the NOAA and UKMO datasets. The lighthouse data might be, key phase “might be”.
Miriam’s Response When Confronted with Data-Based Questions – First Miriam insulted blogger 7DaBrooklynKnight7. Then when he responded to her incivility and exposed more problems with her post, she deleted his comment. The exchanges between Miriam (who poses as blogger “Sou”), 7DaBrooklynKnight7, and the HotWhooper denizens are worth a read. They start with 7DaBrooklynKnight7’s initial question at September 13, 2014 at 1:33 AM. They extend down to his response to her insults at September 15, 2014 at 8:07 PM. (Miriam deleted his final comment, as visible at a direct link to where that comment once existed.) After 7DaBrooklynKnight7 was obviously banned, bloggers continued to insult him at HotWhopper.
Blogger 7DaBrooklynKnight7 then wound up at my blog, alerting me to the exchange at HotWhopper.
Thanks, 7DaBrooklynKnight7. Sorry it took so long for me to respond to Miriam’s post.
CLOSING
I really do enjoy reading Miriam’s posts at HotWhopper. She is willing and able to expose her misunderstandings about the topics she addresses, along with her want and need to misinform her readers. I also enjoy replying to her posts. You can look forward to more of my posts about Miriam O’Brien and her escapades at HotWhopper.
I`m convinced her arguments are a deflection and denial.I showed my `better half` Hot whopper and this thread.
She is convinced Ms O`Brien has the hots for Anthony Watts our esteemed blogmeister.
It`s not scientific debate…it`s stalking 😉
Now that is an interesting conjecture.
tabloid headline: “Hot Whopper Blogress has Hots for well-known Climate Sceptic.”
now if someone would just photoshop her face onto a page Gal….
I’ve speculated on this apparent paradox before. She hangs on his every word, follows his every move, and once posted a photograph showing him “not asking a question at a conference”. Hero-worship in the extreme.
I finally found our host’s personal note. As the parent of an adult with childhood hearing difficulties, I may know some of the relief. Fortunately my daughter turned her difficulty into an advantage in her professional education by using it to eliminate distractions.
As an aging senior, I anticipate the opportunity to ostentatiously turn-off or remove hearing-aids.
Best wishes.
Mr. Tisdale,
You write: “What happened to the sea surface temperatures in that region between the turns of the 20th and 21st Centuries?”
They don’t exist. From the paper, p. 2: “Data exist for 1878 to 1899 for Carysfort Reef and 1879 to 1912 for Fowey Rocks.”
Pp. 3-4: “Hudson and colleagues established four permanent sites for monitoring underwater temperature in the upper Florida Keys (Hudson et al. 1991), including three sites along an on- to offshore transect from Snake Creek tidal channel in Islamorada, FL, to the outer-shelf reef at Crocker Reef. From 1975 to 1990, data (Online Resource 2) were gathered using this method, including regular calibration at intervals of 120 days or less (Hudson et al. 1991). Starting in 1990, Ryan Industries, Inc., thermographs were deployed at those sites and at additional strategic locations along the Florida reef tract.”
You write: “‘The magnitude of warming revealed here is similar to that found in other SST datasets from the region…’ Why didn’t Kuffner et al. (2014) present that basic background data?”
Publication space constraints perhaps? See the first paragraph on page 6, just under Table 1 for the citations.
You write: “The recent downturn in the [HADISST] data also doesn’t help their cause … Yet, somehow, we’re supposed to believe manmade greenhouse gases are causing harm to the coral in recent years.”
Looking at GHCN atmospheric temperature trends for August in an appropriate grid (25-26N, 81-80W) might shed some light: https://drive.google.com/file/d/0B1C2T0pQeiaSTUp4X2VhbkdWTG8
Note the similar slope of the linear trends between the in situ underwater temperature series and the GHCN trends … and that they’re increasing faster than the HADISST curves for the same region. Kind of a classic chicken or egg problem until one ponders how shallow bays and lagoons bounded by coral reefs might respond to climate inputs differently than deeper open ocean.
Your question about how the in situ data tracks to AMO is a good one. Just eyeballing the chart I posted and knowing roughly where the AMO cycles live, I’d say fairly well.
Brandon Gates, in response to my question, “What happened to the sea surface temperatures in that region between the turns of the 20th and 21st Centuries?”, you replied, “They don’t exist…” and then proceeded to quote from the Kuffner et al. paper
Actually, for the region, they do exist. Apparently you missed the word “region” in my statement. I did not say reefs. I said region, which is the same word used by Kuffner et al. in their abstract. And if you had bothered to read my post, you would have found their use of the word region served as the foundation for the question you quoted.
If you’re not aware, with the exception of one month in 1946, there are continuous monthly observations of sea surface temperature in the ICOADS data base for that region of the Florida Keys from about 1905 to present. As a result, the UKMO and NOAA include that region in their HADISST and ERSST.v3b datasets, both of which I presented in this post.
Brandon Gates, additionally, which 5-deg latitude by 5-deg longitude grid are you using for reference GHCN land surface air temperatures? The one that includes all of Florida? Or the one that includes western Cuba? Or did you combine the two? And do really think land surface air temperatures for Florida and/or Cuba are representative of the sea surface temperatures of the grid I presented?
BTW, Brandon, I suspect your GHCN data is for the grid that includes all of Florida. But get back to me when you know for sure. I’m surprised I haven’t seen you commenting during the renewed discussions on that HotWhopper thread:
http://blog.hotwhopper.com/2014/09/perennially-puzzled-bob-tisdale-surfs.html
Brandon Gates wrote, “Note the similar slope of the linear trends between the in situ underwater temperature series…”
What underwater series? You’re mistaken just like your hero Miriam. The data provided by Kuffner et al for the two periods at those two reefs was sea surface temperature data.
You have a good day, Brandon.
Bob,
You write: “I said region, which is the same word used by Kuffner et al. in their abstract. And if you had bothered to read my post, you would have found their use of the word region served as the foundation for the question you quoted.”
I did read your entire post, as well as the entire paper wherein we find on p. 2:
“Caution is advised, however, when attempting to de-
rive local, absolute patterns in SST from regionally and glob-
ally synthesized satellite data products, especially in nearshore
waters typical of coral reef ecosystems. Satellites that measure
the temperature of the ‘skin’ of the ocean are unable to
measure ambient temperature at depth and thus cannot fully
represent the subsurface environs inhabited by reef organisms
(Castillo and Lima 2010). Moreover, coral reefs are exposed
to significant thermal variability across a range of temporal
and spatial scales (Leichter et al. 2006). The shallowness of
nearshore waters makes them responsive to heat exchange
across the air–water interface (Pitts and Smith 1995) and, in
the case of the Florida reefs, to the tidally driven effects of
unusually hot or cold, very shallow (2–3-m deep), inland-bay
waters (Roberts et al. 1982).”
You write: “If you’re not aware, with the exception of one month in 1946, there are continuous monthly observations of sea surface temperature in the ICOADS data base for that region of the Florida Keys from about 1905 to present.”
ICOADS is a gridded product. I don’t see anything per se incorrect with looking at it as a smell test; in fact, good on you for doing so. But corals aren’t sensitive to averaged temperature smeared across a grid, they’re sensitive to temperatures in the local waters in which they live … among many other things also mentioned in the paper. One of the authors’ main points here is that homogenized, gridded SST products probably do not have sufficient spatial resolution for their liking in this particular application.
You write: “I suspect your GHCN data is for the grid that includes all of Florida.”
Nope, the August mean absolute temps for the four individual stations in that 1×1 grid:
StationId Lat Lon Alt StationName
42500087020 25.58 -80.44 3 PERRINE 4W
42572202000 25.82 -80.28 4 MIAMI, FL.
42572202001 25.48 -80.38 5 HOMESTEAD/AFB
42572202003 25.72 -80.28 4 MIAMI/WSO CITY
You write: “What underwater series?”
Back to the paper, pp. 2-3:
“Ironically, it was the recognition of cold water stress as a
major driver of coral mortality and sub-lethal reductions in
coral growth (Hudson et al. 1976) that motivated the initiation
of underwater temperature monitoring in the Florida Keys.
Hudson (1981a) conducted a coral transplantation study in
1975 that included one of the first deployments of underwater
‘temperature loggers.’ These loggers (General Oceanics mod-
el #3011) consisted of 8-mm cameras in housings that were set
to take hourly photographs of a wristwatch and a dial read-out
Fahrenheit thermometer. Hudson and colleagues established
four permanent sites for monitoring underwater temperature in
the upper Florida Keys (Hudson et al. 1991), including three
sites along an on- to offshore transect from Snake Creek tidal
channel in Islamorada, FL, to the outer-shelf reef at Crocker
Reef.”
You write: “I’m surprised I haven’t seen you commenting during the renewed discussions on that HotWhopper thread.”
I had my fun yesterday, different thread. Got some egg on my face … I confused you with Eschenbach. Silly mistake since you always put your name on your graphs.
Brandon Gates, thanks for your reply. I believe you’re missing a few things.
My post illustrated the regional sea surface temperature anomalies for the Northeast Florida Keys, which encompass the Fowey Rocks and Carysfort Reef, using two sea surface temperature datasets, both of which I have acknowledged as having been adjusted. The adjustments were designed to account for the differences in measurement technologies. Unless you can point to specific problems with the datasets, there is nothing wrong with my posts.
Are there biases in the lighthouse keeper and buoy datasets presented by Kuffner et al.? Of course there are.
Maybe if you looked at my posts in a different light it would help. My graphs presented a what-if scenario: If there was continuous supply of sea surface temperature data from the two reefs presented in Figures 2 and 3 of Kuffner et al., and if the sea surface temperature data from those two reefs were corrected for the differences in measurement methods, what would the long-term curve look like? Both the HADISST and ERSST.v3b datasets showed that the primary warming took place in the early 20th century after the lighthouse-keeper data ended, not during the later warming period of the 20th Century.
If you’re not aware of this, that’s consistent with sea surface temperatures of the waters off the east coast of the United States, from Florida to New Jersey. Do you recall my posts after hurricane Sandy?
http://bobtisdale.wordpress.com/2012/11/05/sea-surface-temperature-anomalies-along-sandys-track-havent-warmed-in-70-years/
Good on you for using local GHCN data. But your introduction of GHCN data into the discussion is a distraction from the topic at hand, which is the sea surface temperature of the region that encompasses the two reefs in question. A clear case of misdirection. Do land surface air temperature data represent sea surface temperatures? No. Do land surface temperature data have different biases than sea surface temperature data? Of course they do.
Stay on-topic, please.
Your other use of misdirection (like Miriam) relates to the topic of the “underwater series”. You provided quotes from the study about reefs other than Fowey Rocks and Carysfort Reef. Are you aware that the average depth of Fowey Rocks is 5 feet? Are you aware that the average depth of Carysfort Reef is 5 feet? Are you aware that the two lighthouses in question are built on stilts above those two reefs? Are you aware that sea surface temperature data come from multiple technologies with different depths that range from the satellites (skin) to buckets (about a meter) to buoys (about 3 meters) to ship inlets (which vary). There’s nothing deep or “underwater” about those two reefs, Brandon, which is why Kuffner et al. presented the data from those two reefs as sea surface temperature data!
Once again, stay on-topic, please.
You can try to justify your and Miriam’s misdirections, but they aren’t going to work. Maybe at Hot Whopper. Not here. The topic of discussion is sea surface temperature data for the region that encompasses Fowey Rocks and Carysfort Reef.
Last: Yes, I enjoyed the irony of your comments on that thread at HotWhopper.
Brandon, I hope your taking note that you can discuss this freely without being called a troll or your comments being moderated.
Indeed I am.
Bob,
I cannot point to specific issues with any of the data you have used other than the standard caveats you’ve already mentioned. I simply don’t have the expertise to speak to them in a way that would be interesting, novel or instructive. In short, I’m content for the both of us to accept them as is, knowing that they’re imperfect.
You have pointed to something you consider a deficiency in the paper, namely that the in situ data is not continuous and that the authors have not adequately substantiated their claim that the majority of the ocean warming near those reefs is a result of anthropogenic 20th century warming. Guess what, I don’t find it in their paper either and so that statement came off reading like an obligatory CO2-diddit even to my consensus-following warmist eyes. Look, I’ll go so far as to bet you that there are coral reefs somewhere on this orb with in situ sea temperature records which show a cooling trend since 1975. I don’t expect you to bet against me.
So, your sailent question is: what really happened to sea temps in those reefs during the gap in the in situ record? HADISST for that grid shows a divergence, so we’ve gone from no explanation to what now looks like a glaring discrepancy. Please tell me if I’ve missed something.
I am interested in attempting to figure out — on my lonesome if need be — what local sea temperatures at those reefs actually looked like. Kuffner & Co. didn’t satisfy either of us, but hey, that’s science. So let’s do some. I propose an experiment. We both independently attempt to do such a reconstruction of sea temps at those reefs using any data we like. Multiple reconstructions using different data to compare and contrast/what-if/whatever would be excellent, but not a condition. If Anthony is willing to “referee”, it might be interesting for us to mutually agree on a submission deadline. We send him our final output and supporting material for him to publish simultaneously, and the public peer review process can commence. What do you say?
I didn’t read your Hurricane Sandy SST post, it’s now in my queue.
In an open debate I consider it paramount to consider as much data as possible. Again, I think that your instinct to look at other data outside what was presented by Kuffner, et al. is a good one, in the best tradition of skeptical scientific investigation. True, I and others have publicly and not too kindly … questioned … the relevance of HADISST and other gridded data as you have used it. I’ve told you specifically why I think the in situ data are most relevant Kuffner, et al. and why I think SSTs in the open ocean miss the central point of the paper. I see that as different from dictating to you that gridded SSTs are OT, such was not my intent.
I’d appreciate the same consideration when I bring in additional data to develop my own argument … by all means tell me why you don’t think little green men from Mars are relevant to corals in the Fla. Keys, but I really don’t appreciate this sort of rhetoric any more than you do: “You can try to justify your and Miriam’s misdirections, but they aren’t going to work. Maybe at Hot Whopper. Not here. The topic of discussion is sea surface temperature data for the region that encompasses Fowey Rocks and Carysfort Reef.”
I came here to challenge your arguments on their merits because I think you’ve raised interesting questions, some of which I have myself. I’d appreciate it if you’d leave Miriam out of this. I didn’t bring it up, you did, and if anything is detracting from the scientific debate between us, it’s you continually roping me into your mudfest with her. I’m more than happy to leave HW out of it in this forum, are you?
If you think atmospheric temperatures and SSTs aren’t coupled, especially when they’re in close proximity to each other, this would be the time and place for you to explain why because thus far I ain’t seeing it.
[threading got wonky on me, so this reply is somewhat out of sequence]
Brandon, I commend you on your efforts to look further into the subject. Personally, I have little interest in the matter, so you’ll be on your own.
Regards
I tend to disagree, Forrest.
While the kerfuffle is annoying, the science is on display, and topics have been illuminated that I hadn’t considered before.
And I believe that goes for a large segment of the audience here.
OT (maybe)
It occurs to me that the IPCC and scientists advocating human produced CO2 as the primary cause of “global warming” are following the example of Ptolmey in that they proceed from a predetermined answer and create ever more complicated ‘epicycles’ in order to prove it. Ptolemy and those that supported his earth centric view had to continually ‘tweak’ his model to force it to conform to new observations. Seems to me that is exactly what the GCM modellers are doing.
Agreed. All those papers arguing that their models can show global warming causes more bitter winters, more snow, more sea ice and more cold waves are prefect examples of creating epicycles to hide numerous contradictions of a failed model. The trouble is those epicycles created a powerful illusion. Even today nearly every planetarium uses the epicycle models to pattern the gears that move the lights across the ceiling to imitate the night sky.
Perhaps Miriams brain is affected with ECObola? Symtoms include having delusions of having superior knowledge in all areas, and of needing to correct all who disagree with her, in order to save the world….or is it ECHObola…?
Eco-bola… good one, Bob.
I went over to check out Miriam’s blog to see what all the hub-bub was about, got engaged in one topic, came to the conclusion it’s an angry-grandma-has-opinions-and-you’d-better-damn-well-like-them blog.
She is good at rhetoric, but not much else.
Bob. Don’t waste your time. Facts won’t change her mind.
jeremyp99, Miriam is not my intended audience.
Wolfram Alpha metrics:
https://www.wolframalpha.com/input/?i=wattsupwiththat.com+vs+hotwhopper.com
Sounds like group therapy, Bob. Have you considered, as Anders says, that you might be wrong.
Margaret,
That’s the great thing about Science, it seeks out falsification EXPLICITLY in the method.
Belief on the other hand…relies on faith, and faith is unfalsifiable. Which is where adherents to man-made Global warming , or Climate Change (CC) if you prefer, now mostly reside.
-The fact that the GCM outputs, that the IPCC’s own conclusion rely so heavily upon, due to the temperature hiatus can now be rejected in favor of the null hypothesis means little to the adherents of the CC faith.
-The fact that the observed temp rise of 1976-1998 is NOT exceptional in the context of temps changes over the last 1000 years means little to the adherents of the CC faith.
-The fact that by every measure of extreme weather events, there is no upward change in frequency or severity in context to the historical records means little to the adherents of the CC faith.
-The fact that Northern and Southern polar ice measures remain within (or even exceed) historical norms means little to the adherents of the CC faith.
-The fact that human societies have had to deal with extremes of Climate Change cold and warm periods for at least the last 4000 years means little to the adherents of the CC faith.
-The fact that more CO2 in the atmosphere actually promotes a greening of the biosphere, which also provides some buffer against the inevitable and eventual climate cooling periods, means little to the CC faithful.
-The fact that wealthier human societies are much better positioned to afford and use technology to reduce harmful impacts (deforestation of forests for charcoal production for ex) of mankind on the environment, and that wealth requires energy utilization, means little to the CC faithful.
-The fact that we are blessed to currently reside during a 12,000 year long (so far) interglacial warm period, with a certain glacial returning, means little to the CC faithful.
-The fact that mankind should be embracing and running with next generation safe thorium reactors to survive the next glacial era descent means little to the CC faithfull.
No Margaret, your belief in the correctness of CC is based on an un-scientific faith in those who have other social-political motives that necessitate being less than truthful to the human population.
Margaret Hardman, thanks for your comment. My reply, I presented data, Miriam presented misinformation.
As an operational meteorologist observing the global atmosphere for over 3 decades, there have been many new things to learn about weather and climate. However, the biggest surprise has been the continuing opportunities to learn about the human psche.
This particular dynamic is just one of countless examples, that at times, rather than being an exception, are the rule in climate science today.
Tisdale prefers interpolated and infilled data. In situ measurements stinks.
Thanks.
I’m sure Bob can speak for himself on what he prefers. Hurling “stink bombs” , both real and rhetorical, has long been a tactic of radical anarchists.
wollie:
You are, of course, entitled to your observations & opinion.
However, your snarky little aside would have more intellectual credibility if you were to engage and defend your opinion. Bob does invite discussion, but asks you clearly state your position and quote his exact words you disagree with.
Be careful what you ask for, woollie
wollie, did you read the post? Based on your statement, we’re left to believe you didn’t understand it.
I understood Tisdale. You don’t trust thermometer readings from Florida Keys. You prefer interpolated and infilled data for HadISST.
No. You didn’t understand my posts, wollie, if that’s your conclusion.
Please quote me chapter and verse where I stated or implied that I “don’t trust thermometer readings from Florida Keys.”
As I noted in a comment above, my graphs presented a what-if scenario: What would the long-term curve look like (1) if there was continuous supply of sea surface temperature data from the two reefs presented in Figures 2 and 3 of Kuffner et al., and (2) if the sea surface temperature data from those two reefs were corrected for the differences in measurement methods? Both the HADISST and ERSST.v3b datasets showed that the primary warming took place in the early 20th century after the lighthouse-keeper data ended, not during the later warming period of the 20th Century.
If you’re not aware of this, that’s consistent with sea surface temperatures of the waters off the east coast of the United States, from Florida to New Jersey. Do you recall my posts after hurricane Sandy?
http://bobtisdale.wordpress.com/2012/11/05/sea-surface-temperature-anomalies-along-sandys-track-havent-warmed-in-70-years/
Tisdale: Expand your grid to 5×5 and see what happens.
You will not make an addendum to your post with that. I know you won’t.
wollie says: “Tisdale: Expand your grid to 5×5 and see what happens. You will not make an addendum to your post with that. I know you won’t.”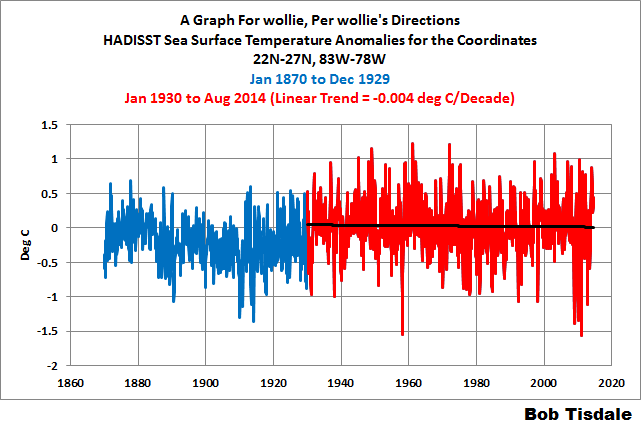
Why would I want to do amend my post with a graph that basically shows the same thing as the 1-deg x 1-deg grid, wollie? Expanding the coordinates to 22N-27N, 83W-78W provides a remarkably similar graph:
Compare it to Figure 3 in my post, wollie.
And here’s the data you requested smoothed with 121-month filter:
Compare it to Figure 2 in the post, wollie.
If you’re getting different results, wollie, then YOU, wollie, have entered the coordinates incorrectly.
You’ve wasted a half hour of my time, wollie. You owe me a half hour of my life back. Or I take donations here:
https://www.paypal.com/cgi-bin/webscr?cmd=_donations&business=C6Y5VHZNFB9QL&lc=US&item_name=Bob%20Tisdale¤cy_code=USD&bn=PP%2dDonationsBF%3abtn_donateCC_LG%2egif%3aNonHosted
Have a good day.
Bob,
Pretty sure this is wollie.
LOL.
Like I said, woolly, be careful what you ask for.
wollie = Wolly
Bob,
It’s expected that SSTs change temperature more slowly than air temperatures over land. In a 5×5 grid containing both land and ocean, we’d expect combined land/sea temperature trends to fall in the middle of timeseries masked for either land or ocean:
Not so surprisingly, SSTs for the entire N. Hemisphere show an upward trend from 1930 because, well, the entire planet has absorbed more energy than it’s dissipated.
WordPress didn’t like my embedded image link: https://drive.google.com/file/d/0B1C2T0pQeiaSaFktaEVYdTFsdzQ/view
Hi Bob, Been away for a few days and came across all of the above. This is purely anecdotal; when I was studying for my Meteorology degree I used to dive nearly every two weeks at Carysfort reef. Beautiful conditions. The ‘lighthouse’ is on stilts, no dry land/reef. The drop off was at about 50 feet, with a wall down to 100 or so feet. The coral was in good shape. This was in 1962 to 1966. Much later around 1995 I revisited the area and dove on the reef. I was astounded. The coral was in even better shape than I ever remembered it to be. I talked to Walter Stark who did pioneer photo work for the Univ of Miami and wrote a pretty good book on marine life in the keys, agreed with me. All of this is just to say sometimes folks just don’t know what they’re talking about. And maybe data is misunderstood. Floating buoys would not be close to the lighthouse platform; there are certainly currents about. Gulfstream eddies abound. So it doesn’t surprise me the SSTs would be different, very different, as distance from the platform increases.
Thanks, Weather Dave. Welcome back.
[Snip. Good to see this persona non grata adding to the site traffic. ~mod.]
Miriam is uninformed that coral bleaching may be caused by both warming and cooling water. Since the climate is always changing, either warming or cooling, coral bleaching is a natural phenomenon, not something unusual.
“The results of this study suggest that corals and coral reefs may also be impacted by exposure to cold as well as warm temperature extremes as climate change occurs.”
http://www.int-res.com/abstracts/meps/v248/p85-97/
not only the cold but pollution.
The main culprit for destruction of coral has certainly not been the climate. In the pacific in the 1970’s and 80s it was usage for building.
But many varied reasons.
http://www.unep.ch/regionalseas/main/persga/pilcher.html
http://oregonstate.edu/ua/ncs/archives/2013/nov/large-study-shows-pollution-impact-coral-reefs-%E2%80%93-and-offers-solution
CORVALLIS, Ore. – One of the largest and longest experiments ever done to test the impact of nutrient loading on coral reefs today confirmed what scientists have long suspected – that this type of pollution from sewage, agricultural practices or other sources can lead to coral disease and bleaching.
————–
On hot whopper this comment would have been removed,
Not only cold, warmth and pollution, I can’t imagine the corals were pleased to have the pilings for the lighthouses at Fowey Rocks and Carysfort Reef driven into them, or having those lighthouses provide shade.
Fowey Rocks lighthouse:
http://www.divespots.com/scuba-diving-spots/florida/miami/spots/fowey-lighthouse-fowey-rocks
Carysfort Reef lighthouse:
http://www.divespots.com/scuba-diving-spots/florida/florida-keys/key-largo/spots/carysfort-lighthouse
Pilings- phah,thats nothing! , I’ll take your pilings and raise you 50,000 degrees,
http://www.livescience.com/2438-bikini-atoll-corals-recovering-atomic-blast.html
Thanks, Richard. I enjoyed that. Laughed out loud…just as one of my neighbors passed by my open patio door, looking at me oddly.
Bob, you may find this interesting. Coral and the Maldives. They were always banging on about how AGW was effecting the coral and the islands were in danger of flooding.
“Mined areas of the reef were simply wiped out”
http://www.fao.org/docrep/x5623e/x5623e0o.htm
————–
Bearing in mind that Coral probably takes 20 to recover, using coral for building was banned in the early 1990s.
So 20 years later-
BBC News – Low-lying Pacific islands ‘growing not sinking’
http://www.bbc.co.uk/news/10222679
3 Jun 2010 – A new geological study finds that many low-lying Pacific islands are growing, not sinking. … featured in the magazine the New Scientist, predicts that the islands will … that most have remained stable, while some have actually grown. …. current browser, you will not be able to get the full visual experience.
If warm water is very bad for corals, how come 500 species of corals thrive in the Coral Triangle? Its temperature is 28-30 C. Off the coast of Florida it’s 26-27 C. It seems corals love warm water.
I don”t think they do, based on all the above links it would seem that pollution is the key problem. With the El Nino back in 1982/ 83-
http://www.atmos.washington.edu/gcg/RTN/rtnt.html
“Within the next few weeks, the ocean began to react to the changes in wind speed and direction. Sea level at Christmas Island in the mid-Pacific (see map) rose several inches. By October, sea-level rises of up to a foot had spread 6000 miles eastward to Ecuador. As sea level rose in the east, it simultaneously dropped in the western Pacific, exposing and destroying the upper layers of the fragile coral reefs surrounding many islands. Sea-surface temperatures at the Galapagos Islands and along the coast of Ecuador rose from typical levels in the low 70s (degrees Fahrenheit) well up into the 80s”
and the 1997/98 El Nino caused the same problem.
sorry mean to say i don”t think warm water is a problem.
It seems ridiculous … realists forever having to expose the lies, deception, misinformation, pseudo-sclence and propaganda of climate change alarmists. But it just has to be done.
Realists are having to combat the absurdity of climate change charlatans who claim, as an example, that global warming is causing global cooling in Antarctica.
Where`s Wollie?
Probably feels bad that he wasted a 1/2 hour of my limited time on this lovely planet. Mmmmm, probably not.
Tisdale: There is still time for you to explain why in situ measurements must be wrong because interpolated and infilled data is different. Also different from measurements from land stations.
You prefer interpolated and infilled data. Based on much fewer measurements. Daily in situ measurements suck.
Perhaps Tisdale also would comment on the discrepancy between HadISST and HadSST3?
Tisdale won’t do that. Inconvenient.
Since ‘beckleybud’ [“wollie”] was outed, he skedaddled.
I’m just now learning about Miriam O’Brien. She wrote a cute essay on her blog about my guest essay on WUWT back in August:
http://blog.hotwhopper.com/2014/08/james-mccown-and-wuwt-reject-co2.html
I’m tempted to write a rebuttal, but that poor woman is too far gone to even try reasoning with. She doesn’t have the slightest what I was saying in my post, so she can’t respond to my main thesis. Instead, she writes a load of fabrications “How James McCown disputes basic chemistry” and non sequiturs.
Amazing the lengths the warmists will go to.
James, let me guess. The fabrications, misdirections and redirections from Miriam gave you a remarkably strong feeling of frustration. The trick is to read her posts without getting frustrated. They can actually be very entertaining then.
You’re right, Bob. I should try to laugh about it.
The problem is I feel such a deep sense of pity for poor Miriam. When they were handing out brains that woman went AWOL.
I should be used to such dysfunctional mental processes by now, after all my years in academia. But it still troubles me. How can people like Miriam deal with everyday life? How do they manage?
The mind boggles.
Bob,
i already read more then 3 years without really commenting your amazing posts about the sea surface temperatures and ENSO,…
sadly on the topic the comments are closed so i put it here as it also handles aout that “blob”
Without having the in-depths knowledge as you do nor any connection to do a reasonable research on it i do have a question that may be interesting to look into:
what struck me is the start of this years El nino and the similarity with the super el nino of 1998 and 2010, to then suddenly “vanish”, to then make that famous area in the eastern north pacific nicknamed as “the blob” grow stronger on the timing the el nino should occur… so maybe a stupid question (at least then i learned something by the answer) but is there a possibility that the nino kelvin wave could be diverted to the area where that blob resides during it’s travel along the equator? (the idea is could a warm water mass from an el nino be captured by the north pacific counter current and be dispersed/diverted to the north pacific gyre and then be blown eastwards by the opposite trade winds, if it was able to cross the subtropical jet)
Of course i can be completely wrong i’m not a scientist so i for sure can live with the answer that it is just coincidal because of the north pacific current being to cold/strong for any warm water to cross it or be dispersed…
Frederik Michiels, thank you for your observations about this El Nino and the blob. If we look at the sea surface temperature anomalies in the area of the blob (the purple curve)…
http://bobtisdale.files.wordpress.com/2014/09/figure-42.png
…we can see that 2014 is actually the second year of high temperatures. The unusual warming began in 2013.
There was a recent paper that linked the blob to the warming in the western (not eastern) tropical Pacific. I didn’t read or study that paper to see if it made sense and don’t have a link available right at the moment.
As a side note, if you ever have a question on a post that’s more than a few days old, feel free to ask it at my blog.
http://bobtisdale.wordpress.com/
I moderate comments there and reply to all questions. Sometimes due to the high traffic here at WUWT, I miss questions.
Cheers
[On your website, I do not see a thread, link, or “Continuing Post” (like WUWT “Notes and Tips” where a new reader can ask such a question though. How do you want them to contact you? .mod]
Good question, moderator. They can ask the question on any thread.
Dear Sou**
My premise is that, given your easily observed fanatical devotion to every word of every post at WUWT that is well evidenced by your long term behavior on your blog Hotwhopper, you need us for your deepest raison d’être .
We’ll be around for you out of our benevolent compassion.
**a.k.a.: Miriam O’Brien; a.k.a. Sou from Bundangawoolarangeera; a.k.a. Madame de HotWhopper
John
Hi John,
Yes, Miriam is fixated on WUWT, and on Anthony, and on the folks writing guest articles here. She obviously reads every one of them voraciously, ratcheting up her wild-eyed, spittle flecked emo-response all the while, and then she runs back to her little blog to vent.
Miriam clearly has major psychological issues; it doesn’t take a trained professional to see that. I feel sort of sorry for her. She was no doubt badly mistreated in some way when she was very young, and this is the result. But I would feel a lot more sympathy for her if she would try to control herself.
A common tactic among climate alarmists is to demonize anyone who simply has a different scientific view than they do. That is why they constantly label skeptics as ‘denialists’, ‘contrarians’, and worse. The common motivation seems to be their irrational hatred, which they lay on thick.
It amazes me that Miriam O’Brien has any readers at all. But then, she isn’t the only one with severe psychological problems…
dbstealey on October 30, 2014 at 1:23 am
– – – – – –
dbstealey,
Pleasure to get a comment from you.
I cannot go down the road of some commenters who I see assigning psychological issues or mental problems to people with whom, in general, we have fundamental disagreement with, sorry. I know the Lewandowsky’s and Oreskes’ of the world irrationally and unethically try ineptly to play the psychological / mental card against people like us who criticize their activist / ideologically inspired climate position; but I will not be a mirror image of them.
To me it is expected to see contrary positions held by humans as they voluntarily make their own individual intellectual decisions on how to reason and what ideas to act on. That is the human condition and it does not intrinsically hold that people who I profoundly differ intellectually with have psychological or mental problems; quite the contrary.
John