Temperature above 80 degrees north drops below freezing early, and continues to drop.
Many people have been watching the remarkable early drop in air temperature at the DMI plot here:
![meanT_2013[1]](http://wattsupwiththat.files.wordpress.com/2013/08/meant_20131.png)
This drop looks to be about two weeks early. As this next analysis of sea surface temperature shows, much of the area is below freezing. Of course in seawater, ice doesn’t form until temperatures get below 28.4°F (-2°C), so it is close, but not quite there yet. [Note: due to lower salinity in the Arctic seawater freezes at -1.8C according to this essay at NOAA by Peter Wadhams]
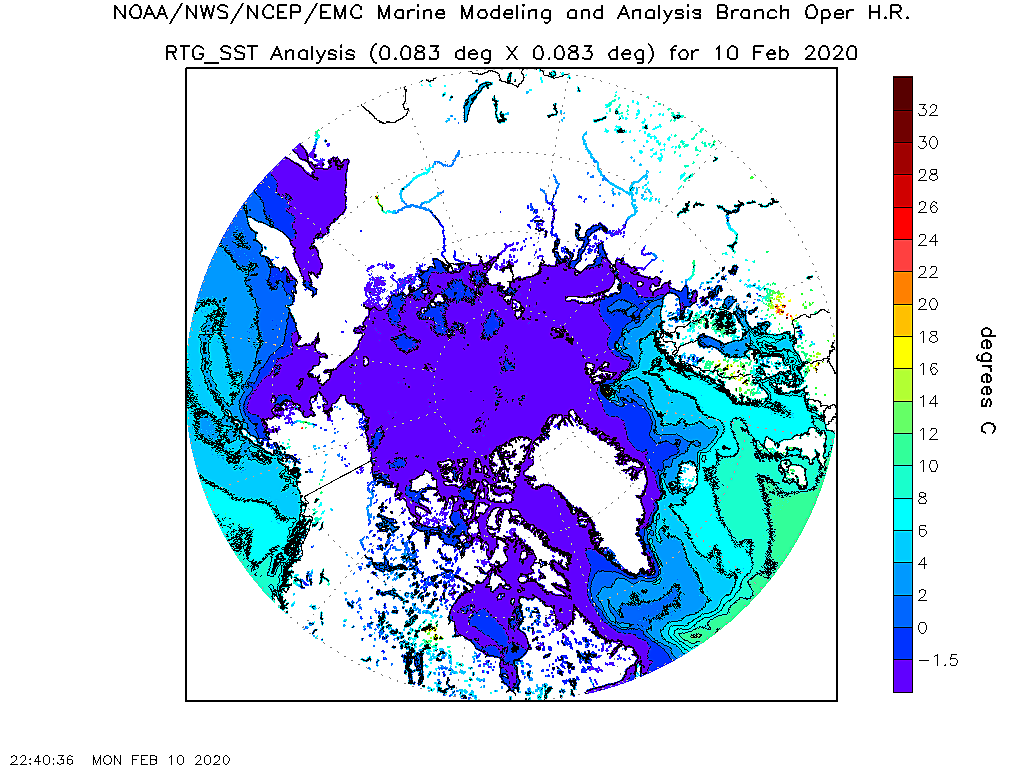 National Centers for Environmental Prediction (NCEP) Marine Modeling and Analysis Branch (MMAB) – Click the pic to view at source
The DMI sea ice plot looks to be slowing significantly, but has not made a turn yet.
![icecover_current_new[1]](http://wattsupwiththat.files.wordpress.com/2013/08/icecover_current_new11.png)
The JAXA plot isn’t quite so different from previous years, but does show some slowing:

- Japan Aerospace Exploration Agency (JAXA) – International Arctic Research Center (IARC) – Click the pic to view at source
With this slowdown becoming evident, and temperature dropping early, the possibility exists that a turn in ice melt may start earlier than usual. If it does, we might see a turn begin in about two to three weeks if there’s any linkage between 80N temperature and sea ice extent. Typically, we see a turn in Arctic sea ice melt around September 15th to the 25th.
Of interest is this plot done by the blog “sunshine hours” which shows the difference between Arctic sea ice in 2012 and 2013.
He writes:
The difference is quite dramatic if you graph the anomaly % from the 30 year mean.
Until day 175 or so, the anomaly was only around -5% or so (note that the anomaly actually went positive for a few days in 2012).
While 2013 was later, both started drifting down. 2013 has stabilized at -15%. At this time last year 2012 was -30%.

Click image to enlarge.
Check out all of the data at the WUWT Sea Ice reference page
UPDATE:
Some commenters have noticed a large drop in today’s most recent plot.
First, regarding this graph:
![icecover_current[1]](http://wattsupwiththat.files.wordpress.com/2013/08/icecover_current1.png)
That’s the old DMI plot, which DMI says we should now use this one on this page:
http://ocean.dmi.dk/arctic/icecover.uk.php
They write:
The plot above replaces an earlier sea ice extent plot, that was based on data with the coastal zones masked out. This coastal mask implied that the previous sea ice extent estimates were underestimated. The new plot displays absolute sea ice extent estimates. The old plot can still be viewed here for a while.
And, that could be either an instrument failure or a processing failure. We’ve seen spikes like that before. It might also be real data, we won’t know until the next update.
I tend to favor loss of data, as reader “DJ” points out in comments, see this image:
![satcon.arc.d-00[1]](http://wattsupwiththat.files.wordpress.com/2013/08/satcon-arc-d-001.png)
But yes, this post was edited last night at about 11PM PDT, and DMI updated the graph a few hours later.
MS&T says:
“Isn’t Goddard the blogger who claimed it snowed dry ice at the South Pole?”
I wouldn’t know. Got a link?
And re: Venus, here is an interesting site that addresses that question.
Now, in order to have my facts straight, tell me: do you believe that global warming is caused by humans? I wouldn’t want to misrepresent your position.
Back up your position with verifiable, testable facts and empirical evidence.
@dbstealey
[Snip. Once more and your entire comment will disappear. ~mod.] you know where the dry ice post was made, did Anthony happen to delete it. I will have to ask around because I know I won’t get an honest answer from you.
Let’s keep the discussion on topic, I didn’t come here to argue about climate change, that is a hopeless case at this venue.
@dbstealey
I told you I am a genuine skeptic, so I did a little search for Harry Dale Huffman’s publications. I can’t take him serious because he wrote a book that claims that Plate Tectonics isn’t real.
When someone makes claims like that, it makes all their other work suspect.
The most important study to look at regarding the loss of ice in previous years is already done and the history is absolutely clear, our present state is dire. Look around and see what is happening. Lake Powell is projected to reach a new absolute minimum, you know, the one it reached back in 2003. . .
sea ice in the arctic fell off a cliff at the exact same time that temperatures started to rise.
This all just happened to occur when the U.S. and Europe began to install scrubbers in their coal-fired power plant smokestacks, removing the reflective particles of sulfur dioxide that had been cooling the planet.
see: figure 2a
History of sea ice in the Arctic, Polyak et. al (pdf)
@dbstealey
Why do claim that PIOMAS is unreliable?
Back up your position with verifiable, testable facts and empirical evidence.
Meanwhile, back at the “North Pole Camera….”
It got down to -5.9 Celsius yesterday. (21.4 Fahrenheit.)
I meant to say: It got down to -5.9 today. While the sun was shining. When clouds moved in it “warmed up” to -2.5.
Temperatures have been at or below the freezing point of salt water, at that drifting location, since some point between the 1500z and 1800z reports on August 10.
One heck of a way to run an ice-melt; that’s all I can say.
MS&T says:
“…you know where the dry ice post was made, did Anthony happen to delete it.”
What ‘dry ice’ post? If I knew what you were trying to say I wouldn’t have asked. Maybe you were just dreaming…
And:
“Back up your position with verifiable, testable facts and empirical evidence.”
What, do you live in a schoolyard? If your total argument is repeating exactly what I wrote, then you can’t be helped. I also note that the conjecture that PIOMAS is reliable is all yours. As your conjecture, you have the onus of defending your belief system. But it’s clear that you still have not read the links I provided. As stated above, your mind is already made up. The symptom of a True Believer.
And you never did answer my question: Do you believe that global warming is caused by humans? Back up your position with verifiable, testable facts and empirical evidence. Or pretend you’re still in a schoolyard, and you can get away with not giving an answer.
Finally, you did not attempt to refute Huffman’s very logical argument on Venus, so you forfeit. Changing the subject is moving the goal posts, a tactic of alarmists when they cannot refute an argument. Simply put: you didn’t try to refute Huffman because you are not capable.
But nice try, and thanx for playing…
I notice that the sea ice extent at both poles experienced a sharp change on their respective graphs in late July. The Antarctic sea ice extent gained rapidly, while at the same time the Arctic slowed it,s sea ice loss. Is this normal for both poles to react simultaneously in this regard? I watch the daily moves from here…http://nsidc.org/data/seaice_index/#. The rate of sea ice formation in the Antarctic then dropped a bit for 4 days after the accelerated growth, but it is now surging again to further new highs in the last several days.
@dbstealey
I am still waiting for something regarding PIOMAS that is factually based. Why can’t you answer a simple question?
AS far as Huffman’s blog post goes, when he publishes it in a reputable peer reviewed journal I will accept his claims.
Are you familiar with his other books that claim the earth was intelligently designed?
I will have to do a search for the snowing dry ice post on the wayback machine, it’s hard to make things like that completely disappear. I bet someone at Tamino’s blog could give me a link.
MS&T says:
“AS far as Huffman’s blog post goes, when he publishes it in a reputable peer reviewed journal I will accept his claims.”
Who cares what you will accept? As everyone can see, that is a total copout. Hiding behind pal review does not make anything valid, or invalid. You are just incapable of refuting Huffman’s Venus article, that’s all. Just remember: you were the one who brought up Venus.
Same goes for ‘intelligent design’. Why don’t you use the Wayback Machine and find out if I have ever bought into that? heh… But nice try, and thanx for playing.
Say ‘Hi’ to tamina for us. Maybe tamina will give you some new talking points. The ones you’re using are old and busted. And when you click on that blog, you will probably add ten percent to your chump’s traffic. That should make his day… ☺
@dbstealey
I notice you don’t have anything fact based to refute the validity PIOMAS.
@dbstealey
What talking points have I used, that is projection on an IMAX scale?
I never accused you of being a proponent of intelligent design, that is a poorly stuffed straw-man.
The only issue I have is with is your claim that PIOMAS has been discredited. That is an old debunked talking point.
RE: Master of Space and Thyme,
You first commented at 7:19, when I had to get to work. Now I’m back, and am amazed at the time and effort you put in all day. Does your boss know what you are up to? I’d love to spend all day watching ice melt, and thinking about what I watch, however my boss (IE wife) won’t allow it. I am an oppressed worker.
I’ve only had time to skim through the hundred or so comments, and check a couple links, however I did spend roughly eight glorious minutes watching ice melt in that video you linked to back at 11:18.
It is odd how you and I can look at the exact same picture and see such different things. You stated, ” If anyone is interested in seeing how bad the ice is at the H buoy is, check out the movie from the webcam. The cam was removed last week after the ice collapsed. The significant melt starts at about 6 minutes in to the video.”
First, you hurt the feelings of that ice by calling it “bad.” Be careful. In some circles that would be deemed politically incorrect.
Second, that slushy scene looked very typical to me, for the time and place.
Third, the camera apparently was designed to survive being tilted into a lead, and able to right itself, providing it was floating on water. The times it spends looking down are due to being crunched in ice, and unable to right itself. During the final video-minutes it is positioned in water between ice, not on ice itself, and therefore I think it may be incorrect to state, “The cam was removed last week after the ice collapsed.” My assumption would be that the camera was retrieved because it is a darn valuable hunk of equipment, and could be damaged in all the jostling that goes on in a storm, when a sea is 70% sea ice, and a big storm was in the forecast. In any case, even as the camera shows the ship coming to pick it up, the ice cover is 70%.
In my view 70% ice cover is not “bad” ice cover. However, as I said, we see things differently.
I do appreciate the many links you provide, and I’m green with envy that you apparently get away with watching ice melt more than I do.
MS&T says:
“I notice you don’t have anything fact based to refute the validity PIOMAS.”
Wrong as usual; in the Scientific Method, the one who has the onus of defending a conjecture is the one making the conjecture. But you try to put skeptics in the position of having to prove a negative — a tactic in constant use by the alarmist crowd. It is your conjecture that Piomas is a legitimate source.
Even so, I cooperated and linked to 28 articles that referred to Piomas, and showed that Piomas is not a legitimate blog. MS&T could not possibly have read all those articles and threads, which were probably 90% critical of Piomas. So in fact I did post a refutation of that ridiculous, alarmist propaganda blog. And with the Arctic re-freezing early, there goes the alarmist predictions.
As a scientific skeptic, I have no obligation to defend my skepticism. Rather, you have the onus of defending your conjecture [it is not even a hypothesis, because it is not testable, and therefore not falsifiable]. And I note that you are still avoiding answering my question: “Do you believe that global warming is caused by humans? Back up your position with verifiable, testable facts and empirical evidence.”
I suppose you will continue to dodge that impossible question, for the simple reason that there is no empirical evidence or testable, verifiable facts showing that global warming is caused by humans. You would need to provide such evidence that that is true, but as we all know, no such scientific evidence exists.
Anyway, say Hi to tamina for me. He must be wondering where you ran off to.☺
@Caleb
I was surprised to read that the retrieval was scheduled and not related to recent melt and weather events. Your’e right about the buoy floating freely, there are pictures at the link showing it’s retrieval. Here is an online diary from the ship.
http://www.whoi.edu/page/preview.do?pid=123416
The main page at that site gives some background information about the Beaufort Gyre Exploration Project. The Beaufort Gyre traditionally was something akin to an ice nursery. Ice used to spend several years growing in the gyre before returning to the CAB or being flushed through the Fram Strait.
http://www.whoi.edu/page.do?pid=66316
@dbstealey
So you have nothing factual, it’s time to ignore you.
MT&S,
You’re still going to “ignore” the twenty-eight (28) articles I linked for your benefit, which all debunk that ridiculous Piomas blog? And you are going to “ignore” my repeated question to you, because you can’t answer it?
OK. Then run along back to tamina, that’s the True Believers’ echo chamber. Really, that’s where you belong, not here on the internet’s “Best Science” website.
But of course if you change your mind and continue to display the Arctic ice pseudo-science you’ve been posting here, you can trust me to help set you straight on the science. And then there’s that question that you’ve been dodging all day…
Cryosat2 is not going to work for its primary mission.
The raw data changes so much from orbit to orbit (tides, waves, variable air pressure, pressure ridges etc.) that it can’t really resolve the ice thickness as it was intended to do. It takes more than a year of computer crunching time to come up with the data and even then, they had to throw half of it out.
They are trying to come up with alternative missions to keep it flying and maintain the operations/science jobs going.
PIOMAS, well, it has its supporters in the pro-AGW people who “like” their data going in a certain way but its numbers are illogical and nearly physically impossible. For example, the average sea ice thickness is currently under 1.0 metre according to PIOMAS. But let’s say the edges are 5 cms thick and the middle is 2.0 metres. Then the average is 1.0 metre. But even in the depths of the winter, there is still an ice edge at 5 cms, its the area that expands. It will still be 1.0 metre thick on average. Their seasonal cycle numbers are unphysical as is the large decline in the volume.
Bill Illis says:
PIOMAS “…seasonal cycle numbers are unphysical as is the large decline in the volume.”
Thanks, Bill. That explains the ultra-scary graphs that PIOMAS puts out, showing Arctic ice declining at an alarming rate — when in reality, Arctic ice is recovering.
@dbstealey
What have I posted regarding ice that you consider pseudo-science? You’ve got nothing!
You should rejoin the facts based universe, you might enjoy the change.
Your tired old talking points are way beyond their best before dates. When you get cornered you always revert to the same old crap, you have become too predictable. A genuine skeptic has an open mind, you sir are no skeptic.
I
From dbstealey on August 14, 2013 at 7:25 pm:
PIOMAS is now downgraded to a blog? It’s been so long since I looked, the links changed and I had to Google. Now the URL (see link) has “wordpress” in it.
And now it’s down to blog status, not even worth being considered a promising and ernest scientific venture revealed as tragically flawed and failed.
Oh well, thanks for the news!
PIOMAS has a built-in inherent flaw. As seen on the linked main page down in the “Model and Assimilation Procedure” section:
Follow that NSIDC link, and does it say (bold added)?
Thus PIOMAS uses data that is clearly labeled as unsuitable for the very purposes that it is not to be used for.
I expect the Master of Their Domain of Space and Thyme will say that doesn’t invalidate PIOMAS. Much like they would accept a speeding ticket from a police officer using a calculator, yard stick, and stop watch to figure out the speeds.
Brian says:
August 14, 2013 at 1:32 pm (replying to)
RACookPE1978 says:
August 14, 2013 at 1:00 pm
“The average Arctic minimum sea ice area is 2,000,000 sq km.
That is an area corresponding to the area between 85 north latitude and the Pole.”
I think you are misunderstanding my statement, and thus my logic.
1) I’m using just sea ice area in this comment. Sea Ice extents is a different creature.
2) NORSEX has (last year) a minimum sea ice area of 3,000,000 km sq. If today’s – this week’s “average anamoly” of -1,000,000 continues – which is not expected, but certainly could happen, do you agree then that a minium “sea ice area” of 2,000,000 could happen?
3) Do you not agree that last year, a minimum sea ice area of 3,000,000 sq km DID happen? (Cryosphere plot.)
And, by the way, nothing else happened. No “death spiral” no global heating, no cyclones, no hurricanes, no excess tornadoes, no excess people dead from heat worldwide, etc. (There were many tens of thousands of COLD related deaths in the UK, but the CAGW apparently wants that result of their deliberate policies to harm people.)
4) Thus, my question for you: Did it matter that we were at 3,000,000 last at minimum sea ice area, compared to a recent average of just about 5,000,000 sq km?
5) If we were at an Arctic sea ice minimum area of 2,000,000 this year, where would the edge of that sea ice area be located?
When you try to look at maximum available radiation from the sun at various days of the year, knowing the “average” latitude of the edge of the sea ice IS critical!
In the 1980’s , minimum sea ice area was about 7,250,000 sq km.
In the 1990’s, the minimum sea ice area decreased to 6,800,000 sq km.
In the earlier 2000’s, it was down to 5,500,000 sq km.
recently, it has gone down to 3,000,000 sq km. And the “weather” this year is COLD. And the “weather” up north in the Arctic, near the edge of the missing sea ice cover, is colder. Just as thermodynamics predicts.
Greg Goodman says:
August 14, 2013 at 1:02 pm (replying to)
RACookPE1978 says:
A comment was raised above about melt water pond albedo and the resulting melt rate:
Thank you for the correction! As always, I appreciate the help.
While “average area sea ice albedo” decreases considerably during the summer melting period (June through September each year), the “open ocean albedo” is not really sensitive to day-of-year.
It IS VERY, VERY strongly sensitive to “diffuse” sunlight” and “direct sunlight” at EVERY day of the year and EVERY “Solar elevation angle” however. And, as the above two solar fractions change with cloud cover and wind speed and ocean wave height, the open ocean albedo changes with those as well. ‘Tis a complex problem, but solvable.
The following is not well known unless you’ve looked at lots of “open ocean albedo” research papers dating back as far as the mid-50’s, but please bear with me.
Solar radiation at the earth’s surface is made up of direct sunlight and diffuse (indirect) sunlight. On a very cloudy day, there is simply put, NO direct sunlight. (You cannot, standing outside, see any shadow.) All radiation received is diffuse radiation, and comes from a nominal 45 degrees solar elevation angle. Practically speaking, from all around the sky. Through the mid-summer of the high Arctic, cloudy days are about 85% of the weather. So, 6 out of 7 days of the week, ONLY diffuse radiation gets through to the surface. Note that this means that 45% to 75% of the POTENTIAL solar radiation is also immediately and completely reflected from the top of the clouds. Thus, 60%-70% of the POTENTIAL radiation each day does not even arrive on top of the sea ice or, if the sea ice melts, the supposedly “dark” open ocean water.
However, we have seen that the “reflective” sea ice during the mid-summer is – well, actually, not-so-reflective after all: it averages 0.65-0.75 albedo. The open ocean albedo of diffuse IS “dark” at about 0.065, but that albedo does NOT depend of solar elevation angle.
So, IF the solar radiation gets through the clouds, almost all of it – about 94% – WILL get absorbed into open water. But remember, only 30% made it through the clouds on those 6 out of the 7 days of any given “average” week in the summer Arctic when it is cloudy, so only 27% could get absorbed by the open ocean water. Net? 73 percent of that potentially available solar radiation is NOT absorbed by that newly exposed ocean water on 6 of the 7 days when clouds are present.
What if there were sea ice on these cloudy days? How much would get reflected? Well, if the (actual measured) sea ice albedo of 0.65 to 0.75 is correct, then 65% to 75% of the 30% maximum potentially available solar radiation on a cloudy day is reflected from the sea ice.
Net effect of sea ice melting in the Arctic? Not no difference at all, but certainly very little difference compared to the “death spiral” of runaway Arctic warming so often talked about and assumed by the CAGW hysterics. For example, just a few days ago, one such wrote here words to effect of ” Don’t you know that 90% of the sun’s energy is absorbed by the ocean, and 90% is reflected by the ice?”
So, what about those few and far between clear and sunny days when there actually IS direct radiation in the Arctic?
It turns out that the entire problem changes on clear days: even MORE energy is reflected from the open ocean, and the net difference in absorbed energy is even less – but most strongly at times of minimum sea ice area/extents!
But, the “rest of the story” will be later. 8<)