We discussed Dr. Roy Spencer’s post More on Trenberth’s Missing Heat in my recent post and in the cross post at WattsUpWithThat.
One of the points Roy made: a change in ocean heat content is presented in terms that look impressive: Joules times 10^22 or Joules with oodles of trailing zeroes. However, in terms that most people are familiar with, temperature, the warming of the global oceans since 1955 was a minute change. Roy wrote:
Because of the immense heat capacity of the deep ocean, the magnitude of deep warming in Scenario 3 might only be thousandths of a degree. Whether we can measure such tiny levels of warming on the time scales of decades or longer is very questionable, and the new study co-authored by Trenberth is not entirely based upon observations, anyway.
The NODC presents their ocean heat content data through their webpage here. There, they also include a link to the 2012 paper by Levitus et al that introduced their dataset for depths of 0 to 2000 meters World Ocean Heat Content and Thermosteric Sea Level change (0-2000 m),1955-2010. In the abstract, Levitus et al identify the change in temperature of the volume of water that makes up the global oceans to depths of 2000 meters, or about 6560 feet (my boldface):
We provide updated estimates of the change of ocean heat content and the thermosteric component of sea level change of the 0–700 and 0–2000 m layers of the World Ocean for 1955–2010. Our estimates are based on historical data not previously available, additional modern data, and bathythermograph data corrected for instrumental biases. We have also used Argo data corrected by the Argo DAC if available and used uncorrected Argo data if no corrections were available at the time we downloaded the Argo data. The heat content of the World Ocean for the 0–2000 m layer increased by 24.0 ± 1.9 × 10²² J (±2S.E.) corresponding to a rate of 0.39 W m−2 (per unit area of the World Ocean) and a volume mean warming of 0.09°C.
That’s right. According to Levitus et al 2012, the average temperature of the global oceans to depths of 2000 meters warmed a miniscule 0.09 deg C (or 0.16 deg F) from 1955 to 2010. Granted, the heat capacity of the ocean is much greater than the atmosphere, but that warming of 0.09 deg C strains believability. Are we able to sense such a small change?
Some might think Top Gear’s Jeremy Clarkson is correct with what he wrote in a June 2012 The Sunday Times article titled Kaboom! It’s my turn to play fantasy climate change:
Science fiction is thriving; only today it’s all being written by global warming enthusiasts.
(Just in case there’s a problem with the link above, Benny Peiser’s GlobalWarmingPolicyFoundtion has a copy of Jeremy Clarkson’s article here.)
Figure 1 is the same graph I presented in the introduction of More on Trenberth’s Missing Heat. Except in this graph I’ve scaled the data in deg C so that it creates the 0.09 deg C warming of the global oceans to depths of 2000 meters from 1955 to 2010 in the NODC data. As a reminder, the “unadjusted” ocean heat content data is represented by the UKMO EN3 data, and the corrected—tweaked, adjusted, modified, whatever—ocean heat content data is represented by the NODC data. Regardless of whether you find the unadjusted or adjusted data to be the more reasonable dataset, we’re still talking of a warming of about 0.09 deg C over a 55-year period.

Figure 1
Keep in mind, the global oceans cover a surface area of about 361 million square kilometers and the data is supposed to represent the average temperature of the oceans to depths up to 2 kilometers.
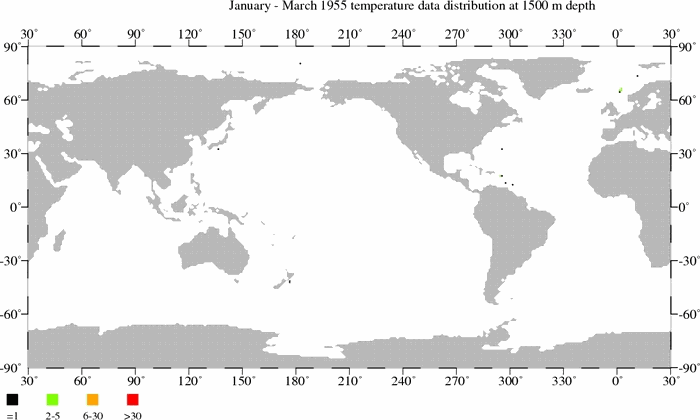
Now consider how few temperature samples there are at depths of 1500 meters before 2003/04 (Refer to gif animation of temperature sample maps here). 2003/04 is when the ARGO floats began to have reasonably complete coverage of the global oceans. It’s very difficult to find the dataset credible. A warming of 0.09 deg C in 55 years equals a linear trend of approximately 0.016 deg C per decade. That’s sixteen one thousandths of a deg C per decade.
Even during the ARGO era, the data has to be modified in order for it to come close to matching the warming trends simulated by climate models. I’ve shortened the term of the data in Figure 2 to the ARGO era (the period of 2003 through 2011) to give you an idea of just how small those corrections are in deg C. I’ve also included the linear trend lines for the sake of discussion. Also note that the larger annual changes in the two datasets are on the order of 0.005 to 0.006 deg C.

Figure 2
ONE MORE THING TO CONSIDER
Most of the warming occurred in the top 700 meters. But the warming at those depths has flattened in recent years.
Levitus et al 2012 also identifies the warming of the depths of 0 to 700 meters. They write in the abstract:
The heat content of the World Ocean for the 0–700 m layer increased by 16.7 ± 1.6 × 10²² J corresponding to a rate of 0.27 W m−2(per unit area of the World Ocean) and a volume mean warming of 0.18°C.
The depths of 0-2000 meters warmed 0.09 deg C from 1955 to 2010, but the warming of the top 700 meters was twice that amount. That means the warming of the depths of 700 to 2000 meters, where the warming is said to continue, was miniscule in terms of deg C.
ALARMIST REPORTS ABOUT THE CONTINUED WARMING OF THE OCEANS
In their attempts to overcome the flattening of surface temperatures trends, the alarmist community—SkepticalScience and Climate Progress in particular—have been very active recently with their reports about the continued warming of the global oceans. The most recent is Joe Romm’s April 16th post Reuters Ignores Its Own Accurate Reporting On Rapid Warming Of Oceans. If the alarmist community and the mainstream media presented the ocean warming to depths of 2000 meters in terms people understood (deg C) instead of the units meant to alarm (10^22 Joules), would the believers in manmade global warming find the ocean heat content data credible? Some would. Others wouldn’t. It really strains believability.
CLOSING
ARGO floats were introduced to allow researchers to sample the temperature and salinity of the global oceans to depth. According to the testimony of Raymond Schmitt when the ARGO program was looking for US funding, ARGO floats would permit scientists to “begin to understand this largest component of the global water cycle.” (Refer to the Woods Hole Oceanographic Institution webpage.) But can they realistically be used to find missing heat that’s supposed to be associated with human-induced global warming? Or are certain members of the climate science community still grasping at straws in efforts to keep their taxpayer-funded research afloat?
Discover more from Watts Up With That?
Subscribe to get the latest posts sent to your email.
Hi Bob
Thanks for another great post.
Lets get this in perspective. The average ocean depth is 4.3Km i.e 4300metres.That’s an awful lot of water. We do not begin to understand what is happening in the abysssal waters. The idea that we can measure globally the ocean temperature to any meaningful figure is as nonsensical as many of the other claims we are given that much of climate science is based on. SST’s globally back to 1860? Hubris. An average global temperature accurate to tenths of a degree to 1880? No,
Perhaps someone here could calculate how much energy it would take to heat the oceans globally to a figure greater than the error bars. let’s be very generous and call that half a degree centigrade. How long would that take?
tonyb
700 – 2000 meters is a long way at 1300 meters depth. How exactly is the heat supposed to have diffused downward and “evenly” over that short time? Surely if we can resolve the temperature to the nearest few thousandths of a degree, we can see the heat moving downwards over that time? I mean it cant instantly be throughout that 1300m can it?
The thing is I dont recall seeing a single paper actually mapping that heat moving downwards into the ocean over that time through these exceptionally accurate measurements we’re making.
On a side note, Clarkson’s “Global warming enthusiasts” is an excellent term IMO.
If you have to alter observed data to match climate models then the models are WRONG. This practice seems to be a continued vice in climate science.
If CO2 does produce all the heat they claim, but if most of it is going into the deep ocean, there is no catastrophic warming. It will take hundreds of years just to get one deg C.
And if CO2 doesn’t produce all the heat they claim, then there is still no catastrophic warming.
Period.
TimTheToolMan says: “700 – 2000 meters is a long way at 1300 meters depth. How exactly is the heat supposed to have diffused downward and “evenly” over that short time?”
The warming does not occur evenly at the surface or at any depth.
Regards
Bob, I did put it in quotes… they’re not saying 700- 1000 meters, they’re saying 700-2000 meters. If the heat had only diffused down say 300 meters (on average) in the last 55 years then they could have said that but instead it has diffused down the full (yes varying locally) 1300 meters.
TimTheToolMan: See Figure 3 in Levitus et al 2012:
http://data.nodc.noaa.gov/woa/PUBLICATIONS/grlheat12.pdf
Regards
I remember an interesting analogy on heating the vast oceans. I cannot recall the author, but a comparison was made between a water filled bath tub (water at air temperature) within a bathroom lit by a single lightbulb. Would a single bulb when switched on, alter the temperature of the water in the bath? I suspect not. Radiant heat would be absorbed by the air in the room. Air Convection via drafts etc would likely dissipate most of the small amount of heat.
Add a few ppm of carbon dioxide to the air in the room. Any difference in water temperature? Acidity of the water?
Lets be realistic – as the first post points out, the average ocean depth is over 4km. There is no way that measurable temperature differences caused by a fraction of a degree rise in average air temperature over a few years will affect ocean temperature. it would take a time frame of millions of years.
Because of the massive heat capacity of the Oceans the slightest % temperature uptick would represent immense heating and the slightest % downtick would represent immense cooling.
The onus is on the advocates of a significant change to justify the accuracy of their measurements otherwise they should be ignored.
Bob, figure 3 doesn’t show the heat at any particular depth, its an average for the entire 700-2000 range of depths. The point is that if we can measure as accurately as they say, then they should be able to produce a graph showing how the energy is actually moving downwards into the ocean by showing trends at particular depths and showing the net movement downwards.
The increase in thermal energy reaching the deep oceans may be hard to measure and at the limits of detectability with current methods. However it is supported by the independent methodology of measurement of the thermal expansion of the oceans raising sea level.
As usual it is the consistancy between different methods of detecting change that give certainty and robustness to the overall conclusion. Quibbling about details of one method that indicates a certain conclusion is pointless if it is validated by other methods of measurement.
izen writes “However it is supported by the independent methodology of measurement of the thermal expansion of the oceans raising sea level.”
And believes we have measurements of global sea level that are accurate enough to perform that comparison. We have very little accurate sea level data too, izen. And whether that “accurate” data is really accurate or not is even up for debate.
Izen, “thermal expansion of the ocean raising sea level”.
How do you account for tectonic changes to ocean floor? Continental drift moves ocean floor on average several centimetres a year. This is mostly horizontal but large vertical movements also occur. Clearly movement of ocean plates will have a considerable affect on sea levels.
Whether it’s sliced and diced data dung, or pureed proxy poop….these grant-fed, guano processors have a remarkable ability to cook the numbers. If you’ve at taste for satire, read “New ! Amazing ! Wrongo Proxy Crock ! ! !” posted at Canada Free Press. This article explains this new data cooker, and has some recipe tips. Bon Appetite !
TtTM, and now Jason 2 is acting up. Just why or how, I dunno, but there are fewer sea level updates posted this year.
H/t R. Starkey.
=========
If “typically most Argo floats in our present database reach a maximum observed depth of 1970 m” as described by Levitus (2012) and the average ocean depth is 4300 m then how can we say the oceans have warmed? Are we not assuming that from 1970 – 4300 m the oceans haven’t cooled – without any measurements?
izen, steric rise has been steady for a long time, preceding CO2 rise and fabulous ‘missing heat’ deep in the sea.
==========
I meant ocean floor movement of several millimetres per year not centimetres, although centimetre movements have been recorded.
This is an ocean floor ‘minnow’ but the climate change giant; a unique location with the unique properties.
http://www.vukcevic.talktalk.net/K-Ridge.htm
Izen:
” The increase in thermal energy reaching the deep oceans may be hard to measure and at the limits of detectability with current methods. However it is supported by the independent methodology of measurement of the thermal expansion of the oceans raising sea level.”
Certainly, it only requires that we have accurate data on:
1. Changes in sea-level globally
2. Changes in ground-water levels globally
3. Changes in salinity throughout the Oceans
4. Global isostatic/tectonic changes
5. Amount of ice accumulation/melt globally
6. Amount of sediment accumulation globally
30 plus years and the clock is ticking, still waiting for climate scientist to put error bars on their graphs, still waiting for greenhouse.
Planck: great point. How much do we really know about net volume changes in the global ocean basins? The coninents drift apart; where does that increased separation end up? In a slight decrease of landmass surface area as India crumples upward, etc? If the ocean basins are getting bigger, how sure are we that we know what sea surface “really” is? I ignore the problems with instrument error and gravity/surface pressure fluctuations; just interested in the net volume change as it affects the measurement of surface level.
Error bars? Natural temperature flux range? Likely, this is similar to the issue with temperature. These tiny wiggles fail to rise above error bars as well as the natural variation range. Neither one of these important components of stardard research design related to oceans or climate or weather are evident here.
Here is the thing about our oceans. We are beginning to understand oceans have climate zones and “weather pattern variation” as well as day to day fluctuations. Have we figured those out yet? Mapped them like we have our land masses at the macro and micro scale? Nope.
Cart before horse. The ivory tower has measured the cart but called it the horse. Silly ivory tower.
One more thing to consider:
The water at the bottom of the ocean is only as cool as the water downwelling in polar regions is. There is no cooling mechanism at the bottom of the ocean, there is marginal heating mechanism from the sea floor but its effect can be mostly ignored.
Now consider recent changes in the arctic and its summer reduction in ice cover. It’s very likely that this reduction is not caused by changes in air temperature, it’s rather caused by increased ocean circulation and waters warmer than before entering the northern polar region. This also means that at least half of the year, warmer water than before gets stored at the bottom of the ocean in Arctic.
Ocean does not play role of negative or positive feedback with this mechanism, it plays role of a brake. This also means that we are likely not going to get any kind of “runaway effect” any time soon as this “storage of missing heat” may go on for hundreds of years without noticeable changes.
TimTheToolMan says: “Bob, figure 3 doesn’t show the heat at any particular depth…”
Correct. But they show the warming wasn’t uniform. That was my point.
Regards