
National Weather Service, Anchorage Forecast Office issued this today:
NOAK48 PAFC 032215 PNSAFC
PUBLIC INFORMATION STATEMENT NATIONAL WEATHER SERVICE ANCHORAGE AK 215 PM AKDT THU MAY 3 2012
…RECORD SEA ICE AT PRIBILOF ISLANDS…
THIS HAS BEEN AN EXTREME WINTER FOR SEA ICE IN THE BERING SEA AND NOW WE HAVE BROKEN THE RECORDS FOR MOST NUMBER OF DAYS WITH ICE AT BOTH SAINT PAUL ISLAND AND SAINT GEORGE ISLAND.
AS OF TODAY SEA ICE HAS BEEN AT SAINT PAUL ISLAND FOR 103 DAYS THIS WINTER BREAKING THE PREVIOUS RECORD OF 100 DAYS SET IN 2010.
THE NUMBER OF DAYS WITH SEA ICE AT SAINT GEORGE ISLAND TOTALED 79 WHEN THE ICE RETREATED NORTH ON THE 25TH OF APRIL. THE PREVIOUS RECORD OF 60 DAYS WAS SET IN 2010.
THE SEA ICE EDGE TODAY IS WELL SOUTH OF SAINT PAUL ISLAND AND ICE IS LIKELY TO REMAIN AT THE ISLAND THROUGH THE MIDDLE OF MAY.
THE SEA ICE IS NORTH OF SAINT GEORGE ISLAND TODAY BUT ICE IS FORECAST TO PUSH SOUTH OF THE ISLAND OVER THE WEEKEND DUE TO COLD NORTH WINDS.
THE NATIONAL WEATHER SERVICE ALASKA SEA ICE PROGRAM BEGAN ARCHIVING DATA IN THE MID 1980’S. SEA ICE DATA PRIOR TO THIS IS VERY LIMITED AND INCONSISTENT.
KCOLE 2012
$$
Source:
h/t to Marc Morano
==============================================================
From NSIDC – April Sea Ice Summary http://nsidc.org/arcticseaicenews/
Arctic sea ice reaches near-average extent in April
Arctic sea ice extent declined slowly through the first three weeks of April, compared to recent years. The slow decline through March and the first few weeks of April meant that by mid-April, ice extent was at near-average levels. However, much of the extensive ice cover is thin ice that will melt quickly once temperatures rise in the Arctic. Over the past week, extent has started to fall sharply.

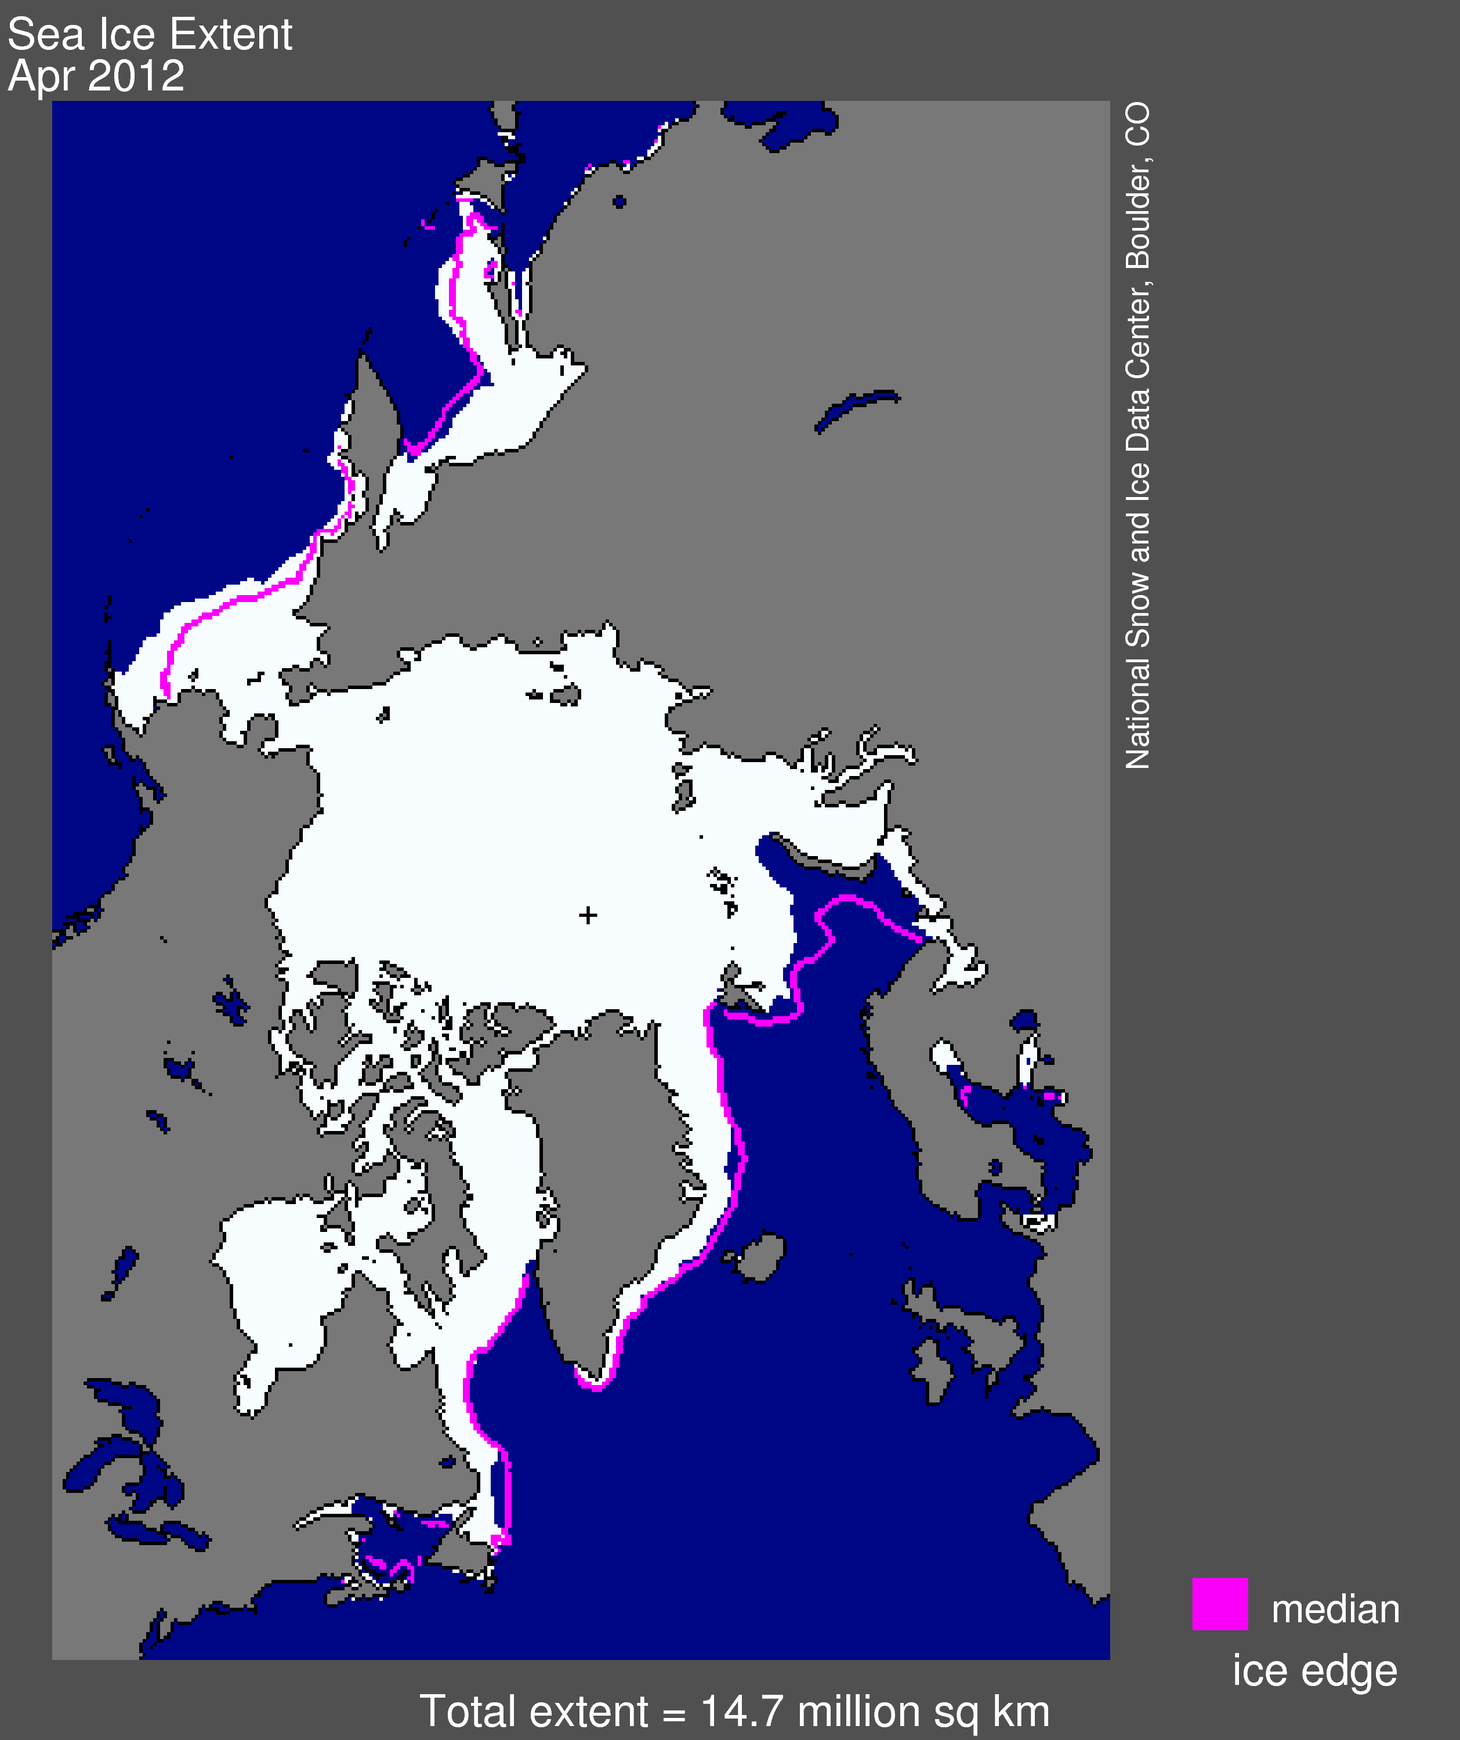
Figure 1. Arctic sea ice extent for April 2012 was 14.73 million square kilometers (5.69 million square miles). The magenta line shows the 1979 to 2000 median extent for that month. The black cross indicates the geographic North Pole.Sea Ice Index data. About the data
Credit: National Snow and Ice Data Center
Overview of Conditions
Arctic sea ice extent in April 2012 averaged 14.73 million square kilometers (5.69 million square miles). Because of the very slow rate of ice loss through the last half of March and the first three weeks of April, ice extent averaged for April ranked close to average out of 34 years of satellite data. It was the highest average ice extent for the month since 2001, only 270,000 square kilometers (104,000 square miles) below the 1979 to 2000 average extent. April ice extent was 860,000 square kilometers (330,000 square miles) above the record low for the month, which happened in 2007.
In April, ice cover remained unusually extensive in the Bering Sea, continuing a pattern that persisted over the winter. Ice extent was also slightly higher than average in Baffin Bay and part of the Sea of Okhotsk. As in recent winters, ice extent was well below normal in the Barents Sea, compensating for the extensive ice in the Bering Sea.
As discussed in previous posts, the high Bering Sea ice extent this winter stemmed from unusually low air temperatures and persistent winds that helped to push ice southwards. During April, atmospheric conditions changed, warming the air to near-average temperatures for this time of year and slowing the strong southerly winds.
During April, air temperatures over most of the Arctic were higher than usual, particularly over the central Arctic Ocean. Over the Bering Sea and parts of the East Greenland and Norwegian seas, temperatures ranged from average to slightly below average.

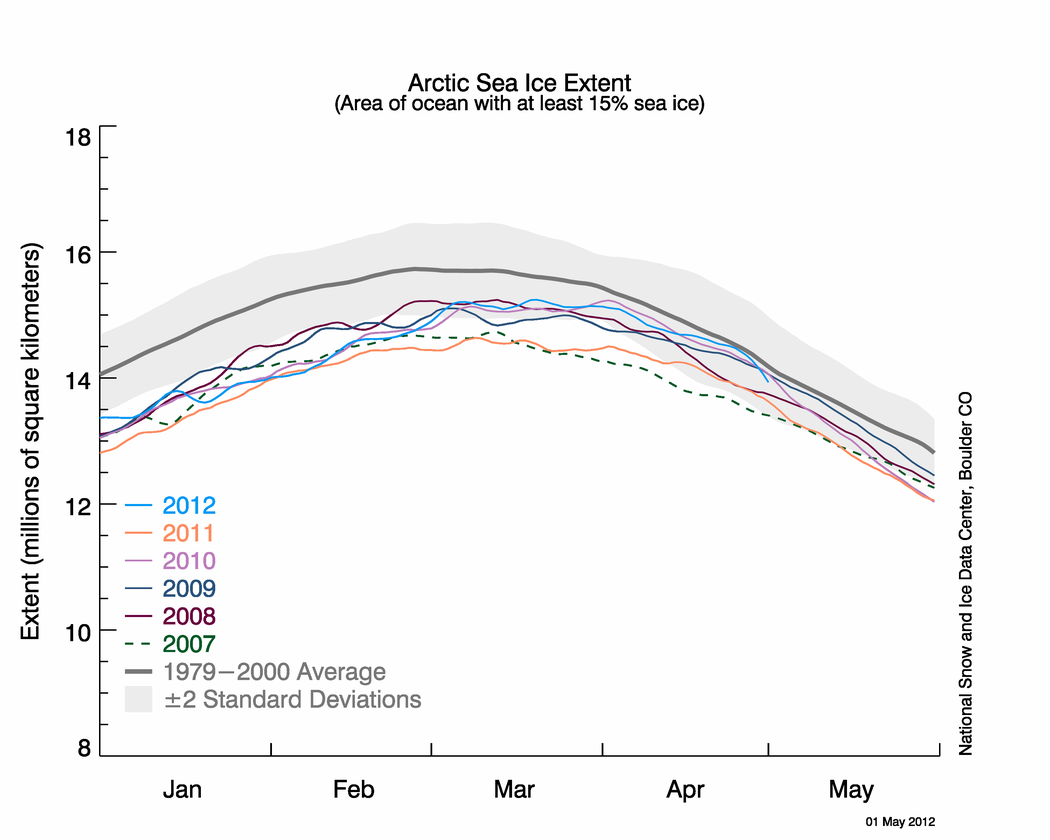
The graph above shows Arctic sea ice extent as of May 1, 2012, along with daily ice extent data for the previous five years. 2012 is shown in blue, 2011 in orange, 2010 in pink, 2009 in navy, 2008 in purple, and 2007 in green. The gray area around the average line shows the two standard deviation range of the data. Sea Ice Index data.
Credit: National Snow and Ice Data Center
Conditions in context
Overall, the Arctic lost 1.07 million square kilometers (413,000 square miles) of ice during April, somewhat less than the 1979 to 2000 average April loss of 1.21 million square kilometers (467,000 square miles). The average daily rate of ice loss was 35,600 square kilometers (13,700 square miles) per day. On April 24, ice extent was only 118,000 square kilometers (45,6000 square miles) below the 1979 to 2000 average for that day, although the difference has increased since then.
While ice conditions approached the 1979 to 2000 average levels for this time of year, the high ice extent will have little influence on how much ice melts this summer. Much of the ice cover is recently formed thin ice that will melt out quickly. Research has shown that sea ice extent in spring does not tell us much about ice extent the following summer. More important to the summer melt is the thickness of the ice cover, and summer weather.

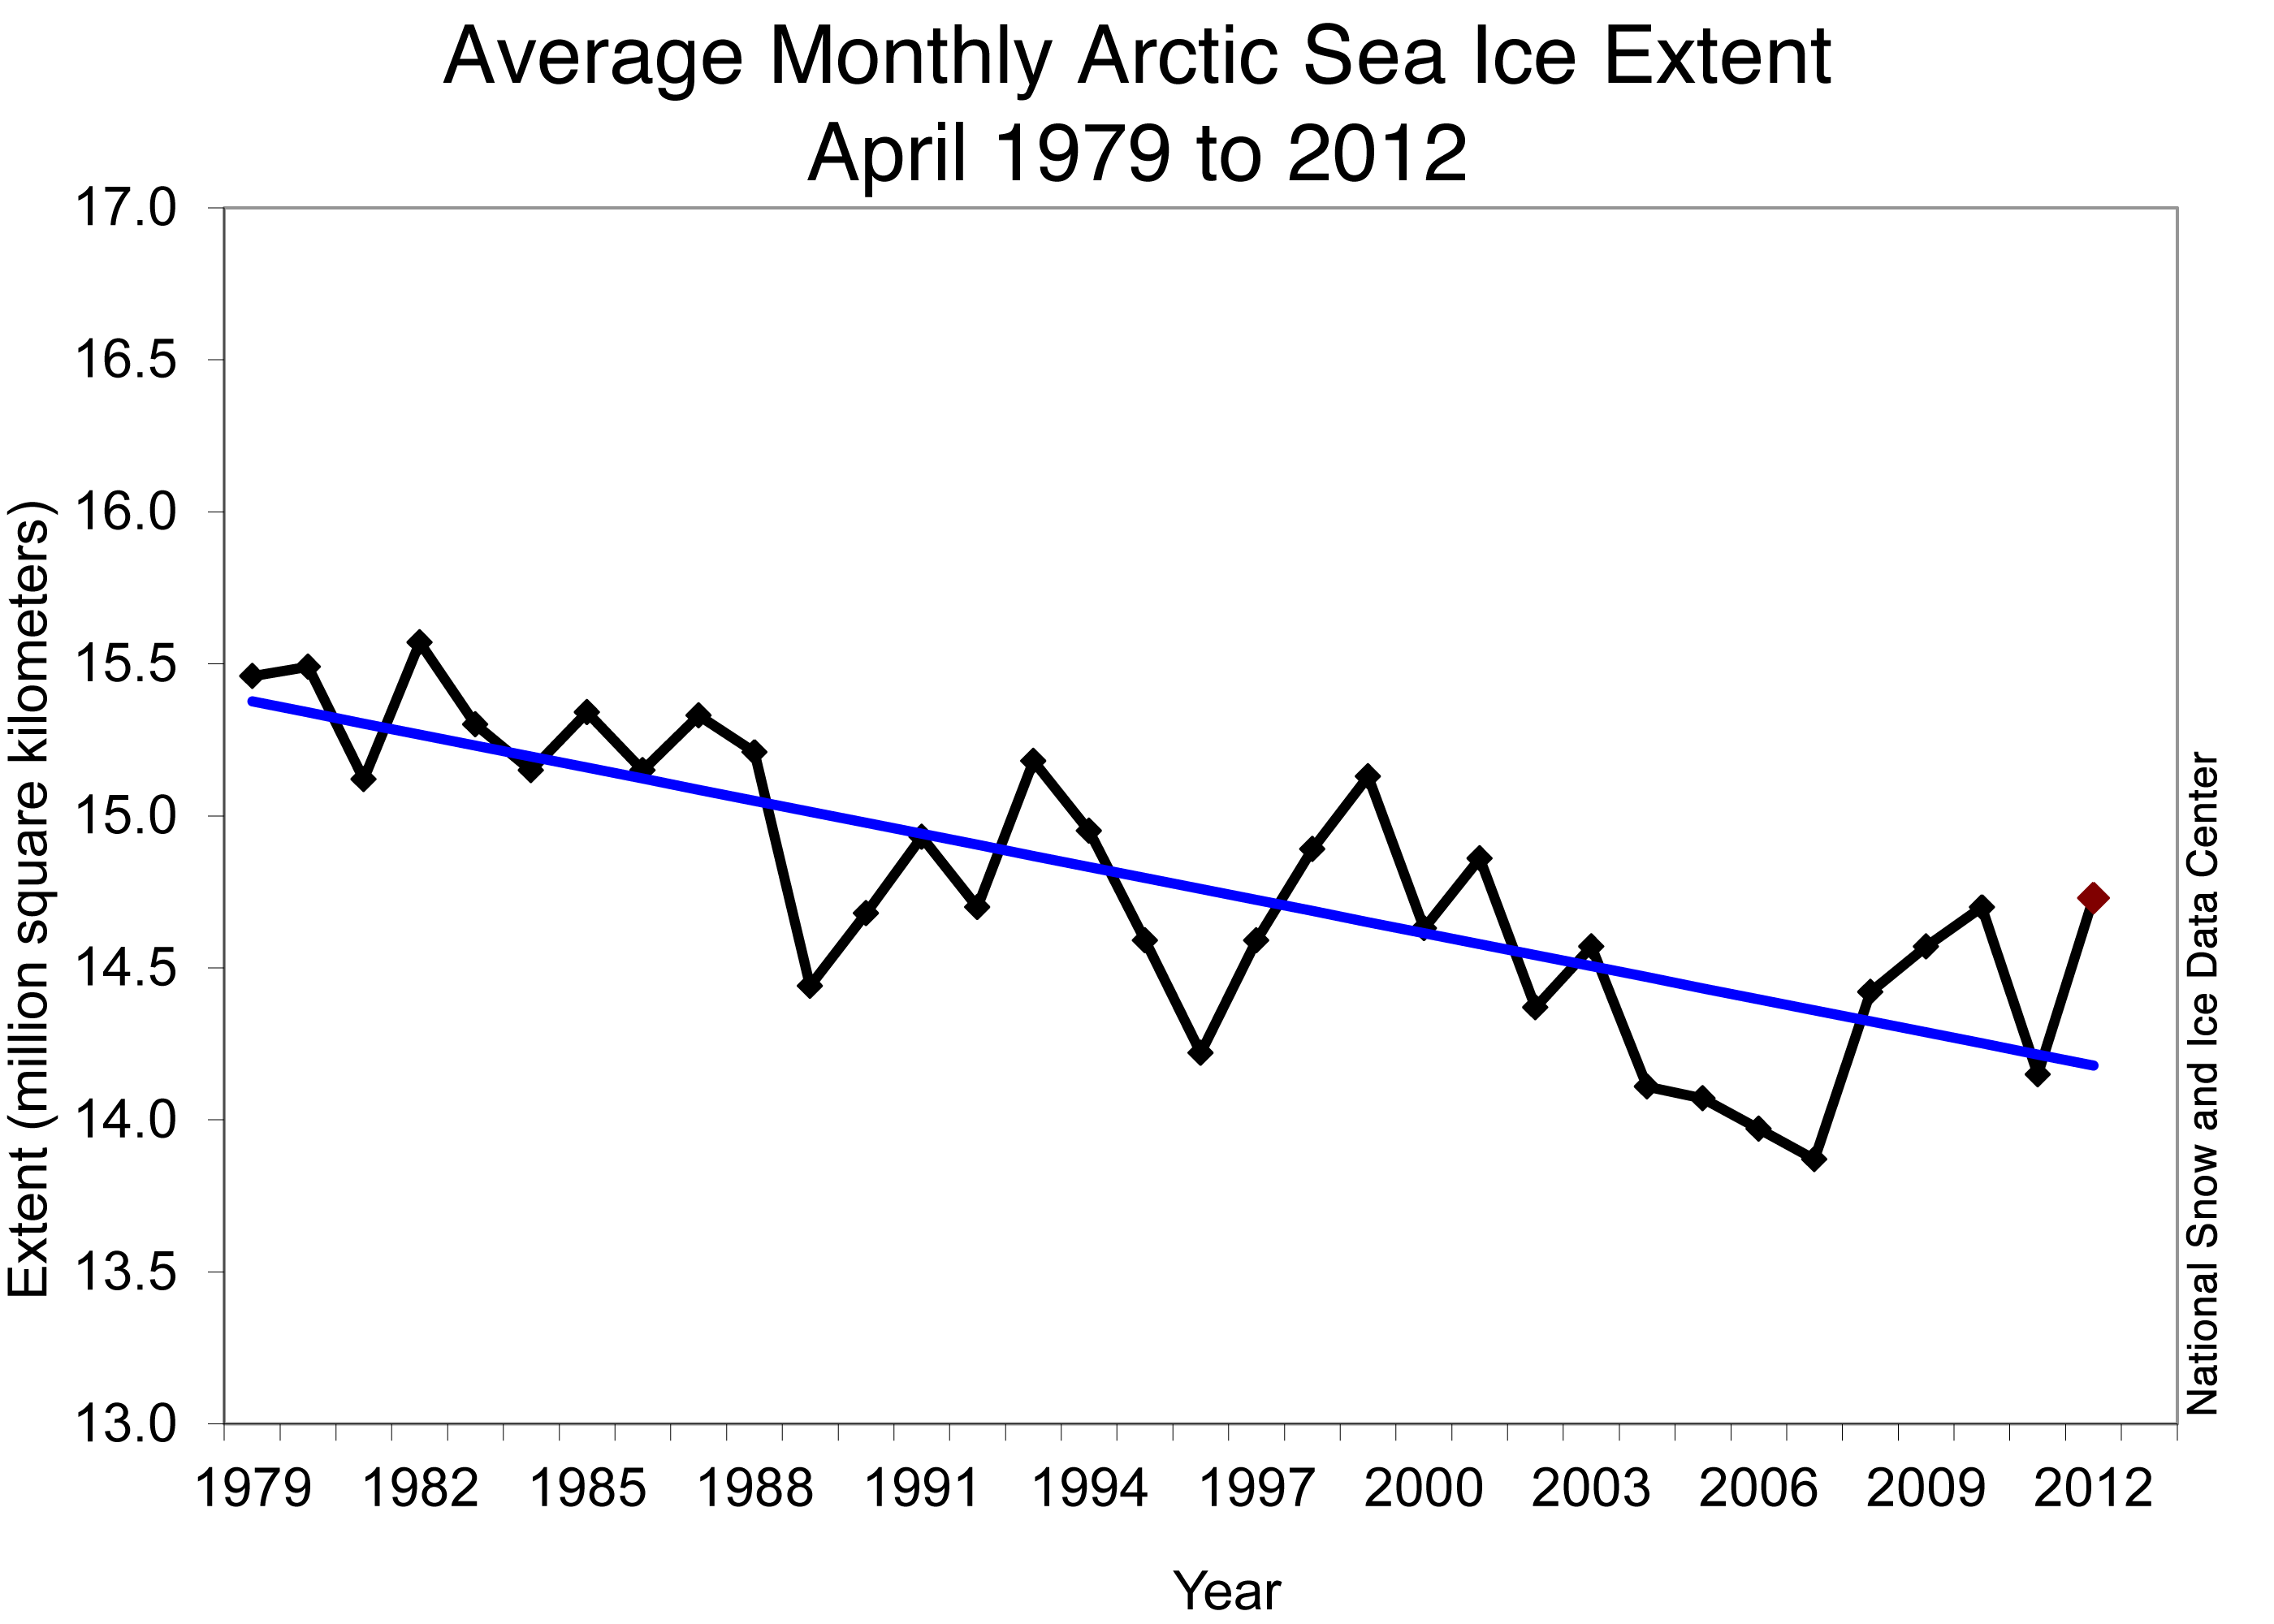
Figure 3. Monthly April ice extent for 1979 to 2012 shows a decline of 2.6% per decade.
Credit: National Snow and Ice Data Center
April 2012 compared to past years
Arctic sea ice extent for April 2012 was near average for the month in the satellite record, but was the highest since 2001. Including the year 2012, the linear rate of decline for April ice extent over the satellite record is 2.6% per decade.

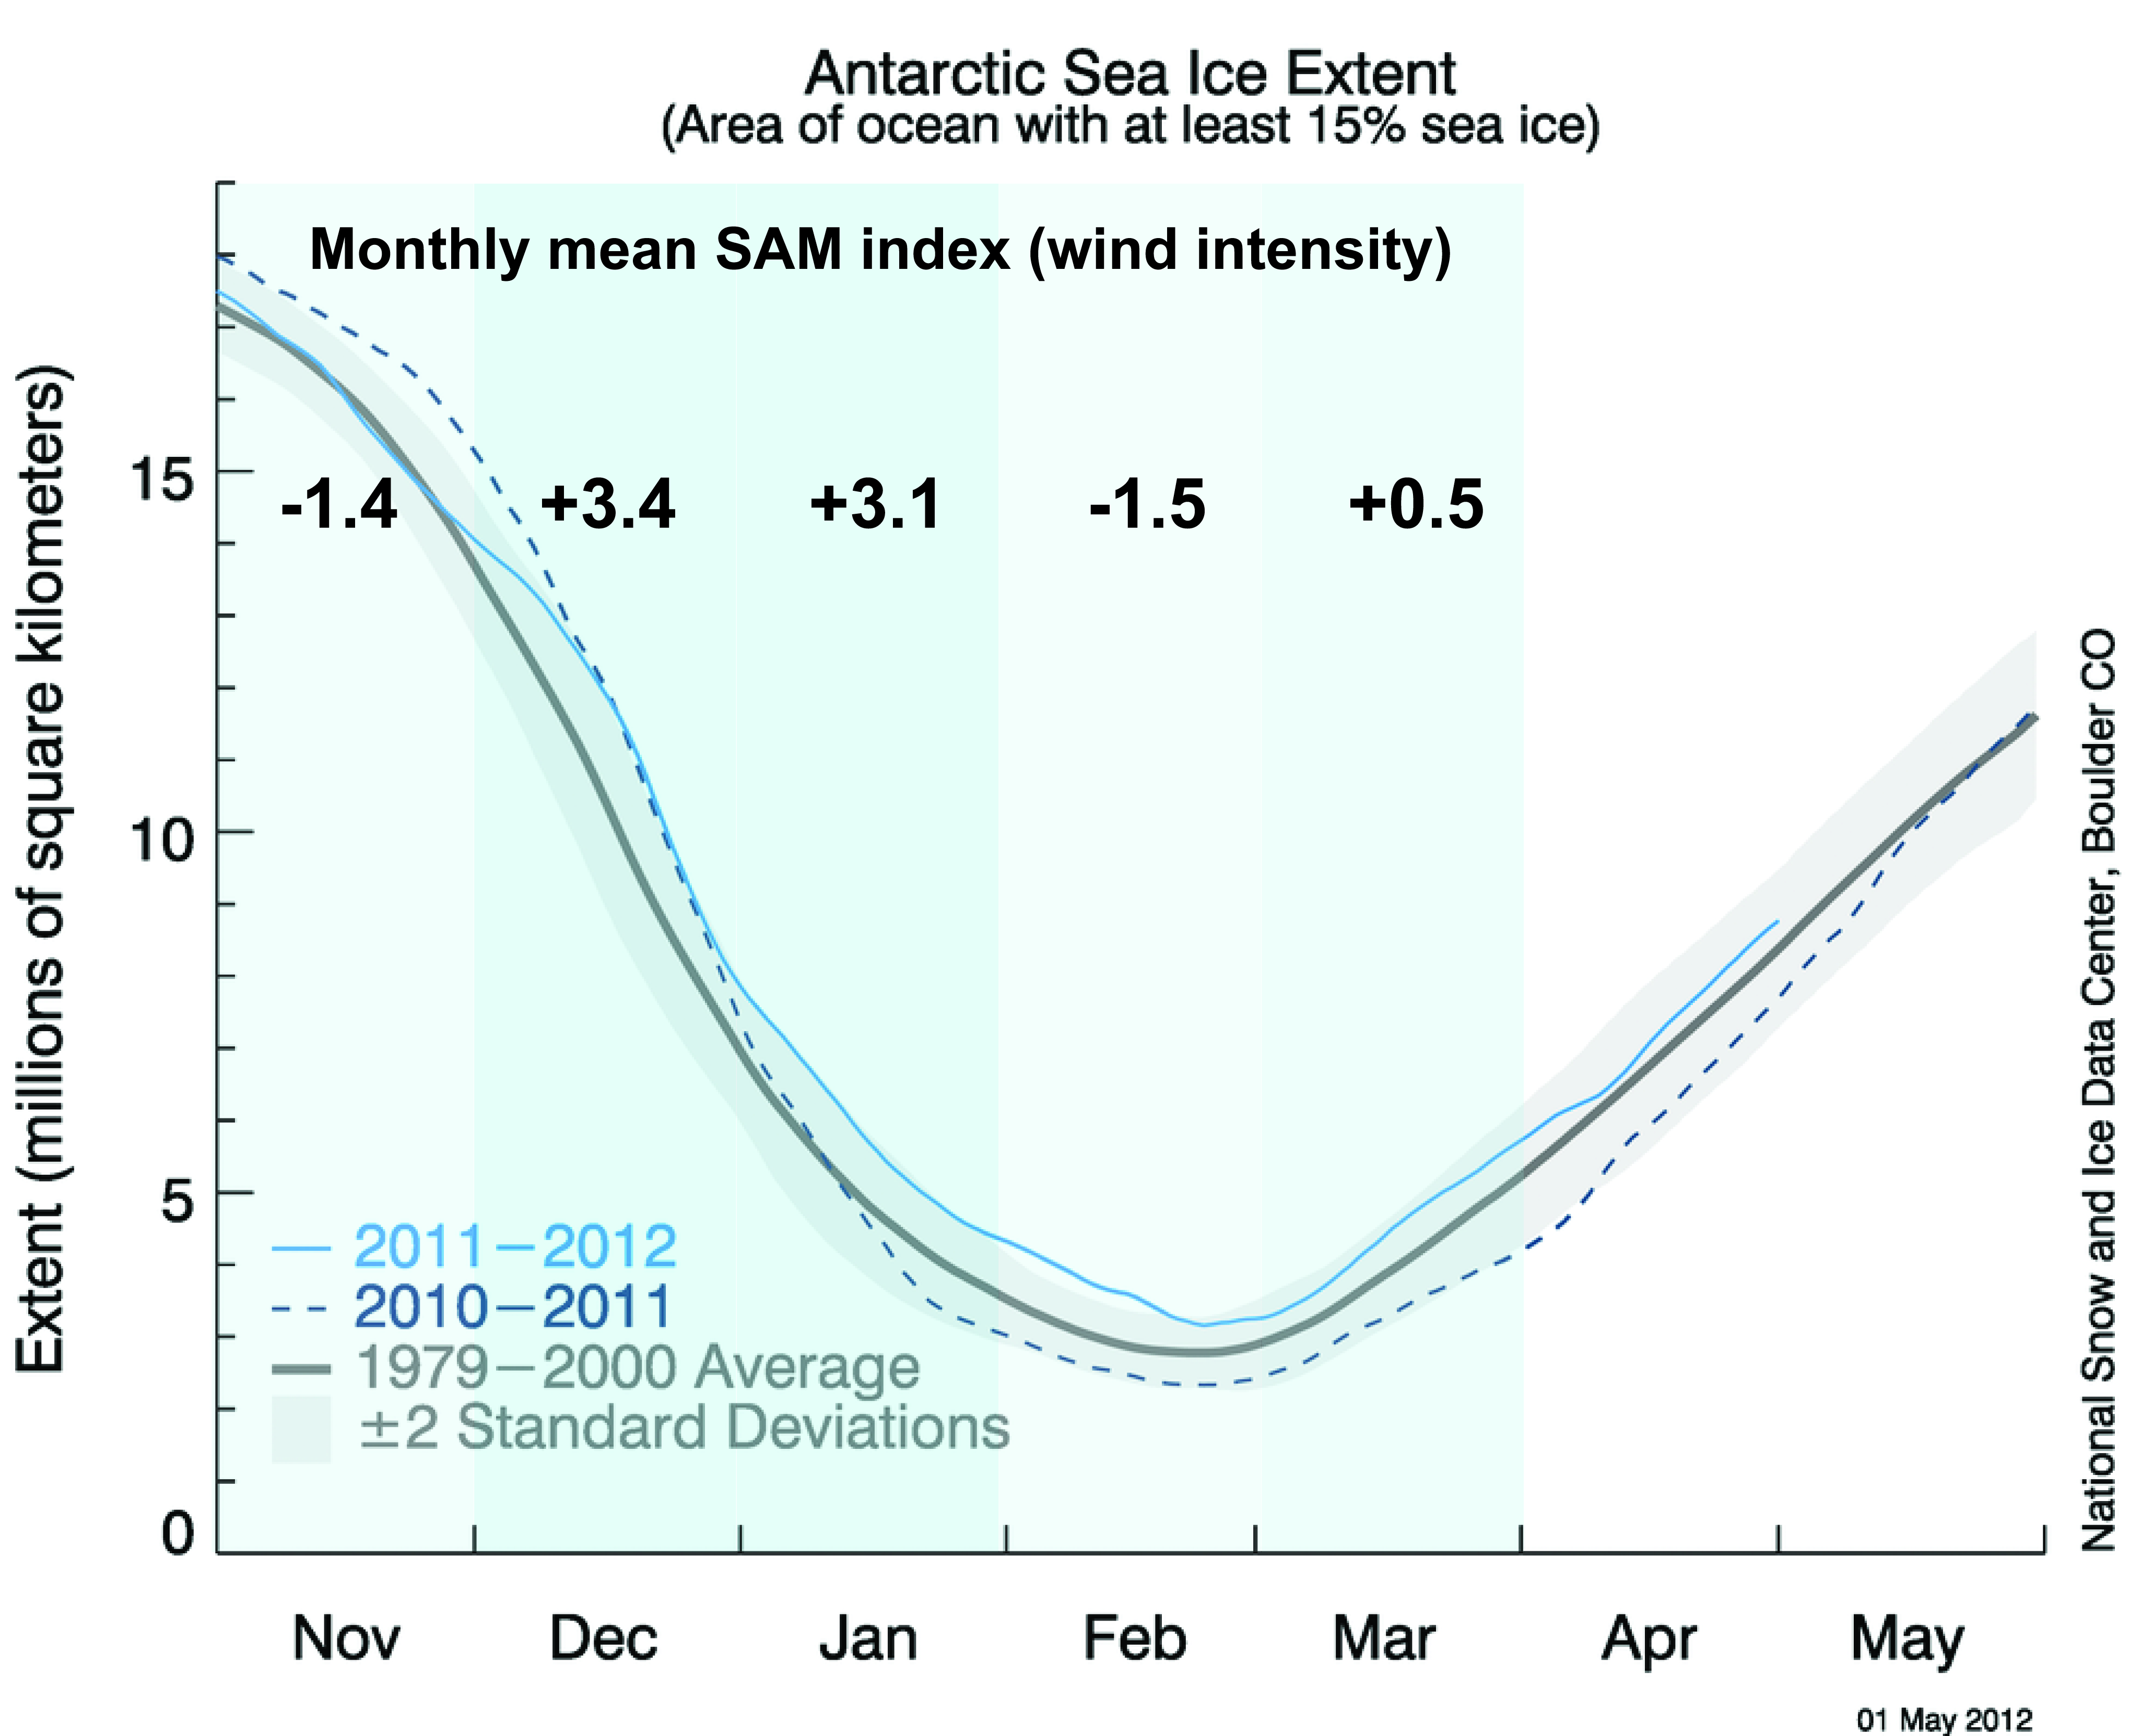
Figure 4. This graph shows Antarctic sea ice extent as of May 1, 2012 (light blue line), along with the average ice extent and the ice extent from last year (dark blue). The average Southern Annular Mode (SAM) index number for each month is overlaid on the image. A stronger SAM correlates to stronger winds, which help to spread the sea ice and increase ice extent.
Credit: National Snow and Ice Data Center
Antarctic sea ice spread by strong winds
The sea ice cover that surrounds the continent of Antarctica has been higher than average through most of the Southern Hemisphere summer (December to March). Ice extent declined much more slowly than usual in late November and remained above average through December and January, although it did not reach record highs for those months. At its minimum extent in March, Antarctic sea ice remained above average. Ice extent was the highest in the Weddell Sea and the northwestern Ross Sea.
The high ice extent likely stemmed from unusually strong winds that circled the continent of Antarctica during most the southern summer. These circumpolar winds tend to push the ice out from the continent, increasing the extent of the ice, although not necessarily the volume. Air temperatures in December and January were close to average over most of the sea ice-covered water. Researchers approximate the circumpolar wind intensity by an index called the Southern Annular Mode (SAM). A positive value for SAM indicates strong circumpolar winds around the continent; negative values indicate weaker winds. This index was at a record high for the two months of December 2011 and January 2012, at the same period of the higher-than-normal seasonal extents. For more information on Antarctic sea ice, see the NSIDC Icelights article: Sea ice down under: Antarctic sea ice and climate.

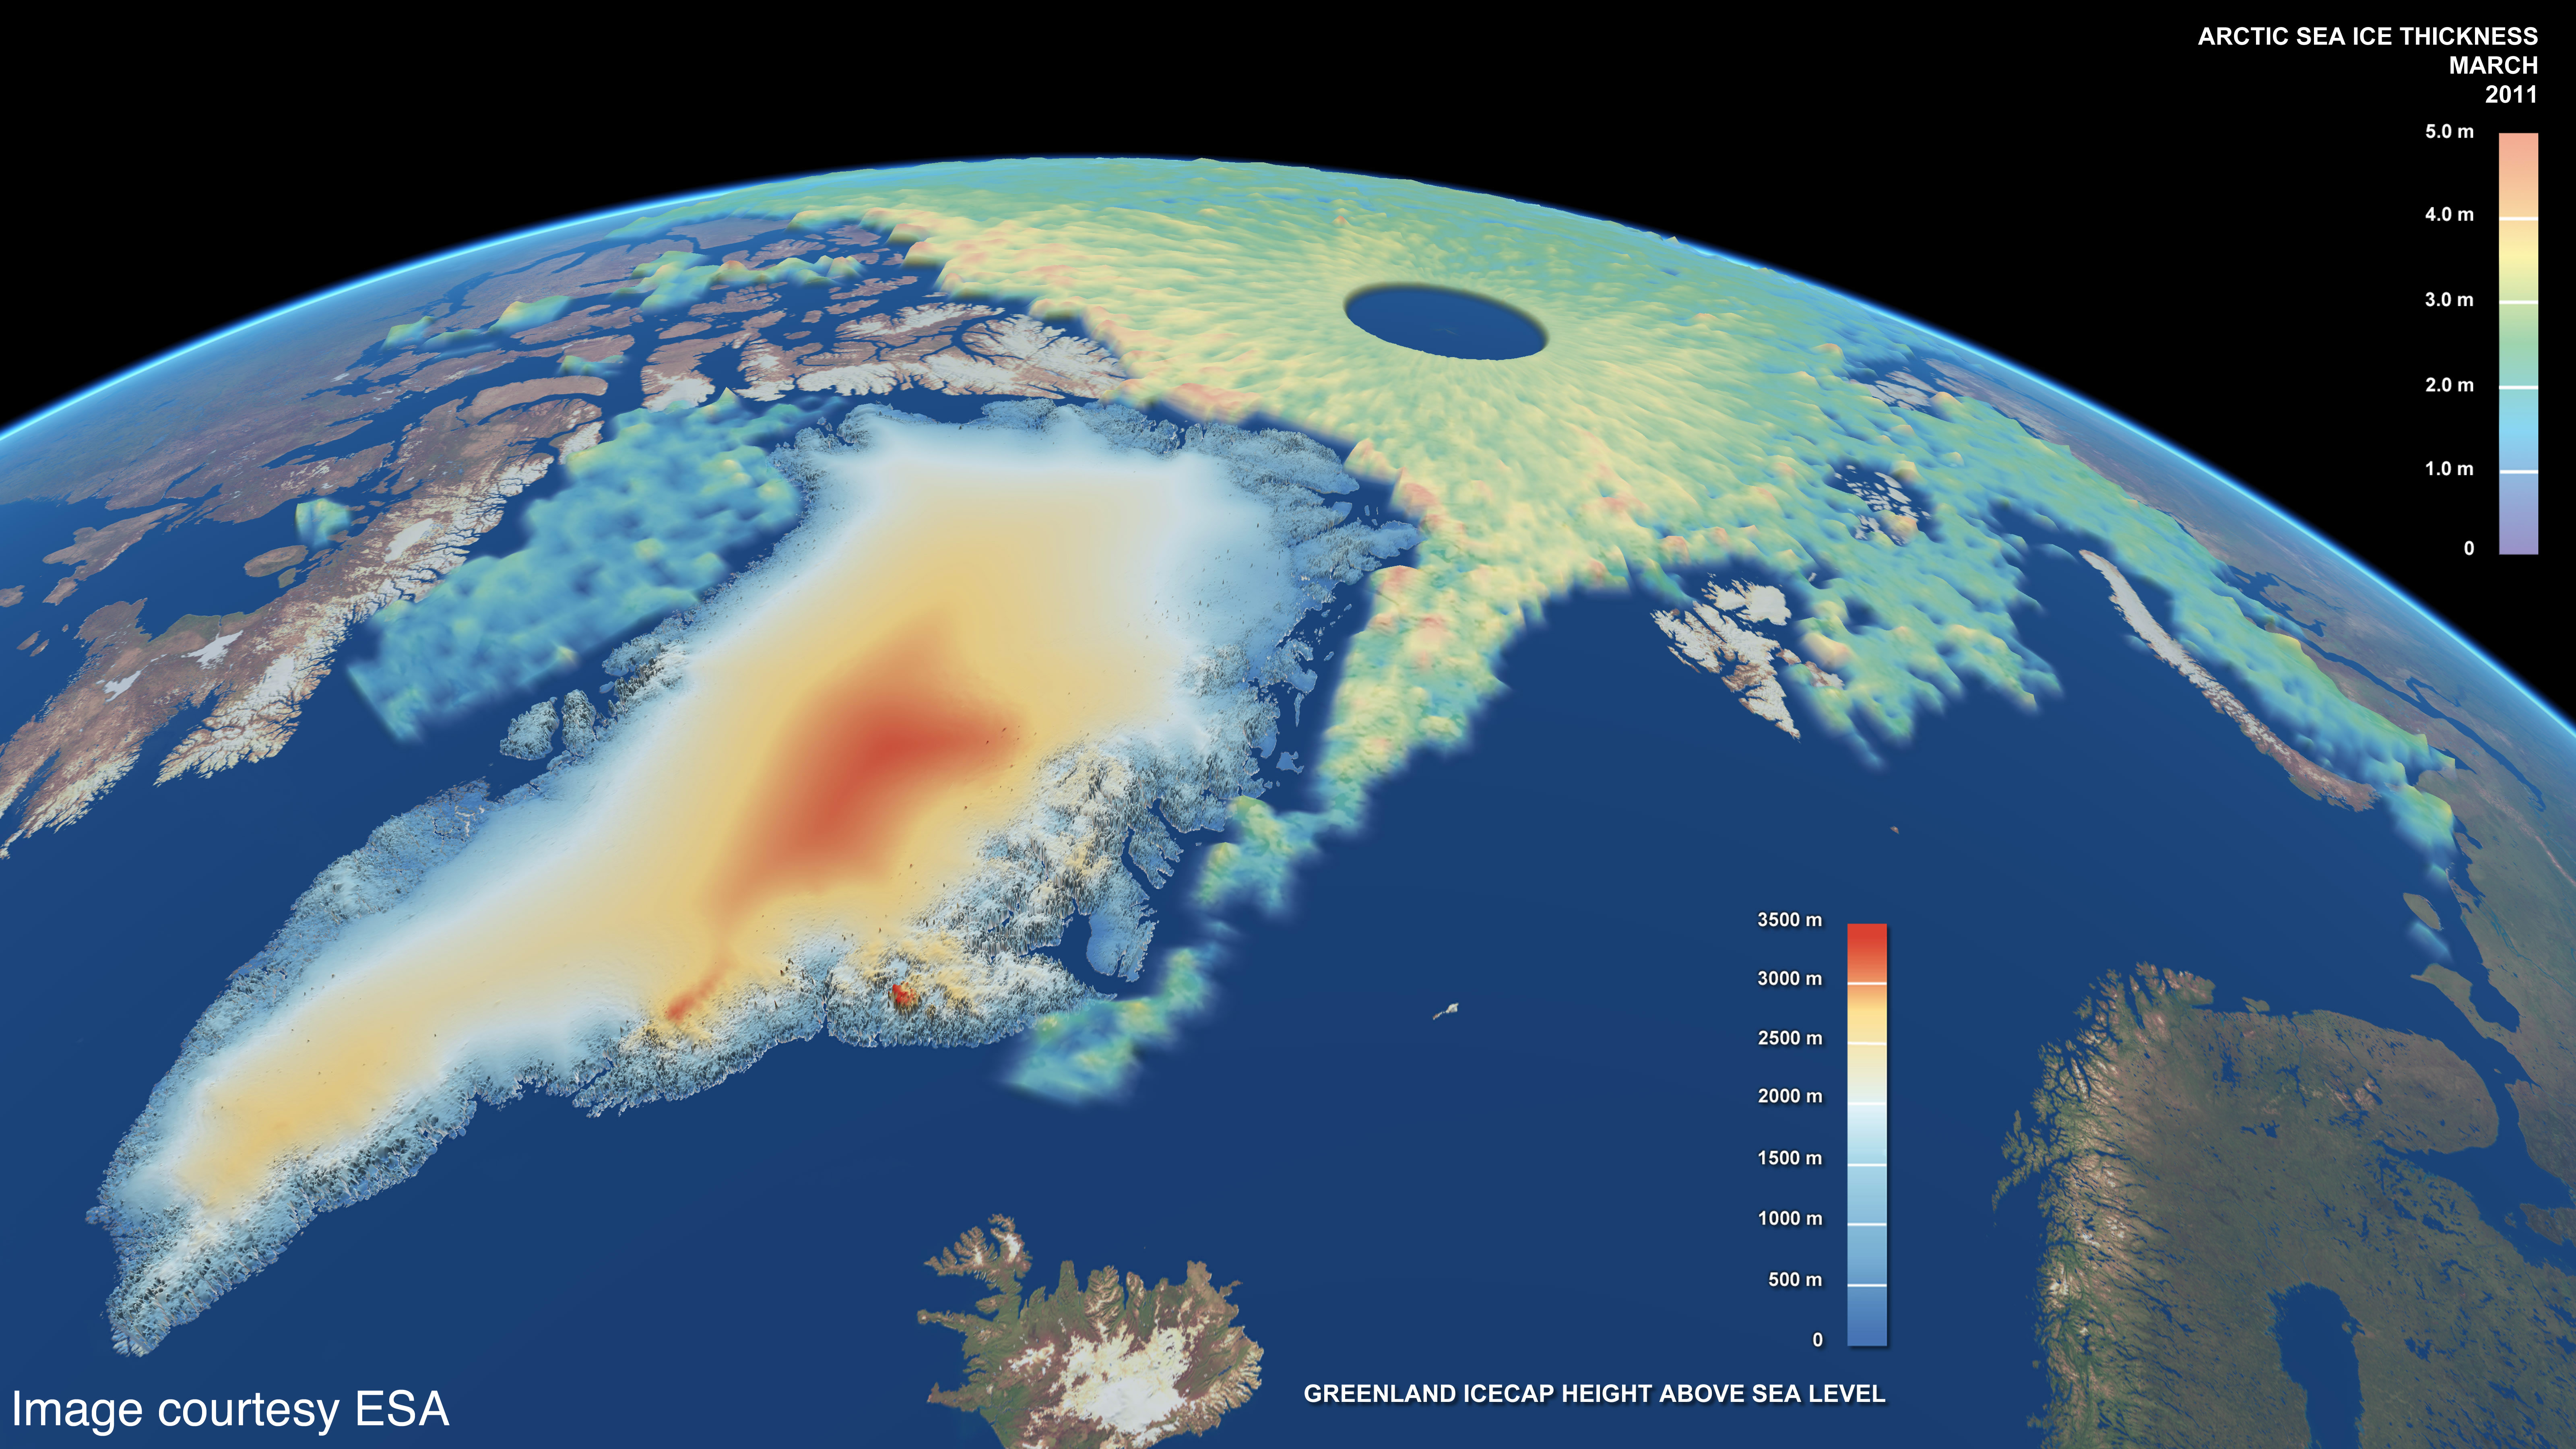
Figure 5. This map shows Arctic sea ice thickness, as well as the elevation of the Greenland Ice Sheet, for March 2011. The data come from the European Space Agency CryoSat-2 satellite. For the sea ice, green shades indicate thinner ice, while the yellows and oranges indicate thicker ice.
Credit: NSIDC courtesy CPOM/UCL/Leeds/ESA/PVL
Cryosat provides new ice thickness data
NSIDC data provide a long-term record of the Arctic and Antarctic sea ice cover. But researchers also want to know how thick the ice cover is, since thinner ice melts faster than thicker ice. Ice thickness measurements are more limited than ice extent, because researchers can only sample small regions in person, and there have only been a few satellite sensors that can measure ice thickness. For example, the NASA ICESat satellite recorded Arctic sea ice thickness between 2003 and 2008, but the mission ended in 2009, and the follow-on mission is not expected to begin until 2016. In the meantime, NASA is filling some of the data gap with airplane-borne instruments as part of Operation IceBridge.
The European Space Agency (ESA) has released initial data from the radar altimeter on their CryoSat-2 satellite. Last week, ESA released the first calibrated maps of Arctic sea ice thickness capturing thickness changes through the winter from October 2010 through March 2011. In the coming years, CryoSat-2 will provide monthly fields of thickness that will allow scientists to track the evolution of the ice cover. For more information on CryoSat-2 and an animation of the thickness maps, see: http://www.esa.int/SPECIALS/Cryosat/SEMU55NW91H_0.html.
I’m a little bothered by Figure 3. The initial data point begins in 1979 — when the decadal warming began. If the beginning of the data sent went back to 1973 when it was colder than 1979, I suspect the slope of the blue line would be rather flat.
So the cork is being placed into position?
Let us see what happens on the other side in the Fram, with respect to wind direction, over the coming months.
It will be interesting, none the less.
Is change upon us? It would do you good, no?
For entertainment purposes only 🙂
“Sea ice record” is very misleading. Extent is but one of, and the least important of several measures of sea ice.
What is the area? What is the volume? By how much is the multi-year ice increasing?
There appears to be another glaring error on the NSIDC page about arctic sea ice. Look at these two images: http://nsidc.org/data/seaice_index/images/daily_images/N_stddev_timeseries.png & http://nsidc.org/arcticseaicenews/files/2012/05/Figure2.png – How come one practically touches the mean and the other never gets close?
Furthermore, how can the mean be different for 1979-2000 in both images?
Were the any graphs in the Hansen-inspired Chicken Little years of the Ice Age Scare showing the ice-extent getting bigger by X percent each year? It was “worse than we thought” then, just as now, just in the opposite direction…
Now that I think of it, I was a total believer in those Chicken Littles of the 70’s… Man, I would have made a great ‘Greeniac’ for the enviros if only they had changed their insanely monotonous screed of, “Oh, poor broken earth, so fragile and so So SO enDANGERED by evil Evil EVIL mankind – ’twas the twin monsters GROWTH and PROSPERITY what ‘dun her in’, so stop all that smarty guy stuff – Gaia commands it!!” After 30 unchanging years and NONE of their calamities coming true, I began to suspect their motives… And what I read again and again was that stupid emotional rhetoric trumps real-world measurements every time in the political world where things get done and laws get passed.
Its worse then they thought, the decline in yearly ice needs to be frozen in the charts.
My former brother-in-law was a grade school teacher in White Mountain, Alaska (look it up), he told me about some folks who would walk back & forth from AK to Russia across the Bearing sea ice…..he laughed about how dangerous it was, considering the polar bears that were on the prowl!
While ice conditions approached the 1979 to 2000 average levels for this time of year, the high ice extent will have little influence on how much ice melts this summer. Much of the ice cover is recently formed thin ice that will melt out quickly.
Older multi-year ice is melting significantly faster than new ice.
http://www.nasa.gov/topics/earth/features/thick-melt.html
And we cannot measure ice thickness and hence volume with any precision. Talk about ‘thin ice’ and ice volume’ is speculation in the absence of data, masquerading as science.
Still shows ice in Denmark where there is none…
I knew this by watching the show ‘Deadliest Catch’
🙂
Over the years I’ve gained the impression that there isn’t much melting inertia in polar ice, that is, a place has ice cover depending on the immediate conditions and not because the ice cover is taking a long time to melt or form. So the open water NW of Nova Zemlya doesn’t portend an early melt north of there — it’ll melt when it’s warm enough not to have ice cover.
By the way, Bering Sea ice junkies can get their fix here: http://pafc.arh.noaa.gov/ice.php
“Extent is but one of, and the least important of several measures of sea ice.”
Wrong.
While volume is interesting, the records are much more disputed as the data is shorter and you have to make more assumptions to generate the answers. If the ice is higher, how much is rebound from less ice weight and how much due to extra ice? Submarine voyages do not cover the same locations in a repeatable manner. Combining an under the ice voyage in 1963 with 1964 requires modelling Plotting the edge is by nature easier to do and partial records are more useful. Ship records go back hundreds of years.
I’m curious. Not being of scientific mind, I do notice a lot of local ice monitoring data being quoted & bandied about through various media – Arctic, Antarctic, Greenland, etc. Is anybody observing & compiling an annual global ice record, i.e. following the ice trends & patterns of the entire earth? Wouldn’t that be more relevant, considering the climate change furore is supposed to be a global phenomenon?
DMarshall says:
May 3, 2012 at 9:07 pm
“Sea ice record” is very misleading. Extent is but one of, and the least important of several measures of sea ice.
What is the area? What is the volume? By how much is the multi-year ice increasing?
To find the area, you first need to know the extent, so that’s not exactly the “least important” measure, now, is it?
I am completely confused, the graphic for this report shows this year not hitting the median, yet the same graph linked from your sea ice reference page shows it just touching the median. Looking at the two graphics it appears the 1979 – 2000 median has magically gained approx 200k sq km for this report…
The chart from this report:
http://nsidc.org/arcticseaicenews/files/2012/05/Figure2.png
The chart from the sea ice page
http://nsidc.org/data/seaice_index/images/daily_images/N_timeseries.png
Someone is playing funny buggers at NSIDC!!!
@eljay says:
May 4, 2012 at 12:55 am
(Asks about global sea ice)
You’ve landed at the right place, eljay. Look up at the top RH of this (or any) and just below the ENSO meter is the Sea Ice page. Click on that and the first thing up is global sea ice info. Enjoy!
No surprise to me. I have been saying it has been cooling since 1994.
(note I have two weather stations from around Anchorage)
http://www.letterdash.com/henryp/global-cooling-is-here
Regardless of what this report is saying, it’s just obvious that all the AGW guru’s predictions the last 20yrs are a big failure. It’s becoming very obvious that natural factors are the rule of nature not man. It’s especially noticeable since the PDO has flipped. Why isn’t this just accepted?
All I know is that we in the UK are getting freezing winds from the Arctic which are completely ruining our early May weather (I nearly said ‘climate’..!)….
Haven’t been in the pool since the back end of March..!
I don’t care about no fancy schmancy satamalite doohickey, Rosie O’Donnel sez the ice is meltin and them thar bears are dyin’. Rosie must know best because she’s famous and yells stuff.
This year’s arctic ice extent is clearly behaving normally if we consider ‘after 2007’ the new ‘normal’. Bering sea is just having an equivalent of a cold wave.
And yes I agree nsidc has clearly more outputs to fix. Their 1979-2000 means are going all over the place.
Simon F. says:
Look at these two images: http://nsidc.org/data/seaice_index/images/daily_images/N_stddev_timeseries.png & http://nsidc.org/arcticseaicenews/files/2012/05/Figure2.png
How come one practically touches the mean and the other never gets close?
Furthermore, how can the mean be different for 1979-2000 in both images?
Mark Serreze, the director of NSIDC is a true believer in CAGW. True believers in CAGW are not scientists. Although they often possess advanced scientific degrees, they either refuse or are unable to follow the scientific method. Their failure to be scientifically objective disqualifies them as scientists.
The simplest explanation is that the empirical data indicates they may be wrong, so they changed it. It appears the NSIDC blatantly manipulated the data to hide the fact that Arctic is not in a “Death Spiral”. If this is not the case, the NSIDC needs to explain the glaring discrepancies between these graphs immediately.
So with the higher than normal Bearing Sea ice, how’s the Anchorage fuel supply holding out?