A strange juxtaposition in the news today about our older generation, carbon dioxide, and climate change. It seems the past 60 crowd produce less CO2 in their activities than the rest of us. It seems they also believe it affects climate less than say, generation X. Here’s both stories:
From Tom Nelson:
Pew: Among Americans aged 66 to 83, only 22% say that global warming is caused mostly by human activity. Section 8: Domestic and Foreign Policy Views | Pew Research Center for the People and the Press
Millennials are almost twice as likely as Silents to say that global warming is caused mostly by human activity (43% vs. 22%).

From the Max Planck Institute:
Individual CO2 emissions decline in old age
Ageing could influence climate change
November 07, 2011
New demographic analysis reveals that the CO2 emissions of the average American increase until around the age of 65, and then start to decrease. For the United States this means that, although the ageing of the population will lead to a slight overall rise in CO2 emissions over the next four decades, the long-term trends indicate that increasing life expectancy will result in a reduction in emissions.
 Zoom image
© MPIDR, Emilio Zagheni
For the first time, demographer Emilio Zagheni of the Max Planck Institute for Demographic Research in Rostock (MPIDR) has calculated a profile that illustrates the relationship between age and average per capita CO2 emissions. This profile applies to U.S. citizens, as data for this group were easily accessible. But the demographic-economic model developed for the analysis is universally valid, and can be applied to other countries.
Carbon dioxide projections, like those of the Intergovernmental Panel on Climate Change (IPCC), depend greatly on future population developments. Most projection models only take into account the anticipated size of populations, but not their age composition, which will change considerably as life expectancy increases. According to the United Nations, the worldwide share of people aged 65 and older will grow from around eight percent currently to around 13 percent by 2030.
Zagheni’s profile suggests that societies with a growing share of elderly people will tend to produce lower CO2 emissions—at least in developed countries with consumption patterns similar to those of the U.S.A. This is because people appear to do less damage to the climate after the age of 65. As they enter retirement, Americans are producing more carbon dioxide emissions than at any other point in their lives: i.e., around 14.9 metric tons per person annually. Thereafter, the amount produced decreases continuously, falling to 13.1 metric tons by age 80. No data are available for higher ages, but it is expected that emissions fall further. The impact of this age group on climate projections will be significant. This is because, while life expectancy in the U.S. is currently (2010) 78.3 years, it is projected to rise to 83.1 years by 2050, according to the U.S. Census Bureau. Moreover, life expectancy is expected to be even higher in other developed countries.
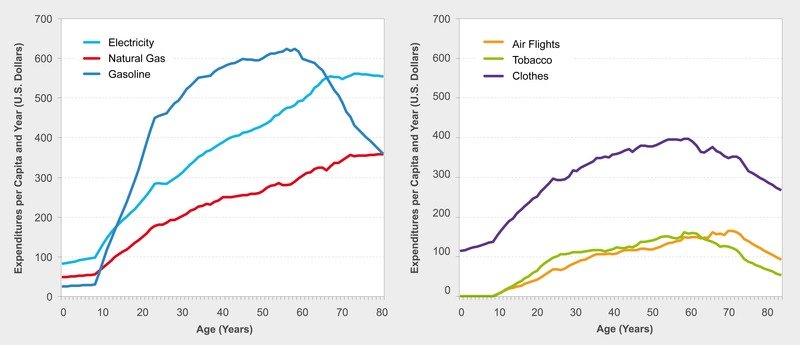
In order to calculate the per capita emissions profile, Zagheni compiled figures on how many dollars an average U.S. residents spend at different ages on nine energy-intensive—and thus CO2-intensive—products and services, including electricity, gasoline, and air travel. By assigning carbon dioxide emissions weights to the consumption of these goods, he combined the nine consumption profiles to produce a single CO2 profile.
 Zoom image
© MPIDR, Emilio Zagheni
The per person expenditures in the nine areas change considerably over the course of life (see Figure 2). First they increase with age, along with income: middle-aged adults fly and drive cars more frequently than young people, and they use more electricity. But as people grow older, this trend often changes. The elderly spend more on average than younger adults, but a growing share of their consumption is devoted to their health. Thus, a double effect can be observed: health care services generally produce low levels of greenhouse gas emissions; and, as less money is available for energy-intensive goods, older people tend to spend less in these areas. Clothing expenditures start to decline at age 58, and gasoline consumption decreases from age 60 onwards—a sign that older people start to reduce their driving relatively early. However, because they spend more time at home, the consumption of electricity and natural gas rises among the elderly until they reach age 80. Only then does home energy usage appear to reach a plateau.
Electricity and natural gas have the greatest impact on the per capita emissions profile, as CO2 emissions are the highest per U.S. dollar spent for these types of energy. Electricity produces 8.7 kilograms of carbon dioxide per dollar (kg CO2/$), and thus tops Zagheni’s list of climate-killers. This is followed by natural gas, which generates 7.5 kg CO2/$; and gasoline, which produces 6 kg CO2/$. Other types of energy usage have relatively small effects. One flight generates around 2.3 kg CO2/$, while one dollar spent on tobacco produces only around 0.5 kg of CO2.
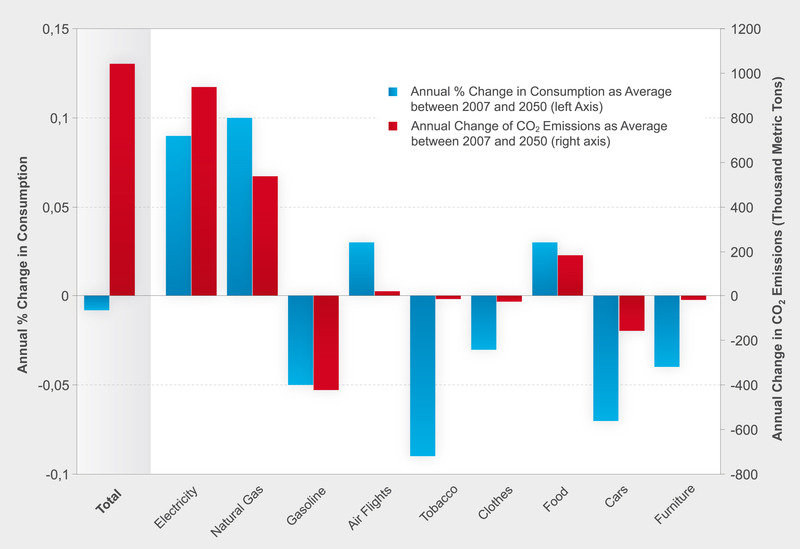
Will the reductions in CO2 emissions among the elderly alter the effects on climate of the population as a whole? To investigate this question, Zagheni projected future carbon dioxide emissions for the U.S. by creating a model in which the population of around 300 million grew older, but did not increase in size. Results showed that, on average, about one million metric ton of additional CO2 emissions would be produced in each of the years between 2007 and 2050 (see Figure 3). Thus, the effect of age is comparatively small. Total CO2 emissions in the U.S. in recent years have amounted to around 5.9 billion metric tons per year. Moreover, rising life expectancy is likely to lead to higher greenhouse gas emissions in the medium term, despite the declining per capita profile among the elderly. Why is this the case?
 Zoom image
© MPIDR, Emilio Zagheni
It is likely that the ageing of the population will not lead to a decrease in CO2 emissions between 2007 and 2050 because the process is not yet sufficiently advanced. This is despite the fact that the changing age structure will lead to a reduction in consumption of certain energy-intensive goods. For example, on the one hand, the shares of carbon dioxide emissions that come from burning gasoline (around 400,000 fewer metric tons) and wear-and-tear on cars (around 150,000 fewer metric tons) will tend to decrease, because cars are being used less (on average, around -0.05 to -0.7 percent; see Figure 3). On the other hand, this trend will be more than counteracted by increasing consumption of electricity and natural gas (by 0.09 or 0.1 percent per year), that will lead to significant additional emissions (estimates range from around 900,000 or 500,000 additional metric tons).
Overall, the balance in the medium term is expected to be positive. One reason for this is that the baby boomer cohorts, who will turn age 65 in the years to come, are also the age groups with the highest emissions values. This will not change until after 2030, when large numbers of baby boomers will have reached age 80, and reductions in CO2 emissions will outweigh increases. This shift cannot be discerned from Zagheni’s results due to the method used: it produces only a single average value for each of the years from 2007 to 2050. The averaging conceals the possibility that emissions could decline at the end of the simulation period.
Also, Zagheni’s study isolates the effect of ageing but does not account for potential improvements in technology. However, if it turns out that new technologies will be more carbon-efficient in the future, that might even leverage age structure effects for the good of the climate. This could be the case, for instance, if electricity, of which the old use a lot, could be generated and distributed with fewer emissions. The economic models of other researchers show that a reduction in carbon dioxide through changes in the age structure can only be seen after 2050. Then, however, reductions of up to 20 percent could occur.
Discover more from Watts Up With That?
Subscribe to get the latest posts sent to your email.
..for the good of the climate
I’m old enough that this makes me want to blow lunch…………..
I agree that seniors produce less CO2. But it’s a different story for methane. 😉
Millennials are the first to be “taught” the religion of CAGW in school.
Aw, come on, Curiousgeorge, we don’t produce more methane than the younger ones, we just don’t mind owning up to it.
If you include the CO2 produced by our kids, the total for older folk will always increase. Reduced population growth is the only way to slow the growth in man’s CO2 … not that there’s any good reason to do so.
People over 60 have been around long enough to have lived through all the different types of weather that the alarmists say are only happening now and is due to man made CO2. The older generations also weren’t as mobile. They lived in the same area their whole lives. So they have witnessed the same weather in the same place time and time again. They have personal knowledge of the weather history in their area. Harder to fool those kind of people. It is the younger generations with no long term history and that move all over the place that are easier to convince that something is wrong.
“For the first time, demographer Emilio Zagheni of the Max Planck Institute for Demographic Research in Rostock (MPIDR) has calculated […]”
I am deeply ashamed that my tax Euros are being squandered on this carbon counting drivel. Please accept my apologies. Somebody should teach Mr. Zagheni how to operate a broom so that he can spend the rest of his life doing something useful.
A couple of perfect examples of why to spend some time at WUWT,
Curiousgeorge’s coffee spray on the keyboard generating observation and Oldseadog’s rebuttal, thanks guys you made my day. 🙂
You want to be amazed and saddened at the same time? Go to a high school or college and ask a student a question that begins with these words: “What do you think?” They have been forced fed information and are not taught critical thinking. They are educated but are unable to reason. You cannot control a person who has the audacity to ask why. It is no wonder the younger you get, the more likely you are to believe what you been told in school or seen in a video. Those who promote the AGW know how to play people like a fiddle because they are part of the same group that made the questions “why” and “what do you think” a sin.
If you look at the graph carefully you will note that the ager range of largest CO2 production is 40-80. The obvious solution is that after age 40 nobody should be allowed to produce any more CO2. /sarc
To,
IPCC, UNFCCC, GREEN PEACE, CARNEGIE Instituion of science and others; looking forward to hearing from all of you!!!!
Chair person IPPAN, Kathmandu
Copy to the director ICIMOD, Nepal.
Dear Dr. Pachauri and Mr. Algore,
Challenge to IPCC / UNFCCC, SHAME ON YOU
Solution to CC and Power Crisis
Please give me either one scientific reason/ theory that justifies CC is due to gases OR STOP ACCUSING GASES for CC. Just accusation is not science. CC by gases is impossible. Man has disturbed the ‘rain cycle’ causing the ‘climate change.’ No gas can be ‘green house gas.’
I have also explained that applying the property / theory of standing still water column to the running water condition is the blunder being done in the ‘Hydropower Engineering’ and, its correction can give us unlimited hydropower.
Please visit devbahadurdongol.blogspot.com for solutions to ‘CC and power Crisis.’
Summary is attached for your convenience.
Challenger,
Dr. Dev
Email: dev.dangol@yahoo.co.uk
“Already sent to the addressees, green peace and many others throughout the world”
Young or old consider moving further to the South
http://www.vukcevic.talktalk.net/CET-NVa.htm
WUWT is starting to become a pro-sceptic gossip column.
OT — It’s official — Nitrogen is now a ‘pollutant’ among with CO2
http://www.sciencedaily.com/releases/2011/11/111103143243.htm
“Tropical Forests Fertilized by Nitrogen Air Pollution, Scientists Find”
I guess that means that 78% of the atmosphere is ‘pollution’. I truly wonder if the people who put out headlines like this really think about what they are saying or how ludicrous it is. I further wonder what they think a ‘pollution free’ atmosphere would consist of or if they are seriously contending that only Nitrogen related to human activities is pollution, while the 78% already there is not?
IAn,
The only honest kind of scientist is a skeptic.
Alternate title for the study:
“People keep learning as they grow older”
The calculation is very rough, because it covers only a few carbon-intense commodities such as electricity or air travel. But a more complete account of the carbon footprint by age should include indirect emissions. For instance, old people are likely to use more personal care, medical high-tech devices such as CATs and MRI, more ambulance rides, and so on: industries producing such devices and services, and people providing those services would have a carbon footprint. Youngsters do not get an ambulance ride or an MRI scan that often.
However, the elderly in general are less active, consume less dietary energy in food, are mostly retired from work, and it is thus understandable that, generally speaking, they generate slightly lower emissions. However I do not think this fact has such an overriding importance as to merit a paper (according to the graph, old timers generate much more than people of any age below 50).
For those who didn’t watch it , but have access to BBC I-player I can recommend watching tonight’s Panorama programme. Called ‘What’s fuelling your energy bill’ it quite obviously had no contribution from Richard Black. Instead it gave a forthright view of the impact of green policy of successive governments and provided plenty of rope so that Chris Huhne could go hang himself. Perhaps parts of the Beeb are feeling queasy at the rubbish they have been shovelling.
Sorry if off thread but deserving of a wider audience.
Smokey states “The only honest kind of scientist is a skeptic.”
Absolutely, but this piece doesn’t contain much science. Lots of “coulds” and “mights” but little scientific substance.
I am sure the poor and jobless generate even less CO₂ than elderly people on average. Not to mention the fact their life expectancy is shorter. Therefore the real solution is economic collapse on a grand scale.
It would be even better if an honest worldwide famine could be generated by decreasing food production to the level of mass starvation (see Holodomor). Of course the irresponsible practice of cremation should be banned, it is much better to sequester the carbon of corpses in the grave.
/ bitter sarc off
In all seriousness: we are not there yet, but the problem is worked on.
is that right… 14.9 metric tons per year? that is 4.5 trillion tons for the ruffly 300 million in the usa every year…
It maybe time to tackle this population statistic and it’s myths and facts, I noticed no one on the “we’re too over populated side” has been pushing their luck, Why did wikipedia change their estimated population totals by continent this year to match this on going statistical model that has been going since the nineteen nineties, this has got to be the most accurate model ever invented.
IAn says:
November 7, 2011 at 2:01 pm
WUWT is starting to become a pro-sceptic gossip column.
What is you context? as apposed to what? where are you coming from?
IAn says:
November 7, 2011 at 2:01 pm
“WUWT is starting to become a pro-sceptic gossip column.”
What is your context? as opposed to what? where are you coming from?
Did they include each person’s breathing?
4% CO2 at 20 liters/min is 48 liters per hour of pure CO2
air density is 1.22 g/liter, CO2 is 44/28 times heavier,
so those 48 liters @ur momisugly 1.92 g/L mass 92 g
a little over 2 moles of CO2 per hour
A metric ton is 1E6 g/(44 g/mole) = 22727 moles,
or 11,000 breathing-hours, about 15 months to exhale a metric ton of CO2.
Unless I’m way off somehow, the reason we never hear this little factoid
is that it would make a metric ton (120 gallons of gasoline)
not seem so fearsome, or SUVs quite so planet-threatening.
Thus 7 billion people exhale 5.5 billion tons per year.
Add our pets and livestock (methane too), so multiply by ….. what?
Human annual CO2 exhalation probably peaks at ages 16-25 and declines thereafter,
so plot that along the bottom of the graph , with the opposite trend for methane.
Then plot the CO2 generated per person 500 years ago, (livestock & wood-burning)
which evidently would lie between breathing and today’s emissions,
of course with a reduced lifespan, one of misery and ignorance.