By Joseph D’Aleo, CCM, AMS Fellow
The arctic ice appears to have bottomed out at a level 6.4% higher than the 2007 record. Mark Serreze of the National Snow and Ice Data Center says the Arctic could be ice-free in the summer by about 2030, though that is hard to predict; other scientists say it could be mid-century before that dramatic point is reached. The article continues Why does this matter? Ice that’s floating on the sea surface doesn’t raise the sea level when it melts. But researchers suspect it will alter the weather that reaches us far to the south. It’s already affecting Arctic wildlife.
Thousands of walruses that usually float around on sea ice and dive down to feed on the ocean floor abandoned those floes when the only ice left off the coast of Alaska was over water that was too deep. Walruses spend 2/3rds of their time in water and like the polar bear the talk of their demise will likely be proven wrong. Polar bear populations are at record highs. Here is today’s ice plot versus 2007.

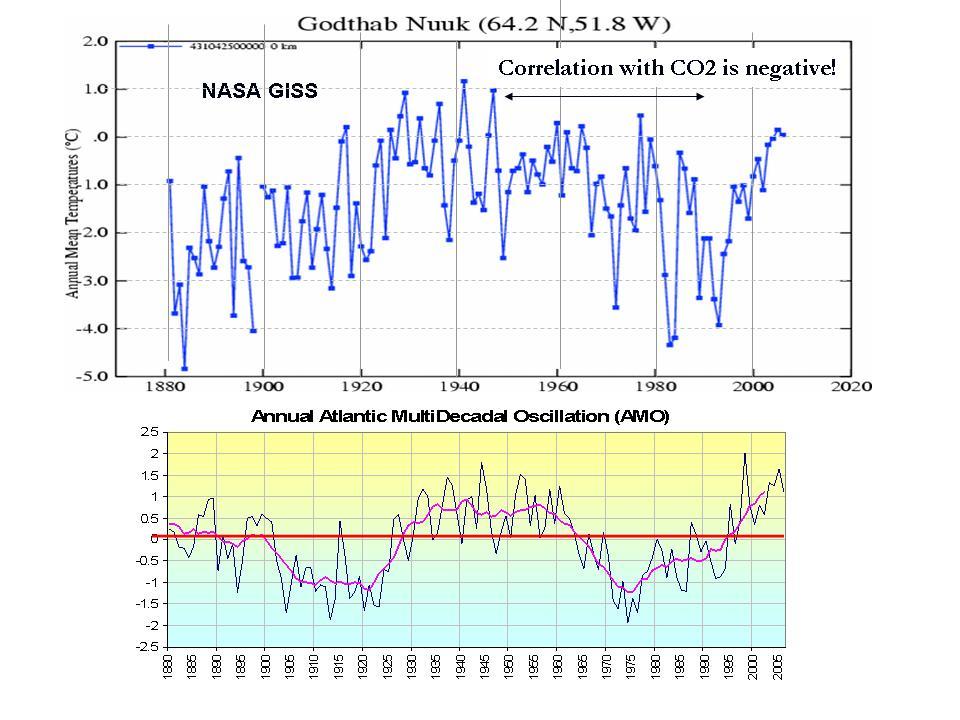
The temperatures in the arctic have indeed risen in recent years and ice has declined, bottoming out in 2007 but it is not unprecedented nor unexpected. The arctic temperatures and arctic ice extent varies in a very predictable 60-70 year cycle that relates to ocean cycles which are likely driven by solar changes. It has nothing to do with CO2, showing poor correlation and since cold open arctic ice is a significant sink for atmospheric CO2 just as warm tropical waters are the primary source.
In 2007, NASA scientists reported that after years of research, their team had assembled data showing that normal, decade-long changes in Arctic Ocean currents driven by a circulation known as the Arctic Oscillation was largely responsible for the major Arctic climate shifts observed over the past several years. These periodic reversals in the ocean currents move warmer and cooler water around to new places, greatly affecting the climate. The AO was at a record low level last winter explaining the record cold and snow in middle latitudes. A strongly negative AO pushes the coldest air well south while temperatures in the polar regions are warmer than normal under blocking high pressure. See post here.
We agree. And indeed both oceans play a role. In the record-setting (since satellite monitoring began in 1979) summer melt season of 2007, NSIDC itself before funding opportunist Serreze took over editorial control, noted the importance of both oceans in the arctic ice.
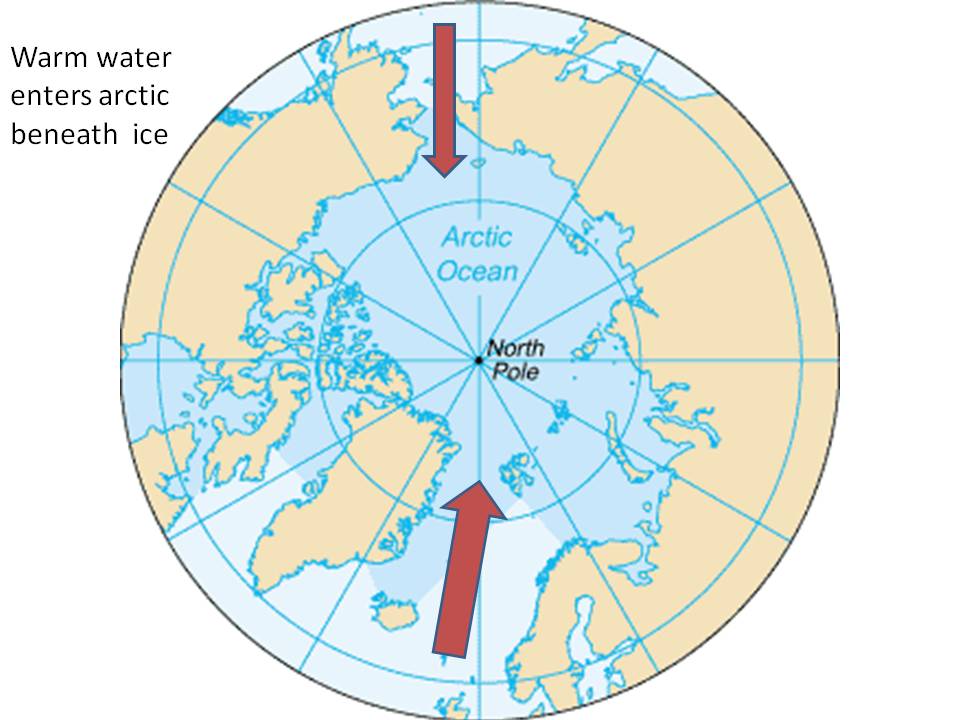
“One prominent researcher, Igor Polyakov at the University of Fairbanks, Alaska, points out that pulses of unusually warm water have been entering the Arctic Ocean from the Atlantic, which several years later are seen in the ocean north of Siberia. These pulses of water are helping to heat the upper Arctic Ocean, contributing to summer ice melt and helping to reduce winter ice growth.
Another scientist, Koji Shimada of the Japan Agency for Marine-Earth Science and Technology, reports evidence of changes in ocean circulation in the Pacific side of the Arctic Ocean. Through a complex interaction with declining sea ice, warm water entering the Arctic Ocean through Bering Strait in summer is being shunted from the Alaskan coast into the Arctic Ocean, where it fosters further ice loss. Many questions still remain to be answered, but these changes in ocean circulation may be important keys for understanding the observed loss of Arctic sea ice.”

Enlarged here.
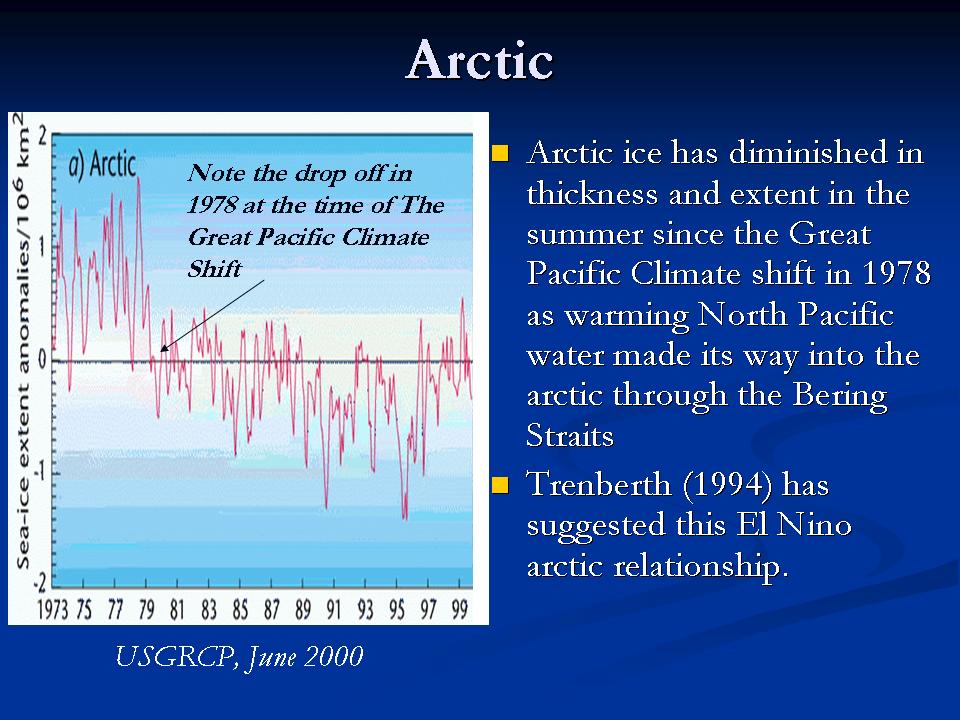
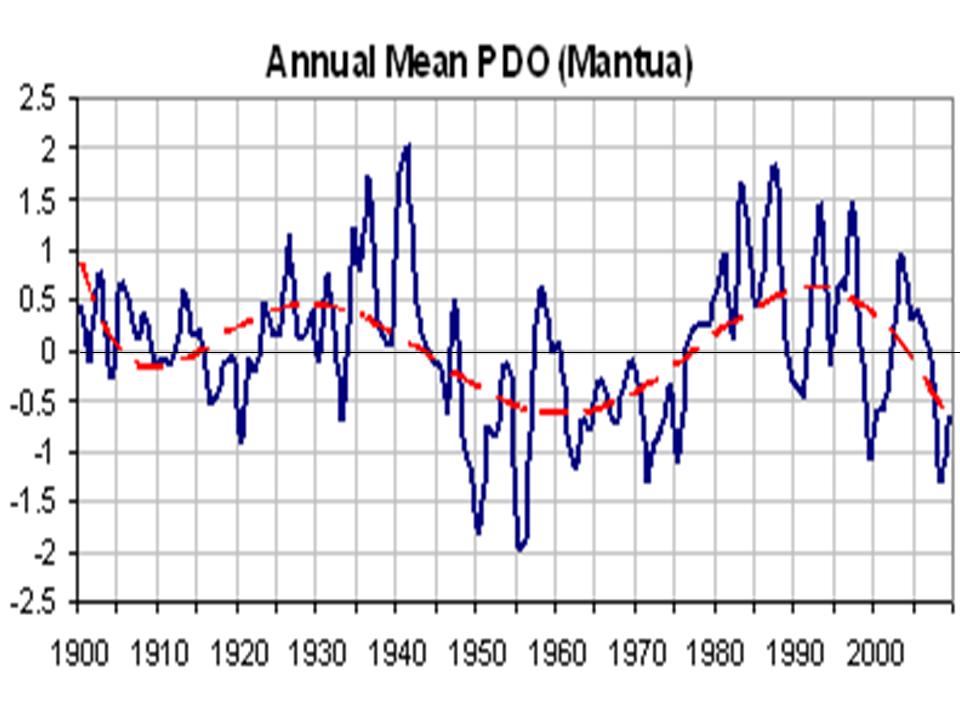
The Pacific warm mode favors more El Ninos and warmer water in the far northern Pacific including the Bering Straits. The PDO flipped into its warm mode in 1978 and the arctic temperatures began to warm and ice began to melt.

Enlarged here.

Enlarged here.
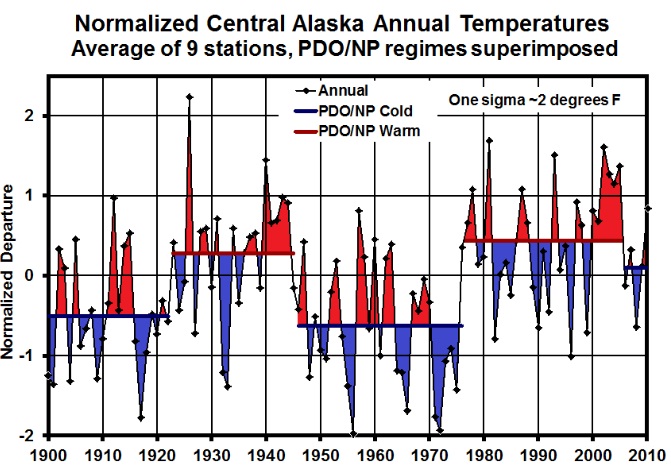
Notice how the temperatures in Alaska go through step changes tied to the PDO (Keen).

Enlarged here.
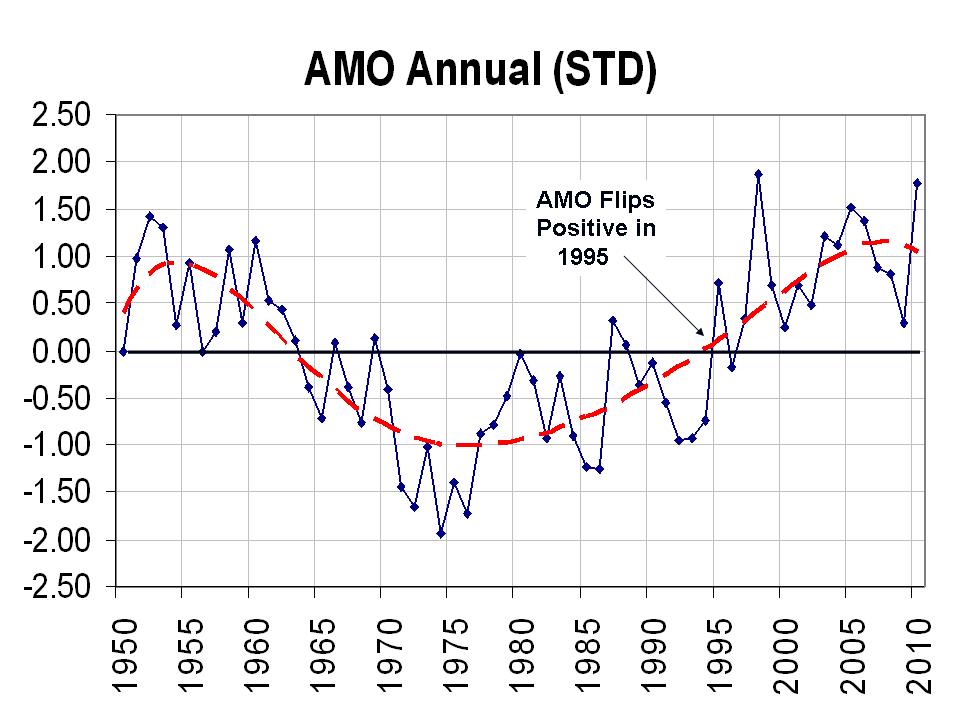
The Atlantic also cycles on a 60-70 year period. The Atlantic Multidecadal Oscillation or AMO returned to the positive warm mode in 1995.

Enlarged here.
Frances et al. (GRL 2007) showed how the warming in the arctic and the melting ice was related to warm water (+3C) in the Barents Sea moving slowly into the Siberian arctic and melting the ice. She also noted the positive feedback of changed “albedo” due to open water then further enhances the warming.
The International Arctic Research Center at the University of Alaska, Fairbanks showed how arctic temperatures have cycled with intrusions of Atlantic water – cold and warm.

Enlarged here.
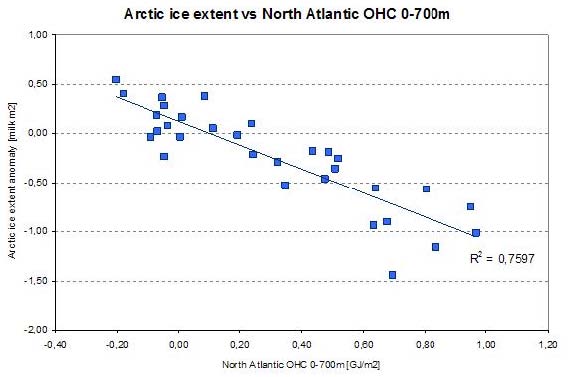
The correlation was also confirmed by Juraj Vanovcan.

Enlarged here.
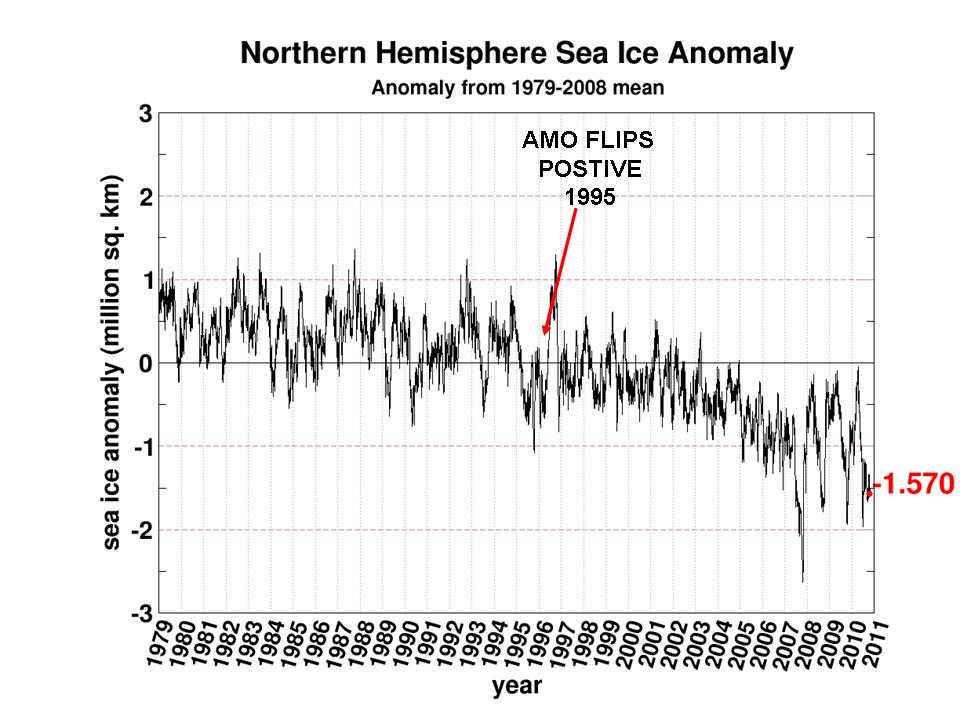
See how quickly the arctic ice reacts to warming of the Atlantic sea surface temperatures in 1995 (source Cryosphere Today). This marked a second leg down. We have seen large swings after the big dip in 2007 following a peak in Atlantic warmth in 2004-2005.

Enlarged here.
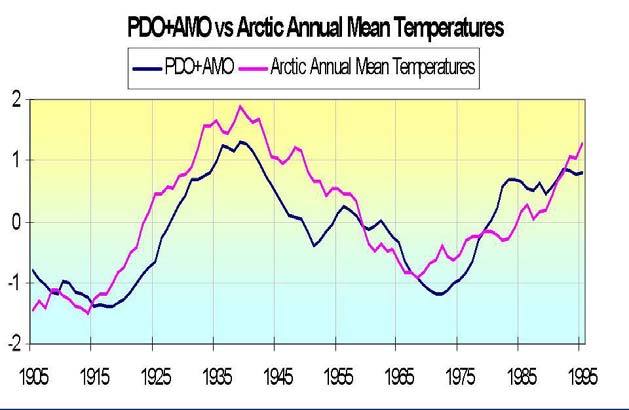
Although the PDO and AMO are measured differently, both reflect a tri-pole of ocean temperatures. Both have warm north and tropics and cool relative to normal in between in the positive phase and cold north and tropics and warm in between in the negative phase. By normalizing the two data sets and then adding the two, you get a measure of net warmth or cooling potential for both global and arctic temperatures. See how well the sum tracks with the arctic temperatures. Though we don’t have measurements of ice extent, there are many stories and anecdotal evidence that arctic ice was in a major decline from the 1920s to 1940s.

Enlarged here.
At the edge of the arctic Greenland behaves in the same way – with warming and cooling tied to the AMO.

Enlarged here.
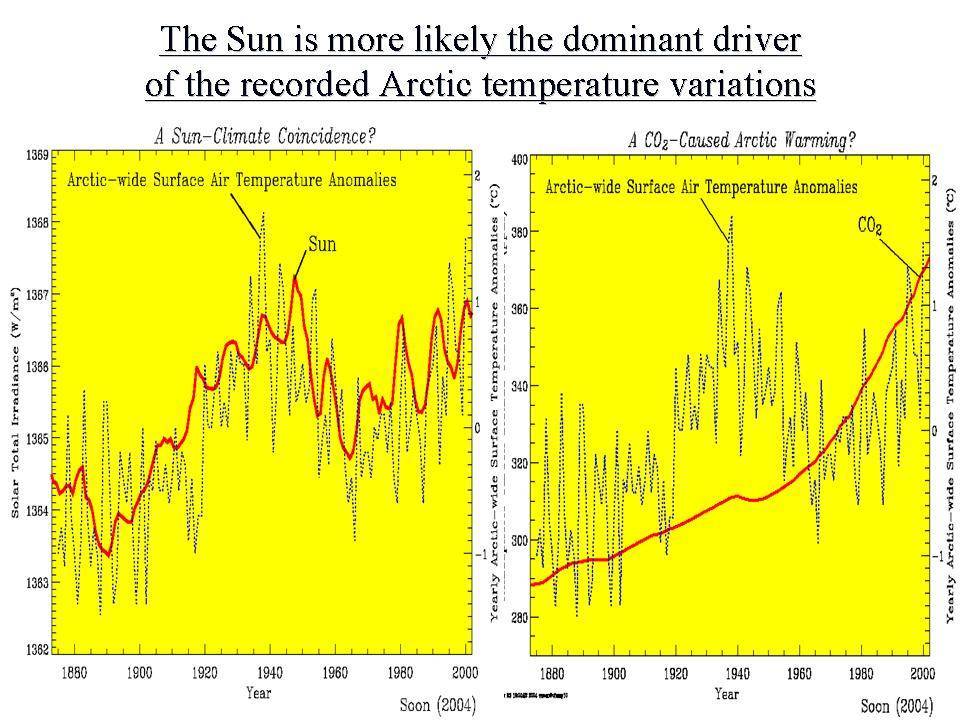
Dr. Willie Soon has shown how the arctic temperatures match the solar Total Solar Irradiance (Hoyt/Schatten/Willson) well. Correlation is poor with CO2.

Enlarged here.
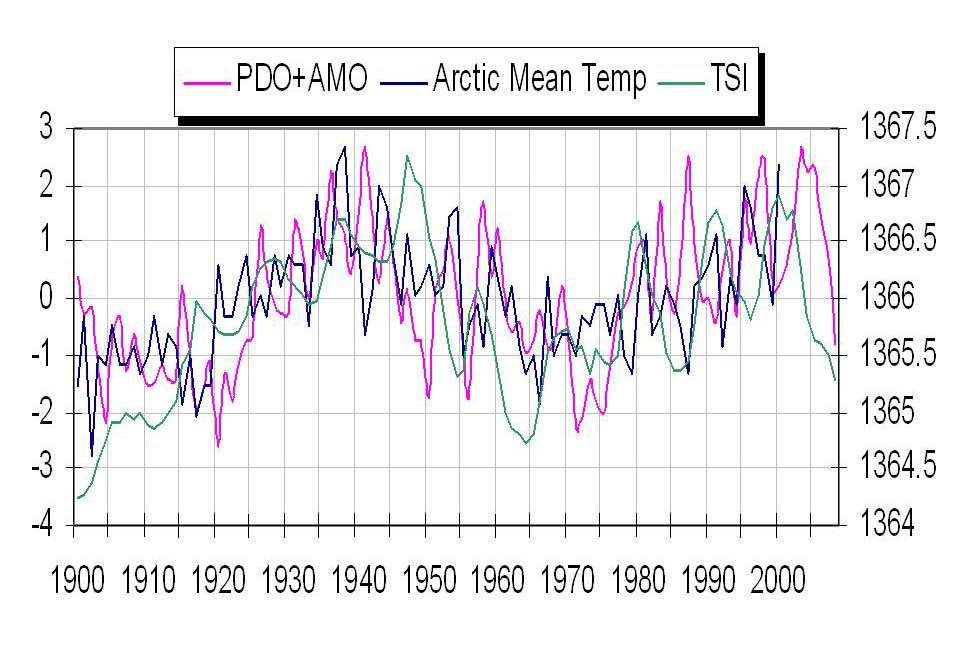
We see here how the annual TSI and annual PDO+AMO track together with arctic temperatures.

Enlarged here.
Though the current spike in the Atlantic temperatures and more high latitude blocking may cause another spike of melting in the next few winters as warm water from the AMO pop the last year works its way into the arctic, longer term you can expect arctic temperatures to decline and ice to rebound as the Pacific stays cold and the Atlantic cools and the sun stays in its 213 year Eddy minimum.
That doesn’t preclude some very cold and snowy winters short term. In 2008 glaciologist Bruce Molnia reported a bitterly cold Alaskan summer of 2008 following a La Nina winter with extreme cold and heavy snows resulted in area glaciers to expand, rather than shrink for the FIRST TIME IN RECORDED HISTORY. Summer temperatures, which were some 3 degrees below average, allowed record levels of winter snow to remain much longer, leading to the increase in glacial mass for the first time in at least 250 years.
See PDF here. See Verity Jones recent post on the arctic data here.

Enlarged here.
See more on glaciers and icecaps here.
See post by Arnd Bernaerts on Verity Jones’ Digging in the Clay here with much more on the arctic. See also here how the decade is almost up for the arctic ice disappearing here.
Bob Tisdale, Polar amplification occurs regardless of the cause of the rise or fall in surface temperatures.
Thank you Bob, to confirm that CO2 forcing is not exempt from polar amplification.
Which takes away the last shred of credibility behind D’Aleo’s claim that “It has nothing to do with CO2”.
Bill Illis But Serreze and others note that the sea ice Minimum looks more like a polynomial function (the R^2 for a 2nd Order polynomial is actually a little higher than the linear one and the 3rd Order Poly is even higher than both). So it we extend those functions out for 25 years, we get no sea ice in 2030 or 2050 or something.
Good observation Bill, which seems to confirm the statistical analysis done by Julia at the BlackBoard :
the quadratic fit is statistically significant and comparing the corrected Akaike values (AICs), which indicate if the only two possible models are linear or quadratic, the quadratic model much more likely than the linear model.
http://rankexploits.com/musings/2011/connelly-dekker-bet-actually-robs-got-a-very-good-chance-of-not-losing/
I hate it when I click Post Comment and wind up with an IE error message. My reply did not show up as awaiting moderation, so I will assume it got lost in the ethers. Good thing I wrote it in Word. Let’s try again.
Rob says: “Thank you Bob, to confirm that CO2 forcing is not exempt from polar amplification…”
And natural variables are not exempt. . The problem at hand is determining if anthropogebic or natural causes are the primary cause of the warming, and resulting polar amplification, during the more recent warming epoch. In a number of evaluations of Surface Temperatures during the satellite era, we determine that natural variables could be responsible for approximately 70% to 90% of the warming since 1982. Refer to
http://bobtisdale.wordpress.com/2011/01/09/can-most-of-the-rise-in-the-satellite-era-surface-temperatures-be-explained-without-anthropogenic-greenhouse-gases/
And:
http://bobtisdale.wordpress.com/2011/01/28/removing-the-effects-of-natural-variables-multiple-linear-regression-based-or-%e2%80%9ceyeballed%e2%80%9d-scaling-factors/
Stu N says:
September 17, 2011 at 10:06 pm
But it is his history of pointing out all the cherry picking that causes me to hold him to the high standard. Hypocrisy makes things stand out. Particularly this exact issue – as he rightfully pointed out when Steve Goddard cherry picked which data sets to use in his sea ice discussions.
In fact there is. The NANSEN Arctic ROOS shows 2011’s (daily) minimum to be above 2008 (to date at least).
Maybe you’re right though. Maybe I shouldn’t call it cherry picking and instead call it something else…but it’s clearly not a coincidence that it happened at the time that it did.
-Scott
A very interesting and illuminating article.
Perhaps the least publicised data, and the data most worthy of widespread publicity, is the PD/AMO correlation with arctic temperatures. It implies that arctic sea ice oscillates and that around 1979 we were close to the top of the cycle, not at an ‘average’ point. It might also imply that we are around the bottom of the cycle now with the implication that arctic sea ice levels may rise for the next 30 odd years. Given the predictions for low solar output for the next two cycles, it will be interesting to note whether that feeds directly into oceanic and ice parameters or whether such effects are delayed by a few decades…..
http://www.wunderground.com/blog/JeffMasters/comment.html?entrynum=1932
excerpt:
Arctic sea ice bottoms out near all-time low; August was Earth’s 4th – 8th warmest
Posted by: JeffMasters, 6:11 PM GMT on September 17, 2011 +21
Arctic sea ice extent hit its minimum on September 9 this year, falling to its second lowest value since satellite measurements began in 1979, according to the National Snow and Ice Data Center . More than one third (35%) of the Arctic sea ice was missing this summer, compared to the 1979 – 2000 average. This is an area about the size of the Mediterranean Sea. The 2011 sea ice minimum was very close to the all-time record low set in 2007; in fact, the University of Bremen rated the 2011 loss the greatest on record. For the fourth consecutive year, and fourth time in recorded history, ice-free navigation was possible in the Arctic along the coast of Canada (the Northwest Passage), and along the coast of Russia (the Northeast Passage.) Mariners have been attempting to sail these waters since 1497.
While the record low sea ice year of 2007 was marked by a very unusual 1-in-20 year combination of weather conditions that favored ice loss (including clearer skies, favorable wind patterns, and warm temperatures), 2011’s weather patterns were much closer to average. The fact we pretty much tied the record for most sea ice loss this year despite this rather ordinary weather is a result of the fact that large amounts of thicker, multi-year ice has melted or been flushed out of the Arctic since 2007. As a result of the loss of this old, thick ice, both 2010 and now 2011 set new records for the lowest volume of sea ice in the Arctic, according the University of Washington PIOMAS model. Given the very thin ice now covering most of the Arctic, we can expect truly dramatic sea ice loss the next time 1-in-10 year or 1-in-20 year warmth and sunshine invades the Arctic. We are definitely on pace to see the Arctic virtually sea ice-free in summer by 2030, as predicted by several leading Arctic sea ice scientists. I expect we’ll see more than half of the Arctic ice gone and the North Pole liquid instead of solid by the summer of 2020, and probably sooner.
Rhys Jaggar says:
September 18, 2011 at 3:51 am
A very interesting and illuminating article.
Perhaps the least publicised data, and the data most worthy of widespread publicity, is the PD/AMO correlation with arctic temperatures. It implies that arctic sea ice oscillates and that around 1979 we were close to the top of the cycle, not at an ‘average’ point.
—————
The data would suggest otherwise…
http://nsidc.org/sotc/images/mean_anomaly_1953-2010.png
http://nsidc.org/sotc/sea_ice.html
Of course, the data before 1979 is pre-satellite, but it’s what we have and it doesn’t suggest any cyclic behaviour.
Just The Facts says: September 17, 2011 at 11:33 pm
Socratic says: September 17, 2011 at 9:04 pm
Four or five ships a year cannot be responsible for the massive Arctic-wide loss in ice thickness, which is much more pronounced that either area or extent.
While obviously not responsible for the majority of the sea ice decreace, “There were approximately 6,000 individual vessels, many making multiple voyages, in the Arctic region during the AMSA survey year; half of these were operating on the Great Circle Route in the North Pacific that crosses the Aleutian Islands. Of the 6,000 vessels reported, approximately 1,600 were fishing vessels.” [deletia]
Good reply JTF. Obviously there are more than “four or five” ships per year in the Arctic and it is obvious that vessel traffic will not result in an increase in Arctic ice. If you’ve ever seen a log jam, it often only takes a small number of logs being released for the rest of the logs to become free. Ice that has been disturbed by vessel traffic is obviously more free to transported by ocean currents than undisturbed ice. I agree this should be studied more, as well as the impact of soot from the exhaust of the ships.
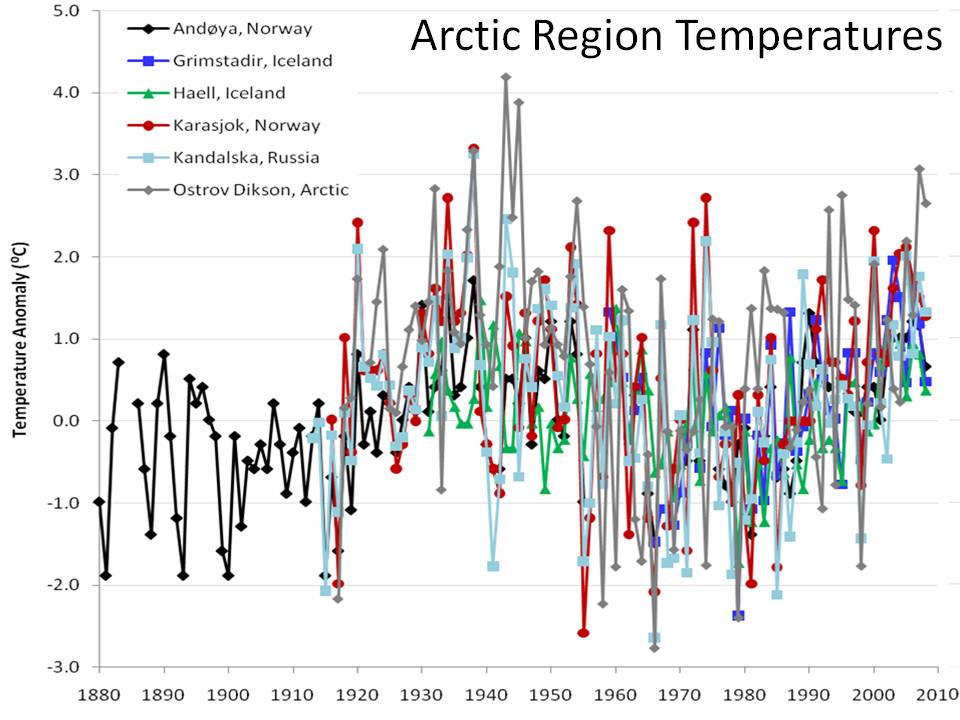
There’s been some questions raised about the authenticity of the last graph displayed in this post. See here: http://tamino.wordpress.com/2011/09/17/cold-cherries-from-joe-daleo/
Has D’Aleo responded to these questions or otherwise explain why he selected just those six sites to represent the Arctic climate? Tamino uses the full 137 Arctic sites from GHCN and the trend he derives is much stronger than that displayed by the six sites in D’Aleo’s graph. Those sites appear to be unrepresentative of the Arctic basin as a whole, whether from location or equipment changes. Of course, any site could suffer from those, but the more sites you use, the less such noise would be evident in the data. This would seem to be the equivalent of an alarmist cherrypicking the six sites with the highest temperature increase and using them to suggest it’s even worse than we think.
Norwegean news are reporting satelite measurements showing lowest ice extent ever. They would usually not report such news unless some scientist or research group was doing the same. It was part of a story about a greanpeace ship with a researcher from Cambridge doing thickness measurements on the ice. Are there any proper reports on lowest extent or is it just greampeace frothing at the mouth?
Vaguely related. Pole Cam #1 has gone kaput. Suspect it’s due to a combination of extreme cold and possibly being buried in a snow drift. Last good image was on a very frigid Sept 14, after multiple major snow events in rapid succession.
RE: Given the very thin ice now covering most of the Arctic
Show me the data.
I suspect the opposite is true. Lots of very compacted / obducted / compressed ice. It is notable how solid the core was this year a huge raft of near 100% concentration. Withstood the summer sun and wind (not to mention sea) very well. Once a certain edge was reached it really did not change much except for the usual area North of Europe.
Hi folks,
Would someone ‘in the know’ help me out and tell me what temperature source Dr. Soon used for the Arctic temperature v. TSI graph? I’ve googled and searched around a bit, and darned if it’s not difficult to find the answer. Or even a link to his paper, if it’s available free online (full paper only please & actually that’d be nice to have regardless… I’m assuming the abstract doesn’t include the data source he used for Arctic temps, so unless it does, the abstract only won’t help). I referenced his chart in a comment elsewhere, and a follow up coment asked me the temp source he used… so I’d like to reply if I can.
Thanks in advance for your help!
Stu
That post very clearly demolishes this one from Joe D’Aleo.
Scott,
How did you go with that?