By Joseph D’Aleo, CCM, AMS Fellow
The arctic ice appears to have bottomed out at a level 6.4% higher than the 2007 record. Mark Serreze of the National Snow and Ice Data Center says the Arctic could be ice-free in the summer by about 2030, though that is hard to predict; other scientists say it could be mid-century before that dramatic point is reached. The article continues Why does this matter? Ice that’s floating on the sea surface doesn’t raise the sea level when it melts. But researchers suspect it will alter the weather that reaches us far to the south. It’s already affecting Arctic wildlife.
Thousands of walruses that usually float around on sea ice and dive down to feed on the ocean floor abandoned those floes when the only ice left off the coast of Alaska was over water that was too deep. Walruses spend 2/3rds of their time in water and like the polar bear the talk of their demise will likely be proven wrong. Polar bear populations are at record highs. Here is today’s ice plot versus 2007.

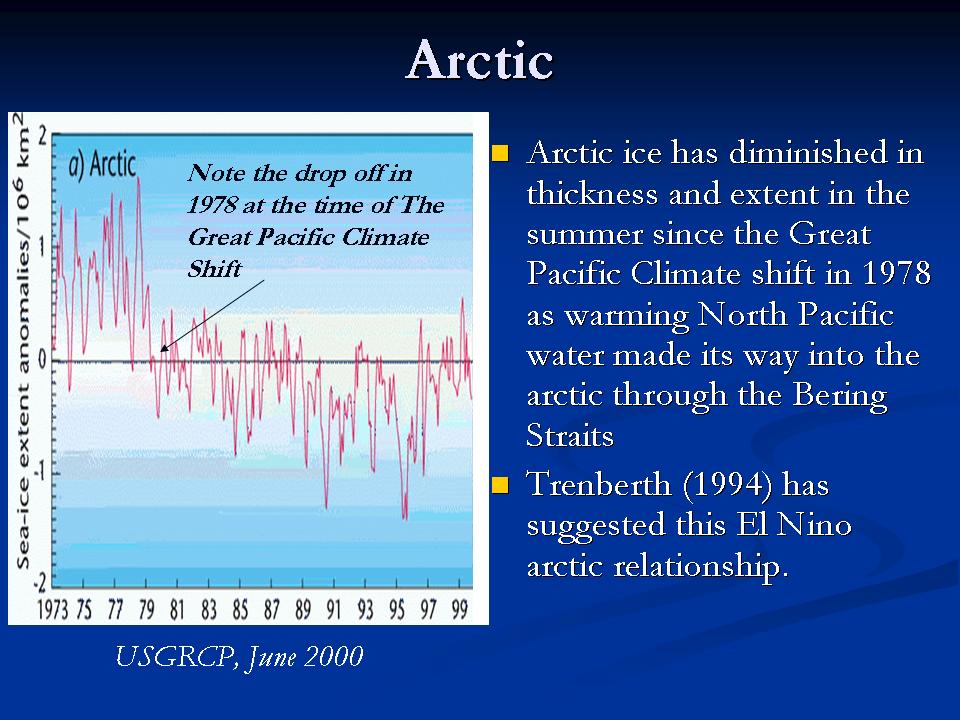
The temperatures in the arctic have indeed risen in recent years and ice has declined, bottoming out in 2007 but it is not unprecedented nor unexpected. The arctic temperatures and arctic ice extent varies in a very predictable 60-70 year cycle that relates to ocean cycles which are likely driven by solar changes. It has nothing to do with CO2, showing poor correlation and since cold open arctic ice is a significant sink for atmospheric CO2 just as warm tropical waters are the primary source.
In 2007, NASA scientists reported that after years of research, their team had assembled data showing that normal, decade-long changes in Arctic Ocean currents driven by a circulation known as the Arctic Oscillation was largely responsible for the major Arctic climate shifts observed over the past several years. These periodic reversals in the ocean currents move warmer and cooler water around to new places, greatly affecting the climate. The AO was at a record low level last winter explaining the record cold and snow in middle latitudes. A strongly negative AO pushes the coldest air well south while temperatures in the polar regions are warmer than normal under blocking high pressure. See post here.
We agree. And indeed both oceans play a role. In the record-setting (since satellite monitoring began in 1979) summer melt season of 2007, NSIDC itself before funding opportunist Serreze took over editorial control, noted the importance of both oceans in the arctic ice.
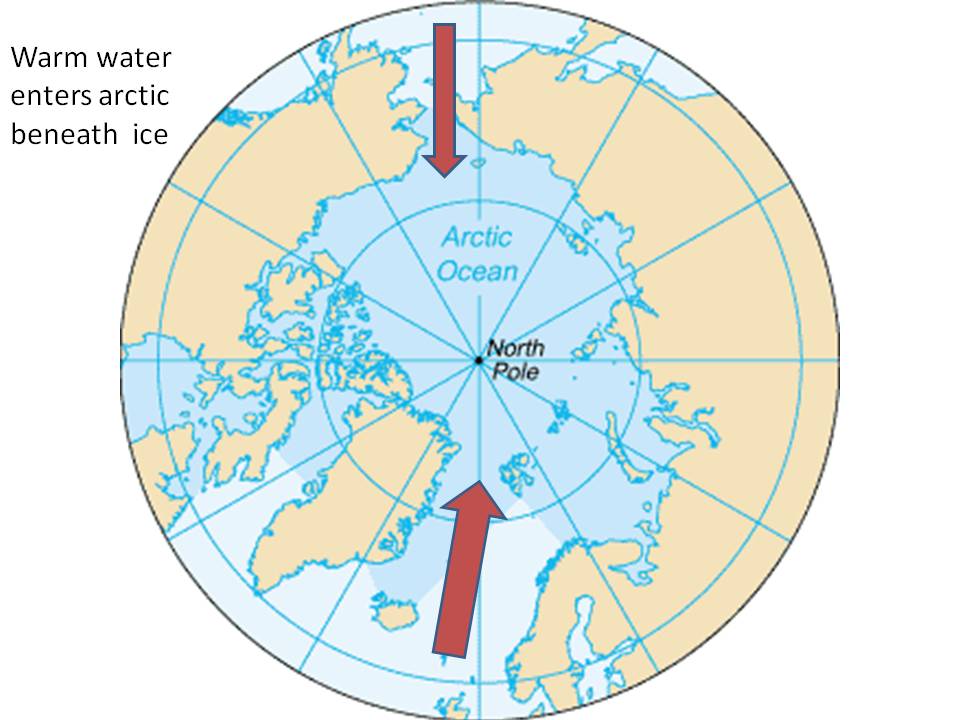
“One prominent researcher, Igor Polyakov at the University of Fairbanks, Alaska, points out that pulses of unusually warm water have been entering the Arctic Ocean from the Atlantic, which several years later are seen in the ocean north of Siberia. These pulses of water are helping to heat the upper Arctic Ocean, contributing to summer ice melt and helping to reduce winter ice growth.
Another scientist, Koji Shimada of the Japan Agency for Marine-Earth Science and Technology, reports evidence of changes in ocean circulation in the Pacific side of the Arctic Ocean. Through a complex interaction with declining sea ice, warm water entering the Arctic Ocean through Bering Strait in summer is being shunted from the Alaskan coast into the Arctic Ocean, where it fosters further ice loss. Many questions still remain to be answered, but these changes in ocean circulation may be important keys for understanding the observed loss of Arctic sea ice.”

Enlarged here.
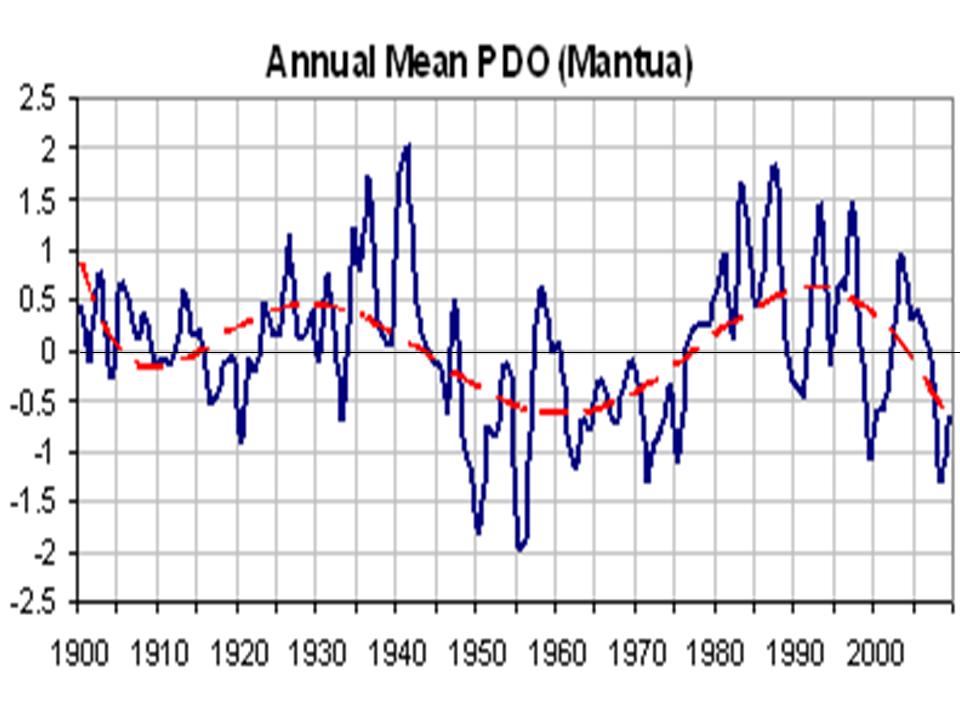
The Pacific warm mode favors more El Ninos and warmer water in the far northern Pacific including the Bering Straits. The PDO flipped into its warm mode in 1978 and the arctic temperatures began to warm and ice began to melt.

Enlarged here.

Enlarged here.
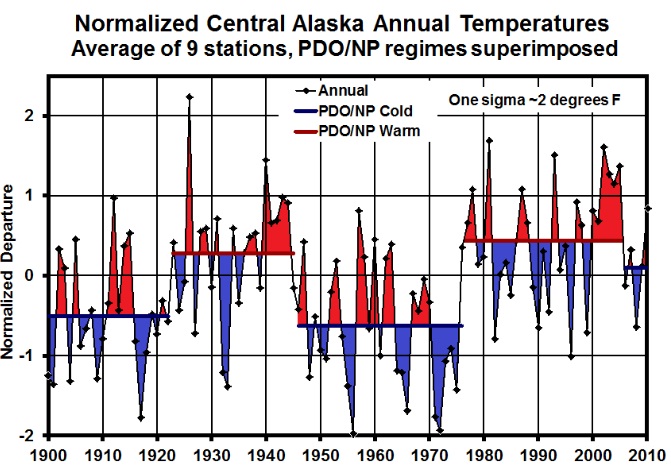
Notice how the temperatures in Alaska go through step changes tied to the PDO (Keen).

Enlarged here.
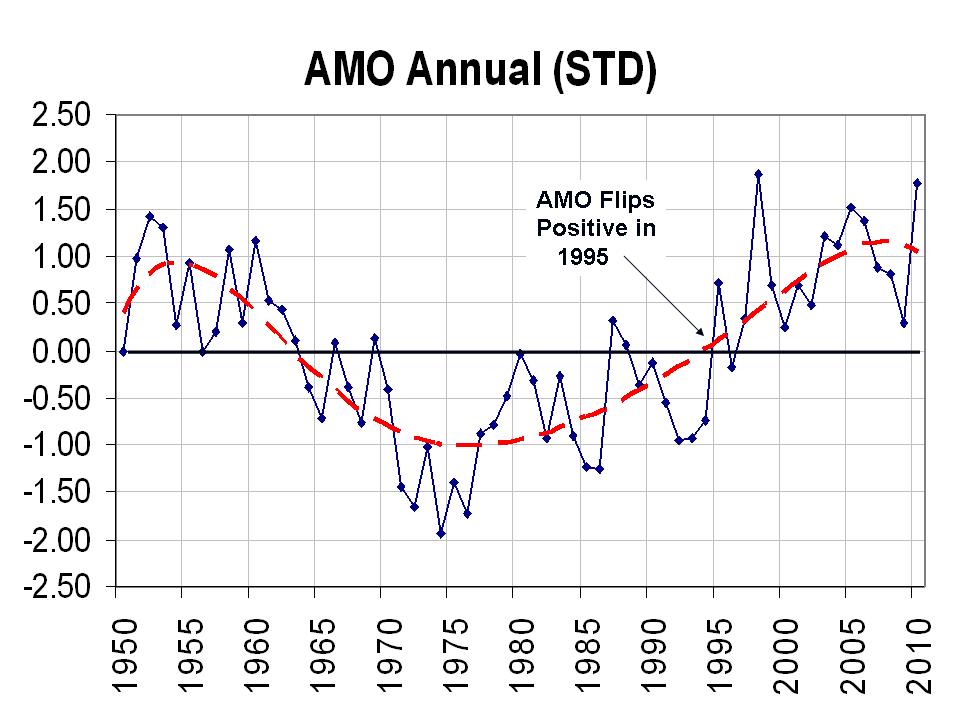
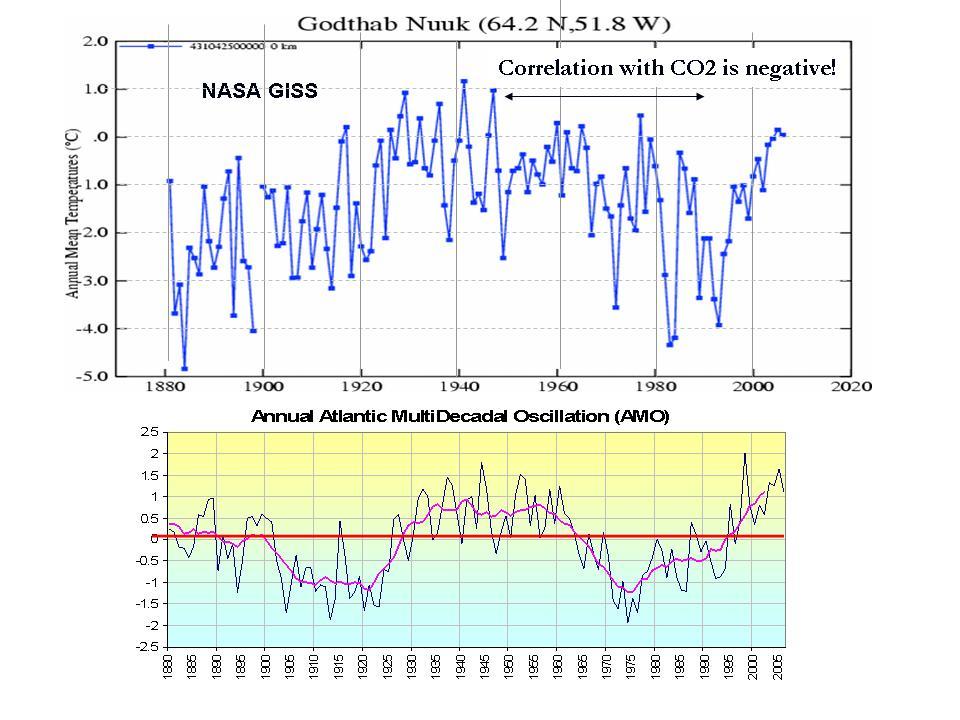
The Atlantic also cycles on a 60-70 year period. The Atlantic Multidecadal Oscillation or AMO returned to the positive warm mode in 1995.

Enlarged here.
Frances et al. (GRL 2007) showed how the warming in the arctic and the melting ice was related to warm water (+3C) in the Barents Sea moving slowly into the Siberian arctic and melting the ice. She also noted the positive feedback of changed “albedo” due to open water then further enhances the warming.
The International Arctic Research Center at the University of Alaska, Fairbanks showed how arctic temperatures have cycled with intrusions of Atlantic water – cold and warm.

Enlarged here.
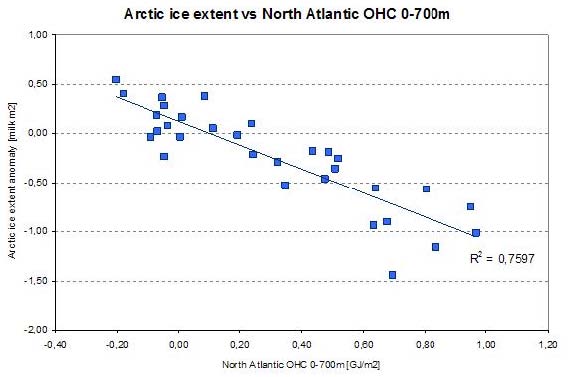
The correlation was also confirmed by Juraj Vanovcan.

Enlarged here.
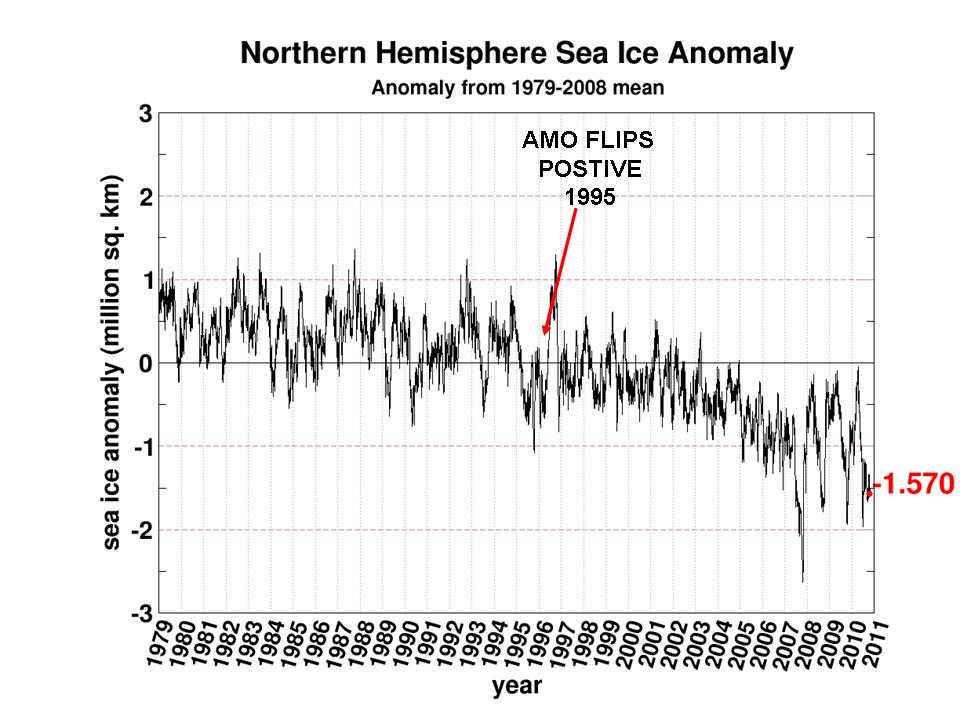
See how quickly the arctic ice reacts to warming of the Atlantic sea surface temperatures in 1995 (source Cryosphere Today). This marked a second leg down. We have seen large swings after the big dip in 2007 following a peak in Atlantic warmth in 2004-2005.

Enlarged here.
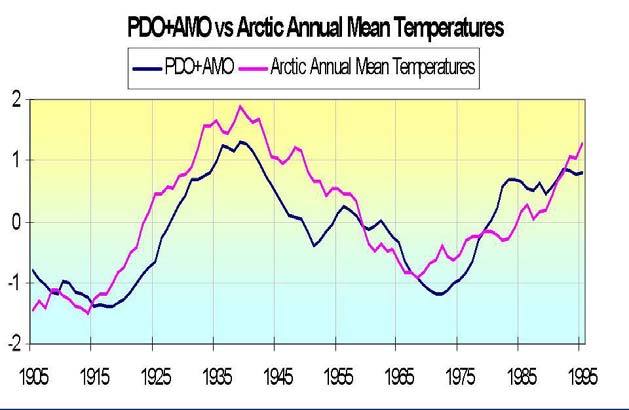
Although the PDO and AMO are measured differently, both reflect a tri-pole of ocean temperatures. Both have warm north and tropics and cool relative to normal in between in the positive phase and cold north and tropics and warm in between in the negative phase. By normalizing the two data sets and then adding the two, you get a measure of net warmth or cooling potential for both global and arctic temperatures. See how well the sum tracks with the arctic temperatures. Though we don’t have measurements of ice extent, there are many stories and anecdotal evidence that arctic ice was in a major decline from the 1920s to 1940s.

Enlarged here.
At the edge of the arctic Greenland behaves in the same way – with warming and cooling tied to the AMO.

Enlarged here.
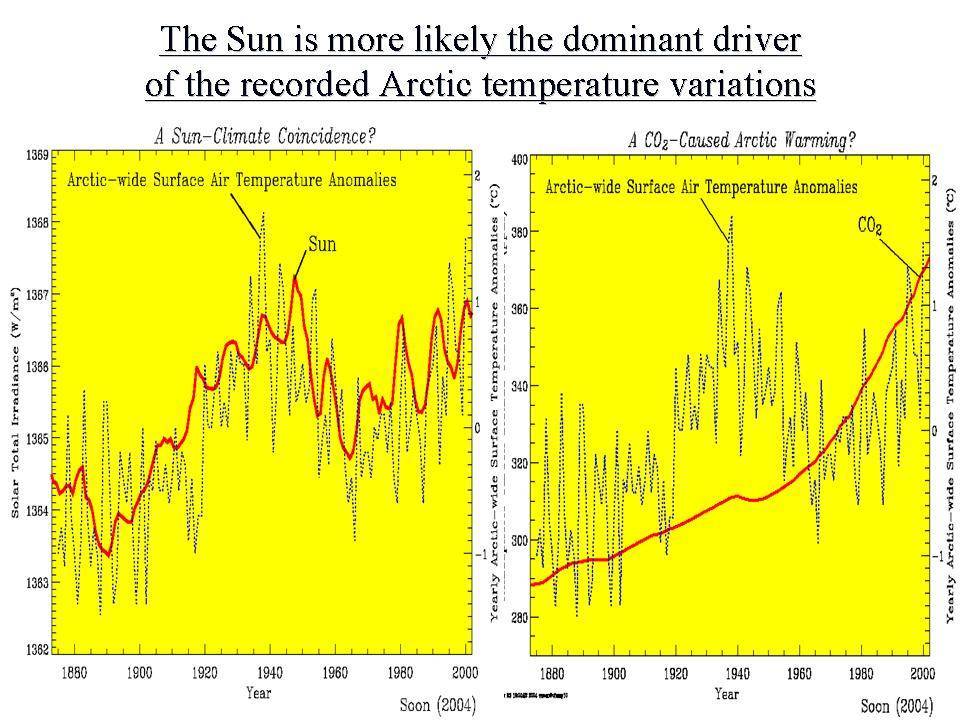
Dr. Willie Soon has shown how the arctic temperatures match the solar Total Solar Irradiance (Hoyt/Schatten/Willson) well. Correlation is poor with CO2.

Enlarged here.
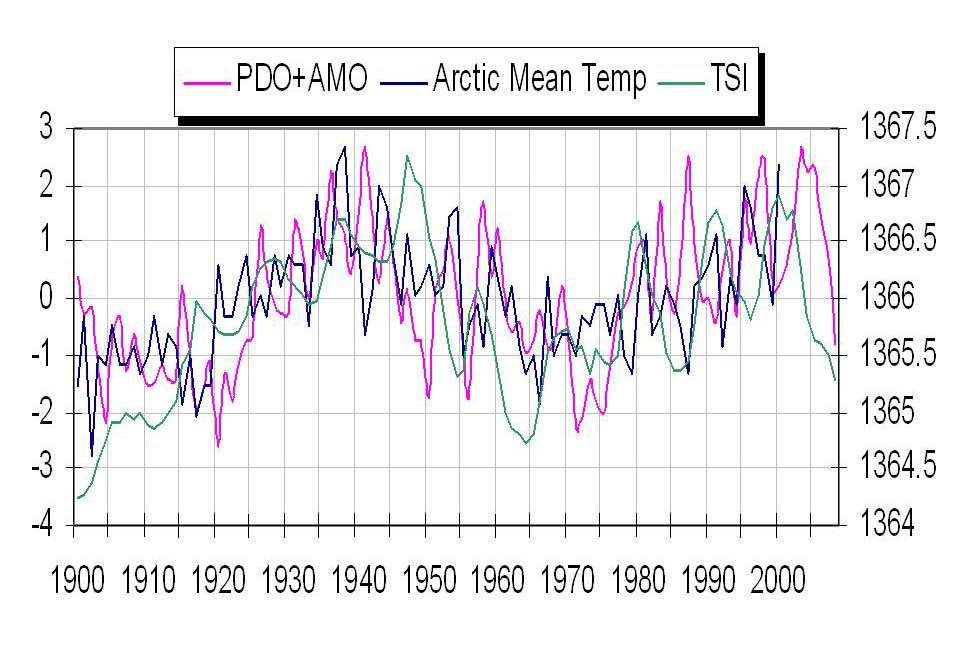
We see here how the annual TSI and annual PDO+AMO track together with arctic temperatures.

Enlarged here.
Though the current spike in the Atlantic temperatures and more high latitude blocking may cause another spike of melting in the next few winters as warm water from the AMO pop the last year works its way into the arctic, longer term you can expect arctic temperatures to decline and ice to rebound as the Pacific stays cold and the Atlantic cools and the sun stays in its 213 year Eddy minimum.
That doesn’t preclude some very cold and snowy winters short term. In 2008 glaciologist Bruce Molnia reported a bitterly cold Alaskan summer of 2008 following a La Nina winter with extreme cold and heavy snows resulted in area glaciers to expand, rather than shrink for the FIRST TIME IN RECORDED HISTORY. Summer temperatures, which were some 3 degrees below average, allowed record levels of winter snow to remain much longer, leading to the increase in glacial mass for the first time in at least 250 years.
See PDF here. See Verity Jones recent post on the arctic data here.

Enlarged here.
See more on glaciers and icecaps here.
See post by Arnd Bernaerts on Verity Jones’ Digging in the Clay here with much more on the arctic. See also here how the decade is almost up for the arctic ice disappearing here.
Bernard J. says:
September 16, 2011 at 11:47 pm
Actually, I read your links and apparently it is difficult to understand. One blames the ozone hole, one blames changes in ocean circulation, and the other blames increases in precipitation (which is related to ocean circulation). Also, the second link had this quote at the end:
Well, at least some people are honest. The deal is, some GCMs since the early 90s have shown Antarctic ice to grow, but attribution of this even in the model is sketchy. In real life, attribution for both the Arctic and Antarctic hasn’t been accomplished. And while CAGWers may love to say the Antarctic growth is caused by circulation changes and the like, they seem to turn a deaf ear when a skeptic says that the Arctic losses could be due to the same or when changes at either pole might be due, in part or in full, to natural processes.
-Scott
Good Job wayne Job!..Liked your post!
Stephen Skinner says: September 17, 2011 at 2:49 am
I am unable to find anywhere a measurement of what the max expected age of MYI. The only definition is the one above, which would mean that as all the ice cannot be melted in one season (yet) movement of ice out of the Arctic is a massive contributor to the yearly melt season. As has been stated by several commentators previously.
I don’t know of any way to measure “max expected age” per se, as while “First-year and multiyear ice have different electromagnetic properties that satellite sensors can detect, allowing scientists to distinguish the two.”;
http://nsidc.org/seaice/characteristics/multiyear.html
estimating the age of muiltyear ice requires tracking movement, analysis and modeling. Furthermore, “max expected” would be based on such a brief time period, i.e. since 1979, as to offer an insignificant basis for maximum expectations.
However, in “Distribution and trends in Arctic sea ice age through spring 2011” by James Maslanik, Julienne Stroeve, Charles Fowler and William Emery, 2011, used an “Analysis of a satellite-derived record of sea ice age for 1980 through March 2011 shows continued net decrease in multiyear ice coverage in the Arctic Ocean, with particularly extensive loss of the oldest ice types. The fraction of total ice extent made up of multiyear sea ice in March decreased from about 75% in the mid 1980s to 45% in 2011, while the proportion of the oldest ice declined from 50% of the multiyear ice pack to 10%.”
http://www.agu.org/pubs/crossref/2011/2011GL047735.shtml
In “Recent changes of arctic multiyear sea-ice coverage and the likely causes” by Igor V. Polyakov, Ronald Kwok, and John E. Walsh, 2011:
At the end of the 2010 summer, only 15% of the ice remaining in the Arctic was more than two years old, compared to 50 to 60% during the 1980s. There is virtually none of the oldest (at least five years old) ice remaining in the Arctic (less than 60,000 km2 compared to 2 million km2 during the 1980s). Between 2005 and 2008 (Figure 1), the Arctic Ocean lost 42% of its multiyear ice (MYI = ice which survives at least one arctic summer) coverage.
http://journals.ametsoc.org/doi/pdf/10.1175/BAMS-D-11-00070.1
“Sea Ice Cover” by D. Perovich, W. Meier, J. Maslanik, and J. Richter-Menge offers several good graphics on Sea Ice Age towards the bottom:
http://www.arctic.noaa.gov/reportcard/seaice.html
In “Variations in the Age of Arctic Sea-ice and Summer Sea-ice Extent” by Ignatius G. Rigor & John M. Wallace, they used a model to estimate Arctic Sea Ice Age from 1984 – 2002, and the resultant graphics can be found on pages 2 and 3:
http://seaice.apl.washington.edu/IceAge&Extent/Rigor&Wallace2004.pdf
Conversely the Antarctic has no multi-year ice.
This is not true. “Multiyear ice is much more common in the Arctic than in the Antarctic. This is because ocean currents and atmospheric circulation move sea ice around Antarctica, causing most of the ice to melt in the summer as it moves into warmer waters, or as the upper ocean heats up due to absorption of solar heat by open water areas. Most of the multiyear ice that does occur in the Antarctic persists because of a circulating current in the Weddell Sea, on the eastern side of the Antarctic Peninsula.”
http://nsidc.org/seaice/characteristics/multiyear.html
The portion of Antarctic Sea Ice that remains each year can be seen here:
Serreze and others are talking about the Arctic sea ice melting out in the summer as early as 2030 (others have even said 2013 but that was obviously an unphysical exggeration).
Serreze and others are fitting polynomial functions to the sea ice minimum which is where they get the 2030 or 2045 from. But this is also unphysical and I will show you why.
Here are the trends in Arctic sea ice since 1972. We start the year out with sea ice at about 14.0M km2; there is a little over 9.0M km2 of melt during the season and we have minimum in mid-September of around 5.0M km2.
http://img850.imageshack.us/img850/5617/nhseasonaltrends2011.png
The March Maximum is slowly declining, the Melt during the season is slowly increasing and the September Minimum is decreasing a little faster (being the combination of those other two factors).
If we take these as linear lines, there is still sea ice left in the summer by 2100.
http://img199.imageshack.us/img199/9575/nhseasonaltrendsto2100.png
But Serreze and others note that the sea ice Minimum looks more like a polynomial function (the R^2 for a 2nd Order polynomial is actually a little higher than the linear one and the 3rd Order Poly is even higher than both). So it we extend those functions out for 25 years, we get no sea ice in 2030 or 2050 or something.
But if we extend those functions forwards “and backward” in time, we get sea ice doing all kinds of wierd things which means global warming resulting in a Poly is not the true trend or that there is some other unusual cycles that do not match the history. The Polys cannot be justified.
2nd order then 3rd order.
http://img198.imageshack.us/img198/7831/nhseastrpoly.png
http://img839.imageshack.us/img839/5459/nhseastr3poly.png
@De’Aleo
“It has nothing to do with CO2, showing poor correlation and since cold open arctic
icewater is a significant sink for atmospheric CO2 just as warm tropical waters are the primary source.”Fixed it for ya!
Yes, I cant wait until 2012 and 2013, when we finally break that 2007 minimum. So alarmists can begin to claim victory while the rest of us know that in 10 years, the arctic ice will grow to above its 30 yr average. Of course, this is all based on speculation and no facts, much like 90% of the comments here. I like the hand picked facts, and throwing around comments like “oooh, 2007 minimum is only 30 years old” and “ooh we’re in recovery, up 6.5%”.
People, read a bit. understand volume, extent and area, and the differences and significances of these. The next few years should be interesting. Low volume, increased activity due to solar cycle, weather patterns coinciding… 2007 was a one-in-10 year weather pattern. Hm, that gives us about 6 years within which to statistically repeat that.
Consider lowest arctic extent, area, and volume in the last 5 years, out of a minimum 30yr average, add to that solar cycle and weather pattern. What do you all think you will get? I expect a bombardment of fact-free opinion and little evidence or reference to observable and recorded trends.
Anyway, there are better sites with more data out there. SKip over scientific info if you like, but dont blame anyone else when your wake up call isnt what you expect it to be.
HAHA, I’ve been labelled an alarmist. Cute.
I really wish you would not state solar/temp cycle connections unless you also state your mechanism. Your rest of your article goes on to explore connections with natural intrinsic variability and drivers but does not mention your main opening statement related to solar changes. In my opinion the underlying mechanism has yet to be shown or given rigorous peer review. Correlations are weak when considering longer time spans.
However, since your included your solar connection position, a better way to state what you said, that “…The arctic temperatures and arctic ice extent varies in a very predictable 60-70 year cycle that relates to ocean cycles which are LIKELY [my emphasis] driven by solar changes…”, would be to say, “…which MAY be connected to solar changes as one of the drivers.” By saying it thusly, you would be free to include your proposed mechanism without suffering accusations of unfounded statements.
Kasuha, what extra rampant solar heat? Do you have comparative numbers for that, measured above Earth’s atmosphere (Earth’s atmosphere has a habit of varying the amount of solar heat that reaches the Earth’s surface)? I don’t recall any solar scientist stating that the Sun has been extra and unusally hot to the extent that the Earth would notice.
Lazyteenager, yes it can. Dry air is both warmer and colder. Let me explain. When there is little evaporation going on, the air is dryer. And a slow down in evaporation means that the air is colder, not warmer. How do I know? Warm air causes the oceans to cough up water vapor when the air is warmer than the ocean. Cold air slows down this process, resulting in less water vapor. A cold ocean combined with cold dry air is a killer.
And now for the warmer part. When this dryer air moves over land, this translates into seasonally higher day time summer temps (solar heat is not reflected away by water vapor) with cooler nights, and bitter cold day and night winter temps (stronger radiative cooling in the absence of water vapor), just like the daily change in dry desert temps.
It is during these conditions that you can get a huge spread between maximum and minimum temps in a single spring or fall day in the Western half of the US, as much as a 70 to 80 degree difference. So yes dryer air can be both warmer and colder.
Just The Facts says:
September 17, 2011 at 7:50 am
Thank you. I was obviously not looking hard enough.
Pamela Gray says:
September 17, 2011 at 8:55 am
=====================================
Pamela, thank you for that!
I was having a hard time with it too……….
Alarmist says:
September 17, 2011 at 8:15 am
I expect a bombardment of fact-free opinion and little evidence or reference to observable and recorded trends.
Thanks for giving us one.
Accusations of cherry picking from the sidelines:
http://tamino.wordpress.com/2011/09/17/cold-cherries-from-joe-daleo/
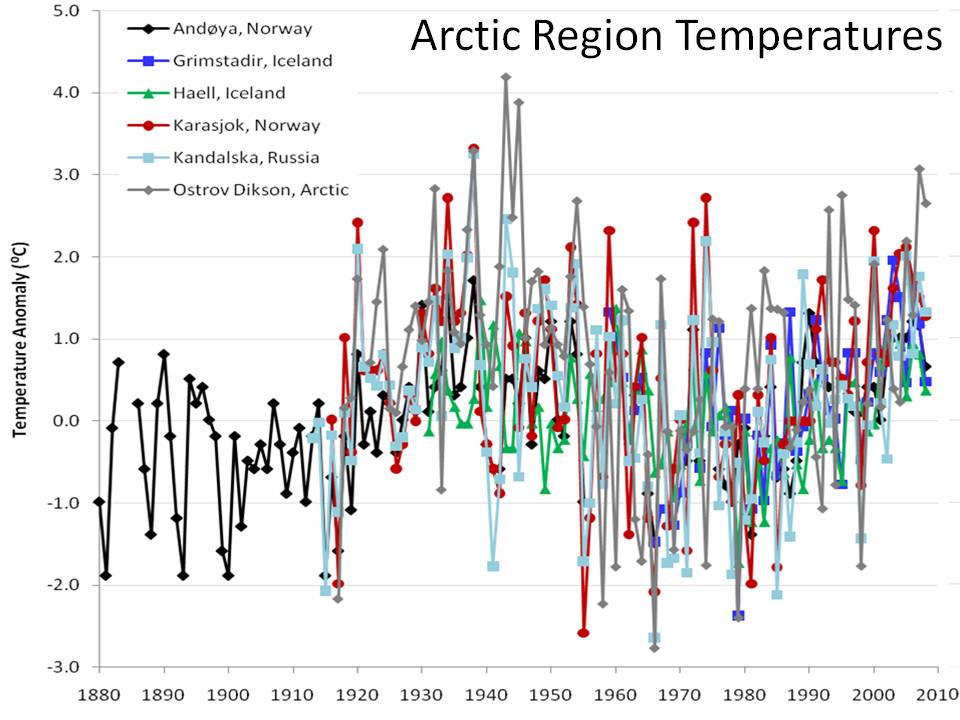
The plot of Arctic temperature in D’Aleo’s post uses only a very small subsection of available data, and happens to show the mid-20th century being warmer than the present. This isn’t a result that you get when looking at all available 137 Arctic stations, rather than just D’Aleo’s 6.
If there is a strong case to be made, it should be possible to make it without this sleight-of-hand. Including more data can ONLY make conclusions more robust, even if it takes away some of the ‘wow’ factor. This is the kind of thing that makes me highly suspicious of D’Aleo’s motives. Is he trying to make a robust case, or a weak, unscientific case that might make you go ‘wow’ at first but doesn’t stand up to scrutiny?
A good WUWT posting, nearly one year ago:
http://wattsupwiththat.com/2010/10/25/soot-ahoy-ship-traffic-in-the-arctic/
I believe that ocean traffic through the Arctic has had a greater influence on loss of ice than has been acknowledged by the hockey team. Certainly, the Russians find cross-Arctic shipping to be to their advantage! We are probably looking at the “new normal,” with Arctic sea ice extent around 4 M sq.km. minimum. I doubt we will ever get to an ice-free Arctic, unless the icebreakers really go at it.
Pamela Gray says:
September 17, 2011 at 8:55 am
I have found examples of diurnals in N. Calif. reaching 70 degrees. Most times, it ranges from 50 to 60 degrees. The 70 degree diurnals are found exclusively in the 1930’s. It was bad.
Stu N says:
September 17, 2011 at 5:13 pm
Quite possibly right…I should look into the details. But Tamino knows cherries well himself, particularly on this topic. Do a search on his site for “Bremen”. You’ll find one posting…one where he points out how Bremen set a record low in ice extent this year. Not once in all his other ice postings has he mentioned or shown the Bremen data (at least to my knowledge, agreeing with the search on his site…please let me know if this assertion is otherwise in error). Also, he’s almost always focused on monthly data because it avoids the daily noise…yet he calls out this daily record even though there’s a fair chance even Bremen won’t show 2011 as the record low for the monthly average?
-Scott
CRS, Dr.P.H. says:
September 17, 2011 at 5:20 pm
I concur. The effect of increased shipping and ice-breakers on sea-ice extent minima is certainly worthy of investigation. It would be an ideal topic for a PHd. thesis, IMO.
Trouble is, where is the funding going to come from? Environmentalists don’t want to hear that Arctic Ice decline is caused by anything other than CO2, while “Big Oil” want to open up the area for exploitation, ideally without be accused of destroying the ice.
BTW, Scott. Notice the slight drop in the IJIS extent yesterday? A bit more support for my “secondary minmum” theory.
Wriggly lines cause Global Warming.
“You’ll find one posting…one where he points out how Bremen set a record low in ice extent this year. Not once in all his other ice postings has he mentioned or shown the Bremen data (at least to my knowledge, agreeing with the search on his site…please let me know if this assertion is otherwise in error). Also, he’s almost always focused on monthly data because it avoids the daily noise…yet he calls out this daily record even though there’s a fair chance even Bremen won’t show 2011 as the record low for the monthly average?”
Yes, I think that’s Tamino’s only mention of Bremen data. And it was only briefly mentioned in a post where says how busy he’s been. Perhaps if he had more time he’d have qualified the statement more. Still, in the same post he mentions lots of other datasets, some of which indicate a record low, and some which don’t. Can that really be called deliberate cherry-picking?
That’s a high standard to hold him to, I reckon.
Anything Possible:
“The effect of increased shipping and ice-breakers on sea-ice extent minima is certainly worthy of investigation. It would be an ideal topic for a PHd. thesis, IMO.”
Four or five ships a year cannot be responsible for the massive Arctic-wide loss in ice thickness, which is much more pronounced that either area or extent. Ice melts from below, not from the sides. While this year’s extent is about the same as 2007,. volume is 30% less because of thickness loss. Final loss in area and extent are likely to be highly non-linear because of this. Anyone who has seen a lake melt in the spring will tell you the same thing.
Stu N says:
September 17, 2011 at 8:17 pm
You’re probably right, it is a high standard to hold him too. Not too different from the standards he seems to hold for people he disagrees with though. I don’t consider it at all a coincidence that the first time he brings up a data set (that’s been around since before he started posting on a topic that he’s posted on a dozen times or more) is when it and it alone sets a record.
I guess I shouldn’t hold people to the standards they hold for other people.
-Scott
Anything is possible says:
September 17, 2011 at 7:53 pm
Yep, that drop caused my prediction of 2011 surpassing 2008 on the daily value on Sept 16 to be off hardcore. The preliminary number for the 17th also shows a small decline. Still don’t know if I call it a secondary minimum though… 😛
-Scott
“Not too different from the standards he seems to hold for people he disagrees with though.”
I would disagree, given that it’s my informed opinion that Tamino has penned blog posts on some very serious cherry picking, and other issues. Your example is a rather tortured definition of cherry picking, given that he also mentions the majority of other datasets in the same breath and then describes the situation they present. It’s not as if there’s some other dataset showing the complete opposite that he conveniently ignored, is it?
Socratic says: September 17, 2011 at 9:04 pm
Four or five ships a year cannot be responsible for the massive Arctic-wide loss in ice thickness, which is much more pronounced that either area or extent.
While obviously not responsible for the majority of the sea ice decreace, “There were approximately 6,000 individual vessels, many making multiple voyages, in the Arctic region during the AMSA survey year; half of these were operating on the Great Circle Route in the North Pacific that crosses the Aleutian Islands. Of the 6,000 vessels reported, approximately 1,600 were fishing vessels.”
“The AMSA has developed the world’s first activity-based estimate of Arctic marine shipping emissions using empirical data for shipping reported by Arctic Council member states. Emissions were calculated for each vessel-trip for which data was available for the base year 2004. The 515,000 trips analyzed represent about 14.2 million km of distance traveled (or 7.7 million nautical miles) by transport vessels; fishing vessels represent over 15,000 fishing vessel days at sea for 2004. Some results could be an underestimation of current emissions, given potential underreporting bias and anecdotal reports of recent growth in international shipping and trade through the Arctic.”
“A specific example of where cruise ship traffic is increasing at a rapid rate is off the coast of Greenland. As Table 5.3 shows, cruise ship visits and the number of passengers visiting Greenland has increased significantly between 2003 and 2008. For example, between 2006 and 2007, port calls into Greenland increased from 157 to 222 cruise ships. The number of port calls in 2006 combined for a total of 22,051 passengers, a number that represents nearly half of Greenland’s total 2006 population of 56,901.
In 2008, approximately 375 cruise ship port calls were scheduled for Greenland ports and harbors, more than double the number of port calls seen in 2006.”
“The 2004 U.S. Commission on Ocean Policy reported that, while at sea, the average cruise-ship passenger generates about eight gallons of sewage per day and an average cruise ship can generate a total of 532,000 to 798,000 liters of sewage and 3.8 million liters of wastewater from sinks, showers and laundries each week, as well as large amounts of solid waste (garbage). The average cruise ship will also produce more than 95,000 liters of oily bilge water from engines and machinery a week. Sewage, solid waste and oily bilge water release are regulated through MARPOL. There are no restrictions on the release of treated wastewater.”
“During 2004-2008, there were 33 icebreaker transits to the North Pole for science and tourism. An increasing number of icebreakers and research vessels are conducting geological and geophysical research throughout the central Arctic Ocean related to establishing the limits of the extended continental shelf under UNCLOS.”
http://www.pame.is/images/stories/PDF_Files/AMSA_2009_Report_2nd_print.pdf