By Joseph D’Aleo, CCM, AMS Fellow
The arctic ice appears to have bottomed out at a level 6.4% higher than the 2007 record. Mark Serreze of the National Snow and Ice Data Center says the Arctic could be ice-free in the summer by about 2030, though that is hard to predict; other scientists say it could be mid-century before that dramatic point is reached. The article continues Why does this matter? Ice that’s floating on the sea surface doesn’t raise the sea level when it melts. But researchers suspect it will alter the weather that reaches us far to the south. It’s already affecting Arctic wildlife.
Thousands of walruses that usually float around on sea ice and dive down to feed on the ocean floor abandoned those floes when the only ice left off the coast of Alaska was over water that was too deep. Walruses spend 2/3rds of their time in water and like the polar bear the talk of their demise will likely be proven wrong. Polar bear populations are at record highs. Here is today’s ice plot versus 2007.

The temperatures in the arctic have indeed risen in recent years and ice has declined, bottoming out in 2007 but it is not unprecedented nor unexpected. The arctic temperatures and arctic ice extent varies in a very predictable 60-70 year cycle that relates to ocean cycles which are likely driven by solar changes. It has nothing to do with CO2, showing poor correlation and since cold open arctic ice is a significant sink for atmospheric CO2 just as warm tropical waters are the primary source.
In 2007, NASA scientists reported that after years of research, their team had assembled data showing that normal, decade-long changes in Arctic Ocean currents driven by a circulation known as the Arctic Oscillation was largely responsible for the major Arctic climate shifts observed over the past several years. These periodic reversals in the ocean currents move warmer and cooler water around to new places, greatly affecting the climate. The AO was at a record low level last winter explaining the record cold and snow in middle latitudes. A strongly negative AO pushes the coldest air well south while temperatures in the polar regions are warmer than normal under blocking high pressure. See post here.
We agree. And indeed both oceans play a role. In the record-setting (since satellite monitoring began in 1979) summer melt season of 2007, NSIDC itself before funding opportunist Serreze took over editorial control, noted the importance of both oceans in the arctic ice.
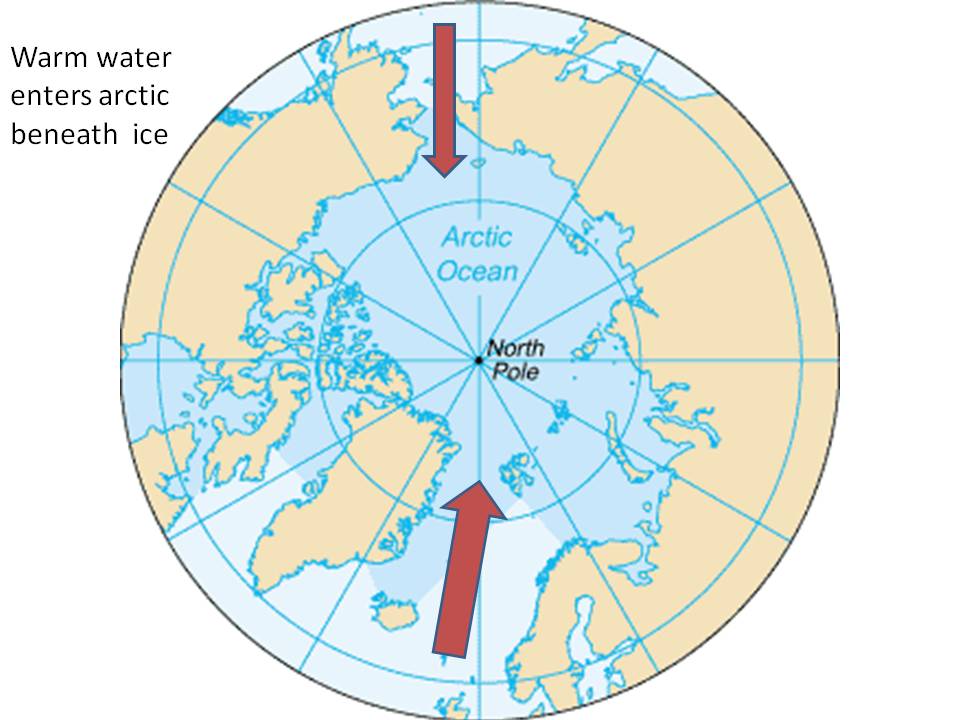
“One prominent researcher, Igor Polyakov at the University of Fairbanks, Alaska, points out that pulses of unusually warm water have been entering the Arctic Ocean from the Atlantic, which several years later are seen in the ocean north of Siberia. These pulses of water are helping to heat the upper Arctic Ocean, contributing to summer ice melt and helping to reduce winter ice growth.
Another scientist, Koji Shimada of the Japan Agency for Marine-Earth Science and Technology, reports evidence of changes in ocean circulation in the Pacific side of the Arctic Ocean. Through a complex interaction with declining sea ice, warm water entering the Arctic Ocean through Bering Strait in summer is being shunted from the Alaskan coast into the Arctic Ocean, where it fosters further ice loss. Many questions still remain to be answered, but these changes in ocean circulation may be important keys for understanding the observed loss of Arctic sea ice.”

Enlarged here.
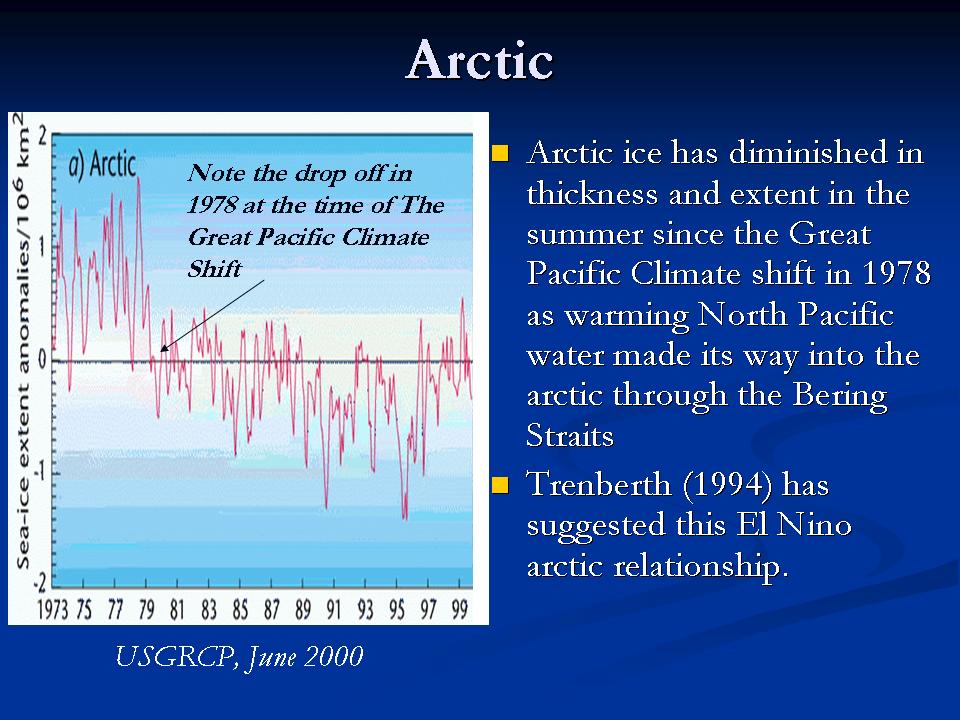
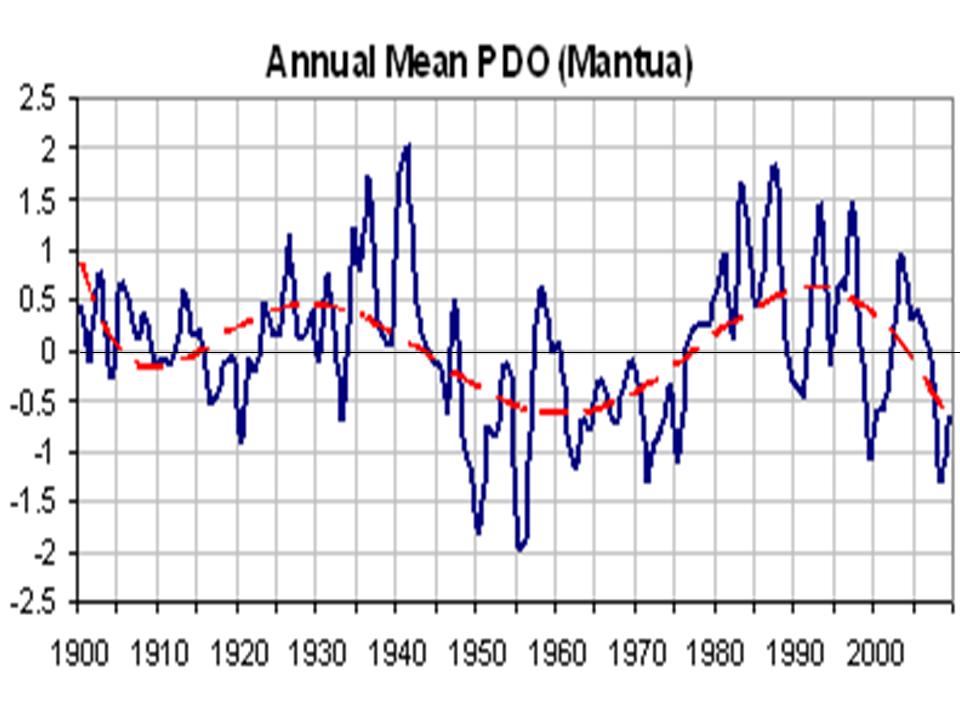
The Pacific warm mode favors more El Ninos and warmer water in the far northern Pacific including the Bering Straits. The PDO flipped into its warm mode in 1978 and the arctic temperatures began to warm and ice began to melt.

Enlarged here.

Enlarged here.
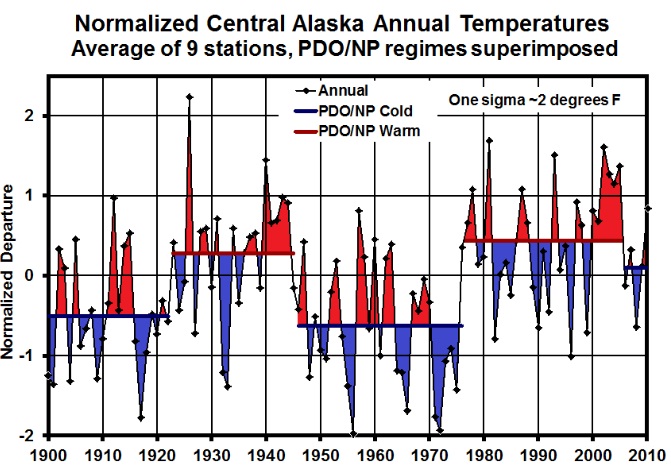
Notice how the temperatures in Alaska go through step changes tied to the PDO (Keen).

Enlarged here.
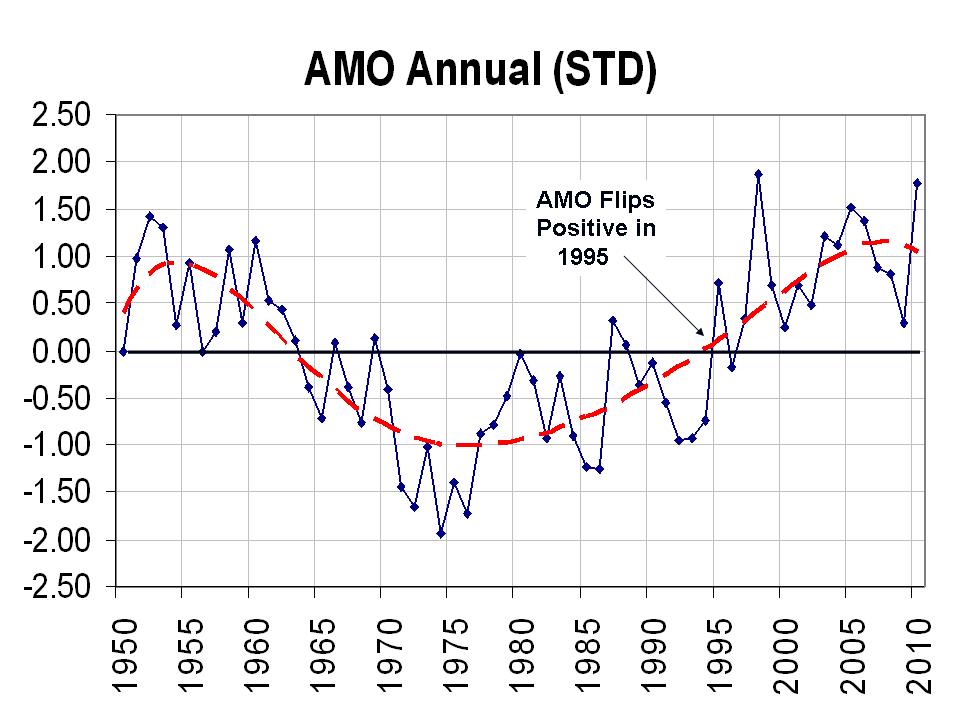
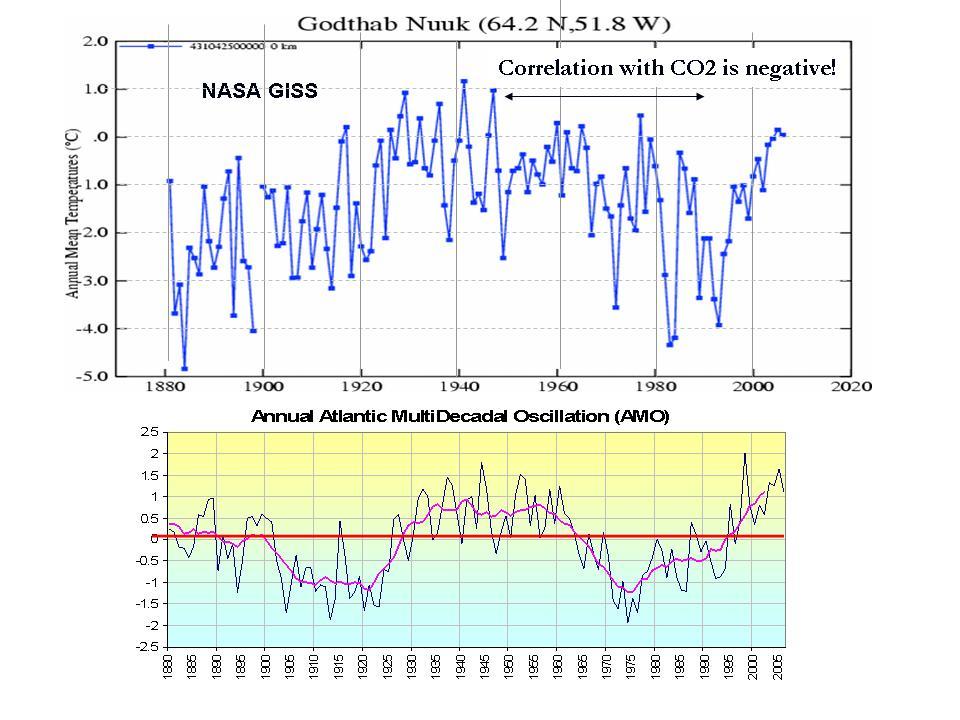
The Atlantic also cycles on a 60-70 year period. The Atlantic Multidecadal Oscillation or AMO returned to the positive warm mode in 1995.

Enlarged here.
Frances et al. (GRL 2007) showed how the warming in the arctic and the melting ice was related to warm water (+3C) in the Barents Sea moving slowly into the Siberian arctic and melting the ice. She also noted the positive feedback of changed “albedo” due to open water then further enhances the warming.
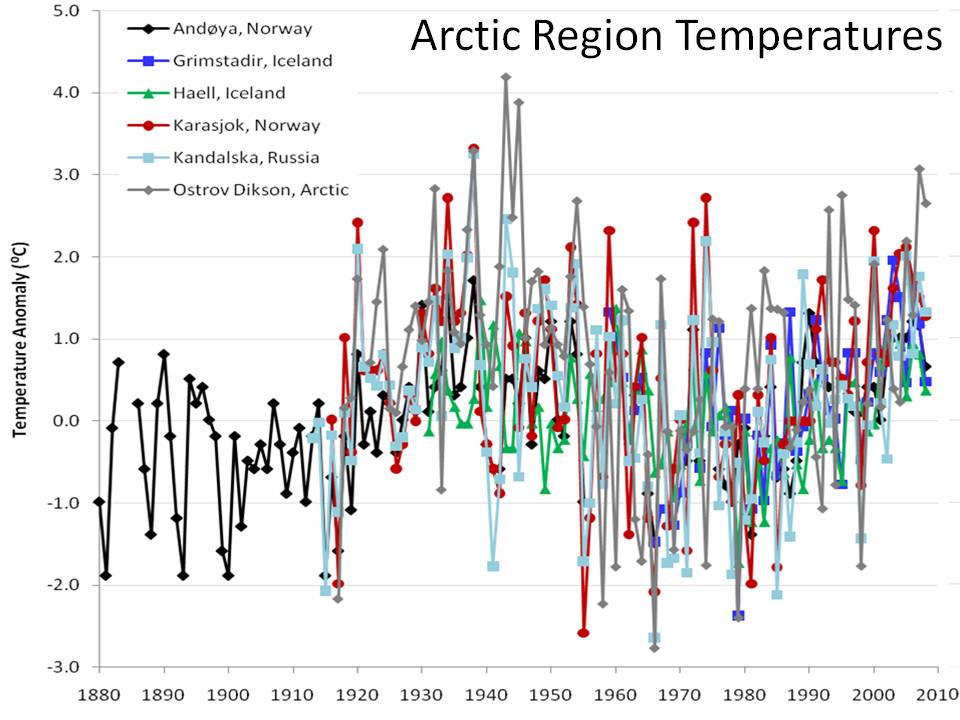
The International Arctic Research Center at the University of Alaska, Fairbanks showed how arctic temperatures have cycled with intrusions of Atlantic water – cold and warm.

Enlarged here.
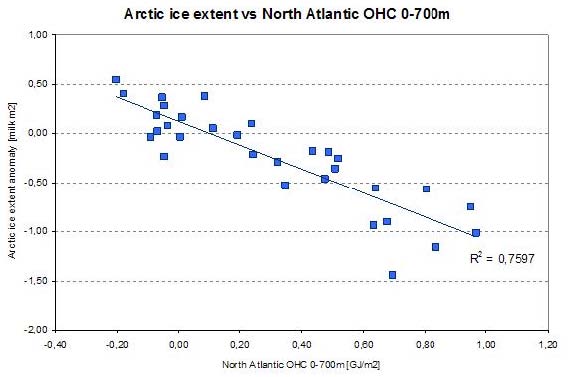
The correlation was also confirmed by Juraj Vanovcan.

Enlarged here.
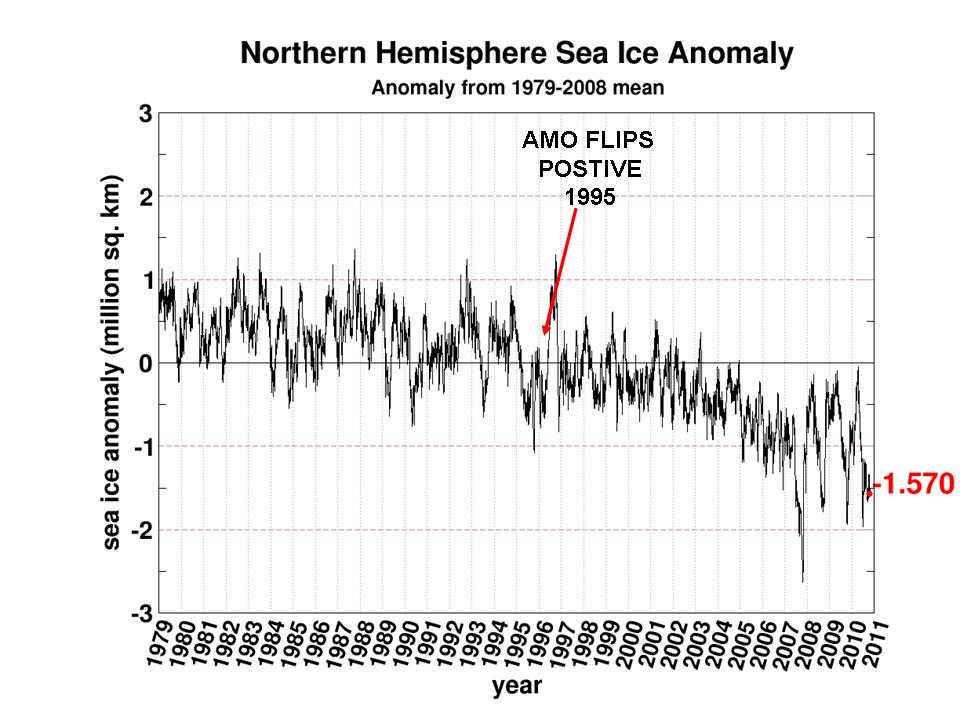
See how quickly the arctic ice reacts to warming of the Atlantic sea surface temperatures in 1995 (source Cryosphere Today). This marked a second leg down. We have seen large swings after the big dip in 2007 following a peak in Atlantic warmth in 2004-2005.

Enlarged here.
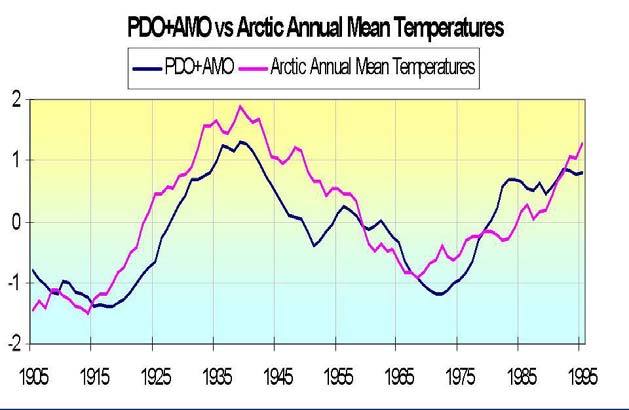
Although the PDO and AMO are measured differently, both reflect a tri-pole of ocean temperatures. Both have warm north and tropics and cool relative to normal in between in the positive phase and cold north and tropics and warm in between in the negative phase. By normalizing the two data sets and then adding the two, you get a measure of net warmth or cooling potential for both global and arctic temperatures. See how well the sum tracks with the arctic temperatures. Though we don’t have measurements of ice extent, there are many stories and anecdotal evidence that arctic ice was in a major decline from the 1920s to 1940s.

Enlarged here.
At the edge of the arctic Greenland behaves in the same way – with warming and cooling tied to the AMO.

Enlarged here.
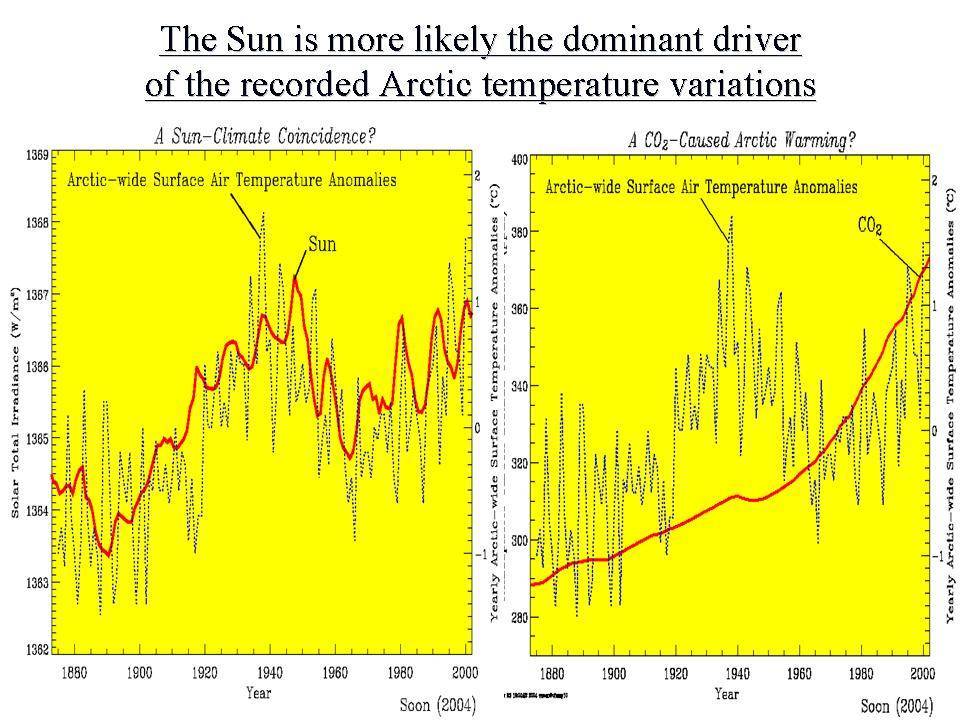
Dr. Willie Soon has shown how the arctic temperatures match the solar Total Solar Irradiance (Hoyt/Schatten/Willson) well. Correlation is poor with CO2.

Enlarged here.
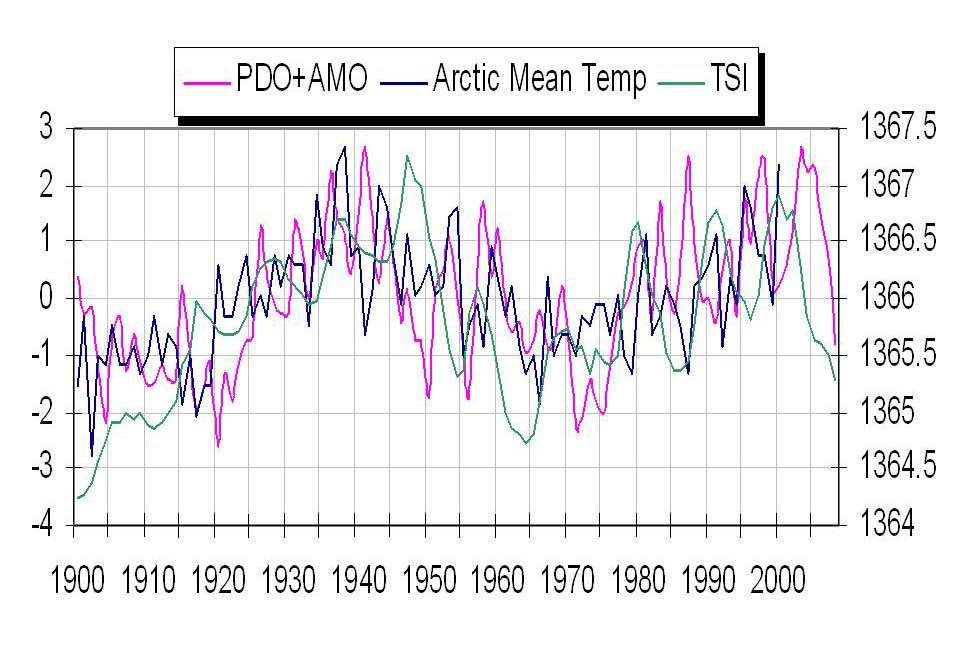
We see here how the annual TSI and annual PDO+AMO track together with arctic temperatures.

Enlarged here.
Though the current spike in the Atlantic temperatures and more high latitude blocking may cause another spike of melting in the next few winters as warm water from the AMO pop the last year works its way into the arctic, longer term you can expect arctic temperatures to decline and ice to rebound as the Pacific stays cold and the Atlantic cools and the sun stays in its 213 year Eddy minimum.
That doesn’t preclude some very cold and snowy winters short term. In 2008 glaciologist Bruce Molnia reported a bitterly cold Alaskan summer of 2008 following a La Nina winter with extreme cold and heavy snows resulted in area glaciers to expand, rather than shrink for the FIRST TIME IN RECORDED HISTORY. Summer temperatures, which were some 3 degrees below average, allowed record levels of winter snow to remain much longer, leading to the increase in glacial mass for the first time in at least 250 years.
See PDF here. See Verity Jones recent post on the arctic data here.

Enlarged here.
See more on glaciers and icecaps here.
See post by Arnd Bernaerts on Verity Jones’ Digging in the Clay here with much more on the arctic. See also here how the decade is almost up for the arctic ice disappearing here.
Well, I think our friend Joe is just going to copy/paste that same post every year
http://wattsupwiththat.com/2010/11/01/arctic-temperatures-and-ice-%E2%80%93-why-it-is-natural-variability/
Looks similar, no?
Tallbloke says: “True, but unimportant. Soon has also demonstrated that sunshine hours correlates well with surface temperature elsewhere.”
Elsewhere does not help this post.
tallbloke says: “Why doesn’t someone produce datasets of these major oceanic oscillations which can be compared and added?”
I don’t recall seeing this question before, tallbloke. Let me reply with a question. Why not simply plot the sea surface temperature anomalies of the combined dataset and then detrend them as necessary? All of the major SST anomaly datasets are available through the KNMI Climate Explorer. It only takes a few moments to go to the website, select the dataset, input the coordinates and download the data.
“National Snow and Ice Data Center says the Arctic could be ice-free in the summer by about 2030, though that is hard to predict; other scientists say it could be mid-century before that dramatic point is reached. ”
All the various ice charts have a similar pattern where maximum melt starts, which from my humble observations looks to start around June 1st at an average rate of 1mil square k/10 days for around 60 days. Thats a maximum rate of around 6 mil square K. To get to ice free the ice would need to get down to around 2 mil sq k by August. Which means the start point needs to be 2 mil square k lower and therefore maximum ice needs to be lower . The difference between max and min appears to be between 8 and 10 mil sq k, so the start point for an ice free arctic would need to be a max area/extent of around 8 / 10mil sq k. IMHO
How possible is that?
Correction:
since cold open arctic ice
Is wrong. It should read;
since cold open arctic water
It has nothing to do with CO2, showing poor correlation and since cold open arctic ice is a significant sink for atmospheric CO2 just as warm tropical waters are the primary source.
———-
Badly expressed. Seems to have started a line of thought and then gone off on a tangent so that the whole does not make sense.
The AO was at a record low level last winter explaining the record cold and snow in middle latitudes
——–
So a 60-70 year long cycle can explain both record cold in winter and record warmth in summer at the same time?
I guess I am conflicted. I like the fact that mother nature is making fools of the alarmist so-called scientists. I enjoy seeing their predictions fail.
But I must admit I would like to see the planet warm about 4 degrees or more. Warm is good; cold is not.
When the Arctic warms, the Antarctic cools? That’s why it’s called “Ant-“. 😀
Coincidentally one of the guys from that row to the poll expedition – you know the one that didn’t make it because of the ice – is going to be (or has been if you are reading this later) on BBC R4 this morning (Saturday 17th).
http://www.bbc.co.uk/programmes/b014lzg7
The interviewer John McCarthy likes his travellers who also “campaign about global warming” so I doubt there will be a question about whether they made it or not. He was one of the two Brits held in Beirut for a long time in the 1980s.
Sorry, I pasted this comment accidentally into the other tread.
In the North Atlantic is not so much ‘global warming’ as the redistribution of the available heat energy. The N. Atlantic warm drift current splits into 2 branches; http://wattsupwiththat.files.wordpress.com/2011/08/ocp07_fig-6.jpg?w=600&h=473
higher the Atlantic inflow across the Greenland-Scotland ridge warmer the Arctic.
In contrast the Arctic’s cold waters overflow will eventually cool US Atlantic coastline.
It is to do with strength of the Subpolar gyre, complex system of currents located to the south of Greenland, that circulates anticlockwise between 50°N and 65°N.
Subpolar gyre is the engine of the heat transport across the North Atlantic Ocean, and is the essential component of the northern Atlantic basin’s climate system.
This is clearly shown in the dataset (I assembled just over a year ago)
http://www.vukcevic.talktalk.net/SST-NAP.htm
and goes back to 1650
http://www.vukcevic.talktalk.net/CDr.htm
If correct it shows that the N. Atlantic area will cool in forthcoming decade or two.
Bob Tisdale says:
September 16, 2011 at 7:50 pm
………………
Hi Bob
Re your comment from the other day: It is from the North Atlantic SST showing difference between summer JJA and winter JFM months:
http://www.vukcevic.talktalk.net/Data.htm
Joe, in the same 2007 article that you refer to as “before funding opportunist Serreze took over editorial control”, NSIDC writes :
Climate models have long told us that as greenhouse warming takes hold, rises in surface temperature over the Arctic Ocean will be especially large compared the rest of the Northern Hemisphere. A key part of this so-called “arctic amplification” is the growing impact through time of the very process just described.
http://nsidc.org/arcticseaicenews/2007.html
So besides an unsubstantiated ad hominem at Serreze, your claim that “It has nothing to do with CO2” has no scientific basis at all and contradicts not just our understanding of Arctic amplification, but even radiative transfer theory itself. Do you have any science to back up your rather unorthodox statement that “It has nothing to do with CO2” ?
before funding opportunist Serreze took over editorial control,
——–
Gratuitous ad hominem. Roger doesn’t approve of that.
““One prominent researcher, Igor Polyakov at the University of Fairbanks, Alaska, points out that pulses of unusually warm water have been entering the Arctic Ocean from the Atlantic, which several years later are seen in the ocean north of Siberia. These pulses of water are helping to heat the upper Arctic Ocean, contributing to summer ice melt and helping to reduce winter ice growth.”
The Atlantic Ocean continues to widen by several cm per year. Therefore the ocean gap between Greenland and Norway is widening also. Also I thought the gulf stream was weakening?
Just The Facts says:
September 16, 2011 at 8:26 pm
“Between 2005 and 2008 (Figure 1), the Arctic Ocean lost 42% of its multiyear ice (MYI = ice which survives at least one arctic summer) coverage.”
I am unable to find anywhere a measurement of what the max expected age of MYI. The only definition is the one above, which would mean that as all the ice cannot be melted in one season (yet) movement of ice out of the Arctic is a massive contributor to the yearly melt season. As has been stated by several commentators previously. Conversely the Antarctic has no multi-year ice.
‘Thousands of walruses that usually float around on sea ice and dive down to feed on the ocean floor abandoned those floes when the only ice left off the coast of Alaska was over water that was too deep’
I wonder what research is available to show the limit of the walrus’s abililty to feed off the sea bed,
and is there only deep water in sea areas away from land?.
——
That is a pretty signicant curve upwards in the graph and is not likely to change back if the cold has arrived two weeks early. Let’s hope the figures show a dramatic increase in ice cover over the next few weeks, the reduction of which, in recent years, has been the lynch pin upon which the false arguments supporting AGW is the means by which the cult have succeeded in spreading their scare stories. Trenbeth, Hanson, Mann et al must be having a pretty miserable time having read the latest Arctic Ice stats.
Rob asked Joe D’Aleo: “So besides an unsubstantiated ad hominem at Serreze, your claim that ‘It has nothing to do with CO2’ has no scientific basis at all and contradicts not just our understanding of Arctic amplification, but even radiative transfer theory itself. Do you have any science to back up your rather unorthodox statement that ‘It has nothing to do with CO2’ ?”
Polar amplification occurs regardless of the cause of the rise or fall in surface temperatures.
http://bobtisdale.wordpress.com/2011/01/15/notes-on-polar-amplification/
If you don’t want to believe the data I’ve presented, you can refer to the following RealClimate post:
http://www.realclimate.org/index.php/archives/2007/12/tropical-troposphere-trends/
There RealClimate notes, “They both have the same enhancement in the tropics and similar amplification in the Arctic.” And they continue, “If the pictures are very similar despite the different forcings that implies that the pattern really has nothing to do with greenhouse gas changes, but is a more fundamental response to warming (however caused).”
I presented this in an earlier post on polar amplification:
http://bobtisdale.wordpress.com/2009/06/06/another-look-at-polar-amplification/
Regards
Looking at arctic ice anomaly, arctic ice seems to be declining much slower (if at all) since 2007. That’s not only about minima but about the whole anomaly.
And if we consider that arctic would become completely iceless, wouldn’t it act like very powerful cooler due to change to the albedo?
The extra heat pumped into the oceans by three rampant solar cycles is dissipating into the arctic. The open waters allow huge amounts of heat to be swallowed by the night sky. One decade is about the life cycle of of extra heat until it meets the ice. The sun has been dozing for around a decade and the oceans are now cooling, so no new heat in the pipe line, throw in a double dip La Nina and your tomatoes will have problems. May the fire gods be appeased for one or two large volcanoes in the coming years will be painful. Nit picking about the science that makes which ocean current go where and why is irrelevant when it can be measured.
Our world tries it’s darndest to maintain an equitable temperature with an unplumbed heat pump activated by the sun using water as a refrigerant. The perturbations that disturb the system are many and varied as shown by thousands of scientific papers. There are leads and lags in the system but the Earth does a pretty good job of keeping us alive. The time has come for an holistic look at how our Earth operates, an overview without bias or political agenda.
Holistically the melting of arctic ice is the world ridding itself of excess heat in the oceans, it has worked a treat as the oceans are no longer rising or getting hotter. The inertia in the system will with lessor heat imput overshoot, and as JOE says we will get colder for a time.
.
“What it’s telling us is that the long-term decline in Arctic sea ice is continuing, and even appears to be accelerating at this point,” he says.
Sounds to me like Serreze is in denial. I guess he’s still hoping for a miracle to save his “arctice ice death spiral”.
Interesting how they’ve latched onto walruses now, since polar bears didn’t work out so well for them.
Trevor Johansen (@TJexcite) says:
It is all about the headline….Second lowest on record….missing that the record is only 4 years old and the whole record is only 30 years long.
The latter being especially significent if there is a 60-70 year cycle involved. You’d really want a record of at least 120-140 years!
Bob Tisdale says:
The Hoyt and Schatten TSI reconstruction is obsolete. It was created to explain the warming in the early portion of the 20th Century. I understand that Hoyt no longer agrees with that reconstruction, yet it continues to be referenced and used in comparisons.
In other words it’s a mathematical/computer model. One of the people who created it thinks they got it wrong. So it probably is of little practical use.
Trenbeth, Hanson, Mann et al must be having a pretty miserable time having read the latest Arctic Ice stats
They never believed one word of what they said. They are not in it for the science but for the political prestige and money.
“What it’s telling us is that the long-term decline in Arctic sea ice is continuing, and even appears to be accelerating at this point,” Serreze
==================================================================
We are all being played for fools…..
When you allow the very people claiming it’s not normal……to define what is normal.
example: Look at where the ‘normal’ ice boundary line is drawn on their maps….
…and stop and think about natural variability
Russians would have never built sea ports there….
…if that were truly Arctic ice extent…..there would have been years that they couldn’t even get to their sea ports
Once they got away with defining what is normal…..it’s easy to make the science fit that
janama says:
If global warming is causing the increase in Arctic ice melt how come the Antarctic Ice is increasing at .9% per decade?
In the Arctic you have an ocean surrounded mostly by land. If you look at the Arctic circle on a globe you will find a lot of land, quite a bit of the water consists of lakes and bays rather than ocean. In the Antarctic you have land surrounded by ocean. If you look at the Antarctic circle you will find virtually all ocean. The peninsula is the only part of Antarctica which extends significently to the North.
The Arctic and Antarctic are very much “polar opposites”.