In Debunking National Wildlife Federation Claims – Part 2 some commenters claimed that the snow data cited from WRI “was not good enough”. OK then, on to a bigger catchment. Steve Goddard replies in this brief essay.
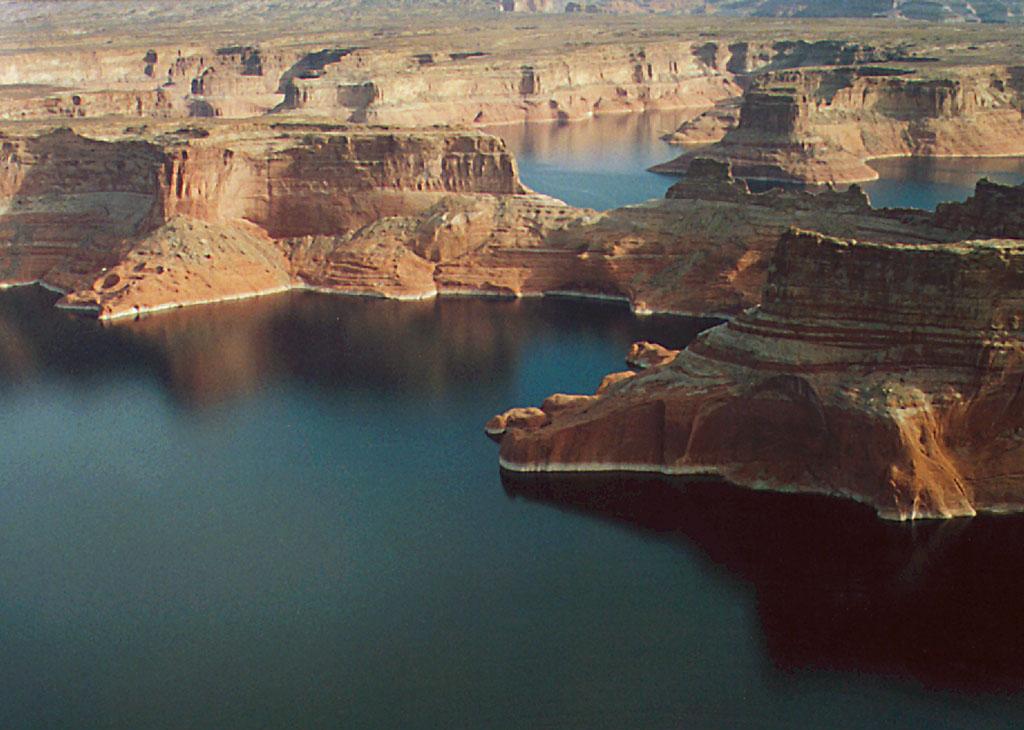
From Wikimedia: Lake Powell from above Wahweap Marina. July 2004, by Dave Jenkins
Lake Powell (Arizona and Utah) provides a good proxy for western slope snowfall, because much of the snow in Wyoming, Colorado, Utah and Northwestern New Mexico drains into the lake via the Colorado, Green and San Juan Rivers. The lake currently contains more than 4.5 trillion gallons of water and is 490 feet deep at the dam.
Between 2000 and 2005, drought conditions (combined with greatly increased water usage in Arizona, California, Nevada and Colorado) caused Lake Powell levels to drop nearly 120 feet. This prompted a considerable consensus of global warming hysteria.
Every scientific study confirms that global warming will cause the amount of water in the Colorado River to decline
But a strange thing happened in 2006 – the lake level stopped declining and instead started increasing rapidly. As you can see in the table below from lakepowell.water-data.com, since 2005 the lake elevation has increased by more than 60 feet above the 2005 low of 3562 ft. As of January 29, at 3622 ft. the lake is within three feet of the January 29 average of 3625 feet elevation. The volume of water in the lake has increased by 65% in the last five years to 4.5 trillion gallons. (At movie theater prices for bottled water, that could almost erase the US National Debt.)
The yearly change in volume is determined by the formula :
delta H = inflow – outflow – evaporation – seepage
Evaporation is relatively constant from year to year as is seepage, so the formula can be written as:
delta H = inflow – outflow – K
Outflow (water usage) has greatly increased over the last few decades due to massive population increases in Phoenix, Las Vegas and Southern California – not to mention the large and ever increasing amount of water being used by the biofuels industry. (It has been estimated by the University of Twente in The Netherlands that the manufacture of one liter of biodiesel requires 14,000 liters of water).
The point being that despite large increases in outflow, the lake level has been rapidly recovering. This could be due to only one explanation – lots and lots of snow in the Rocky Mountains during the last five years.
And an extra bonus from the “weather is not climate” department – January 29, 2010 at 39.9 degrees was ten degrees below normal and the second coldest on record.
Lake Powell (Arizonaand Utah) providesa good proxy for westernslope snowfall,because much of the snow in Wyoming,Colorado,Utah and NorthwesternNew Mexicodrainsinto the lake via the Colorado,Green and San Juan Rivers. The lake currentlycontainsmore than 4.5 trilliongallonsof water and is 490 feet deep at the dam.
Subscribe to get the latest posts sent to your email.
123 Comments
Inline Feedbacks
View all comments
bikermailman
January 31, 2010 8:35 pm
For those of you who haven’t seen the Green River, it’s fantastic at both Flaming River Gorge and the confluence with the Colorado, at Canyonlands Park, both on the map.
Mike Ramsey
January 31, 2010 8:35 pm
(It has been estimated by the University of Twente in The Netherlands that the manufacture of one liter of biodiesel requires 14,000 liters of water).
Kum Dollison
January 31, 2010 8:37 pm
not to mention the large and ever increasing amount of water being used by the biofuels industry
Huh?
All them Midwestern Ethanol, and Biodiesel plants are just killing the poor ol’ Colyradoe, eh?
Kum Dollison
January 31, 2010 8:56 pm
the entire U.S. biodiesel industry used less processing water in 2008 than it takes to irrigate two Sun Belt golf courses annually. http://www.biodiesel.org/resources/PR_supporting_docs/Water%20Use%20Study%20Response.htm
Not many soybeans are irrigated, and the ones that are were irrigated before they started taking the oil out for biodiesel.
Silly statement.
biker,
I’ve canoed from Green River, UT down to the confluence twice. 120 miles of some of the finest scenery anywhere.
rbateman
January 31, 2010 9:02 pm
At 14,000 liters of water, and given Lake Powell holds 4.5 trillion liters of water, we could produce 82.5 million gallons of biodiesel, or 1.6 million barrels of biodiesel.
The input to US refineries – http://tonto.eia.doe.gov/oog/info/twip/twip_crude.html
is 13.8 million barrels / day.
Lake Powell converted to Biodiesel wouldn’t make 2 hours worth of US daily fuel.
If the 14,000 liters/biodiesel liter is correct, what a waste of water.
Mike Davis
January 31, 2010 9:04 pm
You failed to mention the “Fake” floods needed to maintain biodiversity on the lower river. Also the decision to lower the water level to avert the flooding that happened in the 80s. Remember this river dam system was designed to control flooding down river.
Steve Goddard
January 31, 2010 9:11 pm
Kum,
The vast majority of biofuels in the US are generated from corn. http://www.nap.edu/openbook.php?record_id=12039&page=10
TABLE 1-1 U.S. Production of Biofuels from Various Feedstocks in 2006
Fuel
Feedstock
U.S. Production in 2006
Ethanol
Corn
4.9 billion gallons
Sorghum
Less than 100 million gallons
Cane sugar
No production (600 million gallons imported from Brazil and Caribbean countries)
Cellulose
No production (one demonstration plant in Canada)
Biodiesel
Soybean oil
Approximately 90 million gallons
Other vegetable oils
Less than 10 million gallons
Recycled grease
Less than 10 million gallons
Cellulose
No production
SOURCE: U.S. CRS (2007).
Steve Garcia
January 31, 2010 9:42 pm
Hahahaha –
Notice that 1998 – the highest temp year in everybody’s database (at least homogenized data) – is right in the middle of a fairly long high water stretch.
I know things have lag times, but for them to jump on 2007 and cry “The sky is falling!” – doesn’t that at least allow me to point at an even hotter year and cry “Weather is not climate!” or something of the sort?
Ed Murphy
January 31, 2010 9:46 pm
Great article about Lake Powell, all you guys, now this is the kind of stuff that opens eyes and turns heads. Keep ’em coming, you’re rolling like a juggernaut heading for victory over corrupt science and politics!
A side note… Liquefied natural gas doesn’t require any water that I’m aware of and we have at least a bit over one century worth, maybe two, and… nobody has to go hungry. That’s with running our vehicles and replacing coal and oil entirely. Correct me if I’m wrong.
bikermailman
January 31, 2010 9:49 pm
Steve, I ‘discovered’ the Moab area several years ago, and just fell in love with it. Took a flightseeing tour over Canyonlands, it was my favorite, til I did the flightseeing around Mt McKinley! One of the things I love about our country, there’s some of everything, and it’s all beautiful in its own, if different, way. We also produce great minds, like the ones who both post and comment here, and a fantastic thinker at HotAir, goes by the name of DocZero. I’m glad to have sites like these where average folks like me can go for good information.
aMINO aCIDS iN mETEORITES
January 31, 2010 9:49 pm
“weather is not climate”
So they say.
So where is all the hot weather that would be the result of global warming? I haven’t seen any reports of it (unless you look at GISTemp, the product of a global warming, mad scientist).
But I keep seeing all the reports of cold.
Steve Garcia
January 31, 2010 9:59 pm
A similar recovery of a lake:
Back in late summer of 2003, I made plans to visit Guadalajara, in the state of Jalisco, in Mexico. 40 miles south of the city is Mexico’s largest lake, Lake Chapala. A friend down there emailed me and was bewailing the drying up of their lake. The water level was at 15% of normal, and it was imminently scheduled to be placed on the world list of endangered lakes.
This was the end of August, 2003. The rainy season there runs from the late part of June to about the end of September, so there was only one month to go before the dry season started – which everyone expected to dry the lake up pretty much all the way.
There were all kinds of causes brought up as to why the lake was drying up – population growth, farmer’s taking water out of the drainage basin feeding the lake, and a prolonged semi-drought. The one thing I did NOT hear being blamed for it, amazingly, was global warming. It might have been blamed by someone, but I never heard it as such…
How do I put this? You are all going to think I’m nuts, but I thought I would just put some mental energy into sending rain. The Huichole (sp?) Indians were hot on that angle, too. Coincidence or by magic, all September the rains came steadily (that rainy season up until then had been very much below average). Those rains extended past the normal ending of the rainy season, all the way through October and into early November. My friend had lived there for over 30 years and told me there had not been November rains in the city in all that time.
At the end of the rainy season, the water level was at 55% of normal. By the end of the rainy season in 2004, the water level was at 100%.
Water levels rise and water levels fall. Yes, people take water out of drainage basins and sometimes excessively – but usually we all realize what level is proper for maintaining a relatively “steady state.” Since 2004, the water level to my knowledge has been pretty normal – in spite of the population (which is still higher than before) and the farmers taking what they need.
The real variable was simply rainfall. When it returned to normal, so did the lake level.
Kum Dollison
January 31, 2010 10:02 pm
Steve, you made reference to Biodiesel. Biodiesel, in the U.S., is made from waste veg grease, or Soybeans, Not Corn.
I’m assuming that the Co corn that is irrigated is irrigated from groundwater, not snow melt water.
Steve Goddard
January 31, 2010 10:07 pm
Glen Canyon was one of the most beautiful sections of the Colorado River before it was flooded by Lake Powell. Many environmentalists have been hoping for the demise of the lake, but it looks like they will have to wait a bit longer ……
Prior to the building of Glen Canyon Dam, The Grand Canyon had warm muddy water flowing through it. Now it has cold, clear water which flows out of the bottom of the dam. This has radically changed the ecosystem – some of the largest trout in the world live in the cold water at Lee’s Ferry down below the dam.
Steve Goddard
January 31, 2010 10:28 pm
Kum,
I said “not to mention the large and ever increasing amount of water being used by the biofuels industry.”
The vast majority of irrigation water in Colorado comes from rivers. Much of the water usage in the Front Range is pumped over from the western slope. http://co.water.usgs.gov/infodata/wateruse.html
Pamela Gray
January 31, 2010 10:31 pm
Kum, in Wallowa County we have two sources of water in the ground, aquifer and ground table water. Aquifer water is what you drill for. It can be as little as 60 feet down or as much as 900 feet down. Ground water is what you find in low-lying areas if you dig through the layers of top soil and old river bottom gravel down deep enough. On the rare occasion, you will find an artesian water source. They can be caused by several different formations. One formation, that of an aquifer caught between two undulating ribbons of old lava, can loop up near the surface and bubble up to the ground if under pressure to do so. Ground water tables can be reduced by drought, and quickly. Aquifer water tends to be much more stable as it depends on centuries of water working its way to the aquifer level. Still, too many wells can cause pressure problems. What you would call a swamp, we call sub-irrigated ground. You might be able to grow timothy hay on it if you drain tile it. But alfalfa needs dryer soil with periodic irrigation, flood irrigation being the best choice.
kuhnkat
January 31, 2010 10:43 pm
Kum Dollison,
here is a quote from the link Stephen posted:
“The worst offenders included making biodiesel from rapeseed or soya (14,000 liters of water to make just one liter of biodiesel)”
You must understand that water cost is not just irrigation. Processing of the crop also incurs heavy water cost.
Corn for ethanol is 1/10 the amount at 1,400. This is still stupid!!!
You should also note that he uses the phrase “ever increasing”. We do not yet know whether our gubmint will be stupid enough to continue to push rapeseed/soya for biodiesel with current technologies!! The amount of used vegetable oil is already being fully utilised for biodiesel in a number of areas.
Kum Dollison
January 31, 2010 10:45 pm
Well, Steve, you’ve been growing corn in Colorado for a long time. Have you “always” irrigated it, or did you just start when the biofuel market came to town?
And, I guess the next “Logical” question would be do you have more corn acres than in the past, about the same, or less?
Kum Dollison
January 31, 2010 10:53 pm
I read, somewhere, that although about 15% of corn is irrigated, only about 6% of the corn that’s used for ethanol is irrigated. Most of that in Nebraska. I’m wondering how much Colorado Corn actually goes to ethanol. If there’s not a plant within 30, or so, miles I would say very little. I bet most of it goes the same place it’s always gone – to feed Colorado cattle.
BTW in 2007 we planted 91 million acres of corn and produced 13.1 Billion bushels.
in 2009 we planted 86 million acres and produced 13.2 Billion bushels. An all-time record yield of 165 bu/acre. In spite of one of the most horrendous growing seasons on record.
Kum Dollison
January 31, 2010 11:09 pm
I see a refinery in Yuma, Co in the NE corner of the state http://www.ethanolrfa.org/industry/locations/
and, Windsor Co. Also in the NNE part of the state. They’ve been irrigating, there, since the 1870’s. Used to raise sugar beets. Now they’ve got Kodak.
Kum Dollison
January 31, 2010 11:36 pm
Steve it looks to me like those refineries are in the “South Platte Basin.” The South Platte flows out of the Rockies, through Nebraska, hooks up with the N. Platte, and goes into the Missouri/Mississippi River System. http://en.wikipedia.org/wiki/South_Platte_River
The farmers there have 400 GROUNDWATER WELLS, and are in a fight over whether or not they’re taking water out of the S. Platte River.
I just can’t see how the Colorado River could enter into this at all. Why would one “Pump” water over a mountain when you’re sitting right beside a very nice river, already?
kadaka
February 1, 2010 12:04 am
This could be due to only one explanation – lots and lots of snow in the Rocky Mountains during the last five years.
I’m waiting for someone to mention it could also be from the rapidly melting glaciers.
EJ
February 1, 2010 12:16 am
I’ve been following the resevoirs in WY the last few years, and they have rebounded to near normal levels recently as well……………


For those of you who haven’t seen the Green River, it’s fantastic at both Flaming River Gorge and the confluence with the Colorado, at Canyonlands Park, both on the map.
(It has been estimated by the University of Twente in The Netherlands that the manufacture of one liter of biodiesel requires 14,000 liters of water).
not to mention the large and ever increasing amount of water being used by the biofuels industry
Huh?
All them Midwestern Ethanol, and Biodiesel plants are just killing the poor ol’ Colyradoe, eh?
the entire U.S. biodiesel industry used less processing water in 2008 than it takes to irrigate two Sun Belt golf courses annually.
http://www.biodiesel.org/resources/PR_supporting_docs/Water%20Use%20Study%20Response.htm
Not many soybeans are irrigated, and the ones that are were irrigated before they started taking the oil out for biodiesel.
Silly statement.
Kum,
Huge amounts of western water is used to irrigate corn for biofuels.
http://www.coloradocorn.com/resources/ethanol-biofuels
Sometimes research should come before sarcasm.
biker,
I’ve canoed from Green River, UT down to the confluence twice. 120 miles of some of the finest scenery anywhere.
At 14,000 liters of water, and given Lake Powell holds 4.5 trillion liters of water, we could produce 82.5 million gallons of biodiesel, or 1.6 million barrels of biodiesel.
The input to US refineries –
http://tonto.eia.doe.gov/oog/info/twip/twip_crude.html
is 13.8 million barrels / day.
Lake Powell converted to Biodiesel wouldn’t make 2 hours worth of US daily fuel.
If the 14,000 liters/biodiesel liter is correct, what a waste of water.
You failed to mention the “Fake” floods needed to maintain biodiversity on the lower river. Also the decision to lower the water level to avert the flooding that happened in the 80s. Remember this river dam system was designed to control flooding down river.
Kum,
The vast majority of biofuels in the US are generated from corn.
http://www.nap.edu/openbook.php?record_id=12039&page=10
TABLE 1-1 U.S. Production of Biofuels from Various Feedstocks in 2006
Fuel
Feedstock
U.S. Production in 2006
Ethanol
Corn
4.9 billion gallons
Sorghum
Less than 100 million gallons
Cane sugar
No production (600 million gallons imported from Brazil and Caribbean countries)
Cellulose
No production (one demonstration plant in Canada)
Biodiesel
Soybean oil
Approximately 90 million gallons
Other vegetable oils
Less than 10 million gallons
Recycled grease
Less than 10 million gallons
Cellulose
No production
SOURCE: U.S. CRS (2007).
Hahahaha –
Notice that 1998 – the highest temp year in everybody’s database (at least homogenized data) – is right in the middle of a fairly long high water stretch.
I know things have lag times, but for them to jump on 2007 and cry “The sky is falling!” – doesn’t that at least allow me to point at an even hotter year and cry “Weather is not climate!” or something of the sort?
Great article about Lake Powell, all you guys, now this is the kind of stuff that opens eyes and turns heads. Keep ’em coming, you’re rolling like a juggernaut heading for victory over corrupt science and politics!
A side note… Liquefied natural gas doesn’t require any water that I’m aware of and we have at least a bit over one century worth, maybe two, and… nobody has to go hungry. That’s with running our vehicles and replacing coal and oil entirely. Correct me if I’m wrong.
Steve, I ‘discovered’ the Moab area several years ago, and just fell in love with it. Took a flightseeing tour over Canyonlands, it was my favorite, til I did the flightseeing around Mt McKinley! One of the things I love about our country, there’s some of everything, and it’s all beautiful in its own, if different, way. We also produce great minds, like the ones who both post and comment here, and a fantastic thinker at HotAir, goes by the name of DocZero. I’m glad to have sites like these where average folks like me can go for good information.
“weather is not climate”
So they say.
So where is all the hot weather that would be the result of global warming? I haven’t seen any reports of it (unless you look at GISTemp, the product of a global warming, mad scientist).
But I keep seeing all the reports of cold.
A similar recovery of a lake:
Back in late summer of 2003, I made plans to visit Guadalajara, in the state of Jalisco, in Mexico. 40 miles south of the city is Mexico’s largest lake, Lake Chapala. A friend down there emailed me and was bewailing the drying up of their lake. The water level was at 15% of normal, and it was imminently scheduled to be placed on the world list of endangered lakes.
This was the end of August, 2003. The rainy season there runs from the late part of June to about the end of September, so there was only one month to go before the dry season started – which everyone expected to dry the lake up pretty much all the way.
There were all kinds of causes brought up as to why the lake was drying up – population growth, farmer’s taking water out of the drainage basin feeding the lake, and a prolonged semi-drought. The one thing I did NOT hear being blamed for it, amazingly, was global warming. It might have been blamed by someone, but I never heard it as such…
How do I put this? You are all going to think I’m nuts, but I thought I would just put some mental energy into sending rain. The Huichole (sp?) Indians were hot on that angle, too. Coincidence or by magic, all September the rains came steadily (that rainy season up until then had been very much below average). Those rains extended past the normal ending of the rainy season, all the way through October and into early November. My friend had lived there for over 30 years and told me there had not been November rains in the city in all that time.
At the end of the rainy season, the water level was at 55% of normal. By the end of the rainy season in 2004, the water level was at 100%.
Water levels rise and water levels fall. Yes, people take water out of drainage basins and sometimes excessively – but usually we all realize what level is proper for maintaining a relatively “steady state.” Since 2004, the water level to my knowledge has been pretty normal – in spite of the population (which is still higher than before) and the farmers taking what they need.
The real variable was simply rainfall. When it returned to normal, so did the lake level.
Steve, you made reference to Biodiesel. Biodiesel, in the U.S., is made from waste veg grease, or Soybeans, Not Corn.
I’m assuming that the Co corn that is irrigated is irrigated from groundwater, not snow melt water.
Glen Canyon was one of the most beautiful sections of the Colorado River before it was flooded by Lake Powell. Many environmentalists have been hoping for the demise of the lake, but it looks like they will have to wait a bit longer ……
Prior to the building of Glen Canyon Dam, The Grand Canyon had warm muddy water flowing through it. Now it has cold, clear water which flows out of the bottom of the dam. This has radically changed the ecosystem – some of the largest trout in the world live in the cold water at Lee’s Ferry down below the dam.
Kum,
I said “not to mention the large and ever increasing amount of water being used by the biofuels industry.”
The vast majority of irrigation water in Colorado comes from rivers. Much of the water usage in the Front Range is pumped over from the western slope.
http://co.water.usgs.gov/infodata/wateruse.html
Kum, in Wallowa County we have two sources of water in the ground, aquifer and ground table water. Aquifer water is what you drill for. It can be as little as 60 feet down or as much as 900 feet down. Ground water is what you find in low-lying areas if you dig through the layers of top soil and old river bottom gravel down deep enough. On the rare occasion, you will find an artesian water source. They can be caused by several different formations. One formation, that of an aquifer caught between two undulating ribbons of old lava, can loop up near the surface and bubble up to the ground if under pressure to do so. Ground water tables can be reduced by drought, and quickly. Aquifer water tends to be much more stable as it depends on centuries of water working its way to the aquifer level. Still, too many wells can cause pressure problems. What you would call a swamp, we call sub-irrigated ground. You might be able to grow timothy hay on it if you drain tile it. But alfalfa needs dryer soil with periodic irrigation, flood irrigation being the best choice.
Kum Dollison,
here is a quote from the link Stephen posted:
“The worst offenders included making biodiesel from rapeseed or soya (14,000 liters of water to make just one liter of biodiesel)”
You must understand that water cost is not just irrigation. Processing of the crop also incurs heavy water cost.
Corn for ethanol is 1/10 the amount at 1,400. This is still stupid!!!
You should also note that he uses the phrase “ever increasing”. We do not yet know whether our gubmint will be stupid enough to continue to push rapeseed/soya for biodiesel with current technologies!! The amount of used vegetable oil is already being fully utilised for biodiesel in a number of areas.
Well, Steve, you’ve been growing corn in Colorado for a long time. Have you “always” irrigated it, or did you just start when the biofuel market came to town?
And, I guess the next “Logical” question would be do you have more corn acres than in the past, about the same, or less?
I read, somewhere, that although about 15% of corn is irrigated, only about 6% of the corn that’s used for ethanol is irrigated. Most of that in Nebraska. I’m wondering how much Colorado Corn actually goes to ethanol. If there’s not a plant within 30, or so, miles I would say very little. I bet most of it goes the same place it’s always gone – to feed Colorado cattle.
BTW in 2007 we planted 91 million acres of corn and produced 13.1 Billion bushels.
in 2009 we planted 86 million acres and produced 13.2 Billion bushels. An all-time record yield of 165 bu/acre. In spite of one of the most horrendous growing seasons on record.
I see a refinery in Yuma, Co in the NE corner of the state
http://www.ethanolrfa.org/industry/locations/
and, Windsor Co. Also in the NNE part of the state. They’ve been irrigating, there, since the 1870’s. Used to raise sugar beets. Now they’ve got Kodak.
Steve it looks to me like those refineries are in the “South Platte Basin.” The South Platte flows out of the Rockies, through Nebraska, hooks up with the N. Platte, and goes into the Missouri/Mississippi River System.
http://en.wikipedia.org/wiki/South_Platte_River
The farmers there have 400 GROUNDWATER WELLS, and are in a fight over whether or not they’re taking water out of the S. Platte River.
I just can’t see how the Colorado River could enter into this at all. Why would one “Pump” water over a mountain when you’re sitting right beside a very nice river, already?
This could be due to only one explanation – lots and lots of snow in the Rocky Mountains during the last five years.
I’m waiting for someone to mention it could also be from the rapidly melting glaciers.
I’ve been following the resevoirs in WY the last few years, and they have rebounded to near normal levels recently as well……………