UPDATE: Easy come, easy go, the sharp decline has popped back up to near normal in the space of a couple days. See the end of the story for update.
According to the Danish Meteorological Institute, Arctic temperatures are currently below 238K (-35.15 degrees Celsius or -31.27 degrees Fahrenheit)
That is more than five degrees below normal (the green line) and the lowest reading since 2004. The slope of decline has also recently been quite sharp, dropping from 252K on January 1, a drop of 14 degrees in 22 days.

Source: http://ocean.dmi.dk/arctic/plots/meanTarchive/meanT_2010.png
For an interactive view, showing historical data see:
http://ocean.dmi.dk/arctic/meant80n.uk.php
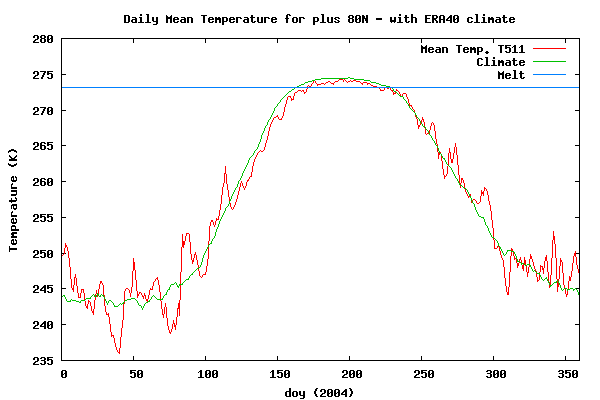
The last time temperatures were this low in the Arctic was in February, 2004, where the 80N temperature reached 236K.

Source: http://ocean.dmi.dk/arctic/plots/meanTarchive/meanT_2004.png
In other news, temperatures in both the Arctic and Antarctic are well below normal.

Source: http://www.esrl.noaa.gov/psd/map/ANIM/sfctmpmer_01a.fnl.30.gif
h/t to Steve Goddard
UPDATE: Quick rebound from the coldest temperature since 2004, will it oscillate back?

This is more fuel for miserable weather through the U.S. midsection in coming weeks. Maybe South Florida again as well.
By the way, if you look at the data for years like 1961 or 1963 you will see very cold arctic temperatures below 230K, and the wild jumping back and forth that the Arctic seems to do each winter. Wind in one sector brings in “warm” air from the south at the same time cold air is flowing south in some other sector. Then the Arctic goes calm as AnnaV says, and radiation takes over.
I haven’t found out why 2009 ended at roughly 245 K and the next day 2010 began at about 252 K.
Seven degrees is possible but it is quite a jump for one day. Did they recalibrate at that time?
I believe Nick asked this question a week ago and got no answer.
See Nick Stokes at 4:47:12 for a link to the 2009 graph. Or go here
http://ocean.dmi.dk/arctic/plots/meanTarchive/meanT_2009.png
It doesn’t look too warm in northern China at the moment, either, according to TVNZ.
http://tvnz.co.nz/world-news/sea-ice-pack-grows-in-north-china-3340398
Steve Goddard (08:30:49) :
All of the Arctic above 80N is already saturated with ice. Cold temperatures there won’t change the sea ice extent.
However, it should increase the thickness, and as we’ve been told lately that is the most important metric. Or, at least it will be until the extent drops down again.
Does anyone else think the Siberian hot spot is a little odd. It is bracketed by colder than normal temps on the north and south. Where did the heat come from?
We had a disconnect between the tropics and the poles.
The jetstreams in the N hemisphere moved south and stopped waving, preventing tropical air from being drawn up into the higher latitudes. This caused cool weather in northern latitudes (all that snow), and no doubt allowed the poles to cool off even more than usual.
Future trends?
We have had a few low pressures sneak northwards, bringing some warmer weather northwards, but not as many as usual, nor as active. So my estimate is that the N Pole will continue cooling, but not as fast as previously.
.
This should result in ice being much thicker this spring than in recent years. It will be an interesting September.
Walter Dnes
” If the colder air floods south and freezes Chicago and all the way down to Florida, plus Europe and China, then warmer air moves into the polar regions.”
But that didn’t stop the environment correspondents here in the UK, notably the Guardian and the BBC, emphasising that the Arctic was warmer than usual in any piece they did on the cold spell in the UK and Europe. Keeping the meme going about Arctic warming is always more important than describing what is happening weather wise.
I have watched this graph closely over the last few years. I regularly compared this data to the values here:
http://www.athropolis.com/map2.htm
and I’ve become convinced that there is a high amount of random, unbiased fluctuation/error in the DMI plot. Some of the jumps are downright stunning.
I realize that the Alert location is the only one in the athropolis map that’s north of 80 degrees but the temp for Alert doesn’t fluctuate wildly. In fact it fluctuates less than, say, Murmansk or Resolute. I would expect the wide area average in the DMI plot to fluctuate even less, yet it seems to fluctuate more.
Lots of raw data is smoothed because of measurement limitations and this data is obviously unsmoothed and should be viewed as such. I’m not saying the data is wrong but I am saying that significant smoothing would be appropriate to reduce the noise.
Thus, this minimum becomes a lot more interesting if it hangs on for a few more days.
That said, I would just love to see data on how cloudy it’s been north of 80 degrees. This time of year, a clear sky would reduce temp. The athropolis data includes wind and clouds but it’s not enough locations.
Recharging the Polar Express for another plunge.
Assuming that an Arctic High is parked over Greenland & Siberia..
Also notice the cold anomaly over the South Pole in it’s summertime, consistent with the shortened melt season we had in the Arctic last summer.
Can you say “Leapfrog”?
crosspatch (13:09:08) :
This should result in ice being much thicker this spring than in recent years. It will be an interesting September.
It will increase the thickness of the ice. However, if you have ever examined what is known as the “Stefan Problem” you’d see that the increase is with the square-root of time and so the thickening slows and slows, and…
I won’t be surprised to see not all that great a thickness increase by spring, let alone September.
GISS will have the Arctic anomaly a new color I like to call ‘climate red’. I mean, the ice is melting for God’s sake! Haven’t you seen the huge spike in the summer temperatures to support this theory?! No? I’ll show it to you:
/
/
/
/
/
/
/
/
I didn’t even make it up or anything.
Darn. My sarcastic graph unformatted. Oh well. Still, I don’t really see much of a difference in the summer temps up in the Arcitc year to year.
Summer temperatures in the high Arctic are controlled by the freezing point of water. It is impossible to get temperatures much above freezing over a large body of ice, because the melting of ice absorbs a lot of heat. If the North Pole was ice free as Mark Sereeze predicted for 2008, or the Arctic was ice free as another “expert” predicted for 2008, then Arctic temperatures could have gotten much higher.
photon without a Higgs (11:49:03) :
this should mean thicker ice that will melt a bit slower in the summer
Only if it lasts for a while, it has about 100days of 5º above average to take care of.
I read through all the comments now, and having not seen it, I must ask. Are these rotten Kelvins?
All of this emphasizes the stupidity of trying to attribute a “global temperature” to the Earth’s climate system, ignoring humidity and elevation issues, and the fact that the oceans have almost 1200 times the heat capacity of the atmosphere. It’s like astrology. Small wonder that UEA staff played little games with their dendroclimatology studies. If you’re selling horoscopes, what does it matter?
Dave Andrews (13:13:52) :
They just don’t get it, plain and simple. If you take the Polar Air and blow it down on the temperate zones all winter, it makes for one heck of a climate change. Who cares if the Arctic is above normal in the winter, where nothing can melt and nobody live there, but we sure as heck do care that things are well below normal in the Northern Temperate zone where billions of people live.
Good, let it stay up there. Vancouver can use straw and fake snow. If this bit of a cold snap next week is the last of the Arctic blasts for the year, that would suit me fine. The snow we are going to get before April will be quite enough for us on the Northern Plains.
It will be interesting to see what the ice minimum is with the brutish stuff magnified up there this winter instead of getting pushed South … yet :~/
The AGW skeptic crowd nailed the AO blocking over Christmas. What are they saying for the rest of the winter?
MrCannuckistan (08:47:46) :
It was good to see Lubos mulling over the release of latent heat that may be involved in the formation of above-normal snow cover.
It seems to be a calculation ignored by Alarmists, when they note a temperature rise.
Hansen actually did mention latent energy once, but it was while trying to explain why temperatures were NOT going up. He stated a lot of actual heat might be turned into latent heat, as ice caps melted.
However the knife cuts both ways.
Phil. (10:02:17) :
When you state, “But even ignoring that, the latent heat warming will be confined to the NH over the period of a month…” I find myself thinking that only a month ago the UAH figures were below +.3, and now they’ve zoomed up towards +.7.
It’s quite a jump in “only a month,” and begs us to think of possible causes. There are probably a combination of causes, but latent heat is worth considering.
Also consider the fact the southern hemisphere is largely ocean, and therefore can’t build up the same sort of snow-cover as the northern hemisphere.
Perhaps this explains why there is usually a rise in world temperatures during the northern winter. (I used to think it was simply because that is when the earth is closest to the sun, but the current jump in temperatures seems too large to be covered by that explaination.)
I’m curious. Do you have any ideas of your own about what may have caused the spike in temperatures?
Caleb (17:51:40) , the UAH anomaly last month was .28C. When you look at the daily numbers the difference value at the bottom of the chart is .52 F.
While I think the anomaly will increase in January it isn’t going to be near .7C.
KTWO (12:01:21) :
I haven’t found out why 2009 ended at roughly 245 K and the next day 2010 began at about 252 K.
Seven degrees is possible but it is quite a jump for one day. Did they recalibrate at that time?
I commented on this a ways back. DMI, for some reason, only has data through the 360th day of the year shown on the graph. They told me when I queried them about it 6 weeks ago that they were working on fleshing out each year in the record. I may ask again soon.
Anthony,
On January 21st I blowed the whistle about the Danish Center temperature graphs in Climate Sceptics debate list, and I guess Warwick and Lubos (members of CS) took my advice to check the graphs and made they excellent job.
So I make my own h/t to myself about this matter 😉
If you look at the arctic temperatures from 2005-09 you will note that most of the non-summer months are tending to above the long term average, yet the summer months are slightly below the long term averages.