UPDATE: Easy come, easy go, the sharp decline has popped back up to near normal in the space of a couple days. See the end of the story for update.
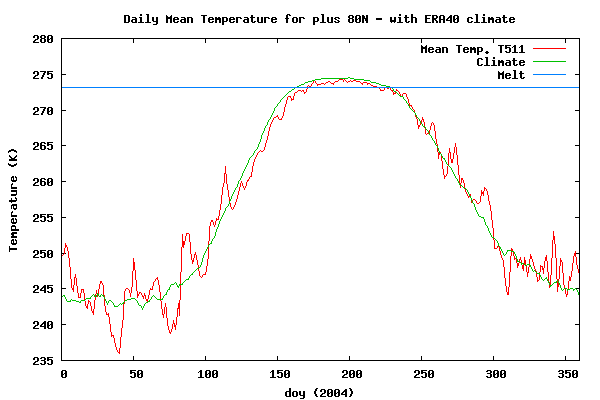
According to the Danish Meteorological Institute, Arctic temperatures are currently below 238K (-35.15 degrees Celsius or -31.27 degrees Fahrenheit)
That is more than five degrees below normal (the green line) and the lowest reading since 2004. The slope of decline has also recently been quite sharp, dropping from 252K on January 1, a drop of 14 degrees in 22 days.

Source: http://ocean.dmi.dk/arctic/plots/meanTarchive/meanT_2010.png
For an interactive view, showing historical data see:
http://ocean.dmi.dk/arctic/meant80n.uk.php
The last time temperatures were this low in the Arctic was in February, 2004, where the 80N temperature reached 236K.

Source: http://ocean.dmi.dk/arctic/plots/meanTarchive/meanT_2004.png
In other news, temperatures in both the Arctic and Antarctic are well below normal.

Source: http://www.esrl.noaa.gov/psd/map/ANIM/sfctmpmer_01a.fnl.30.gif
h/t to Steve Goddard
UPDATE: Quick rebound from the coldest temperature since 2004, will it oscillate back?

Al Gore notices the orange in the middle of Greenland and immediately seizes on it for a new film with Michael Moore on how the ocean levels will increase 2,000 feet due to the melting of Greenland.
The arctic was overly warm with the AO in December and now has swung the other way, then threads were posted on how cold Europe was, now it is how cold the Arctic is since Europe is more normal again.
Stop cherry picking!
Andy
The El Nino is fading a bit and the sun was recently a little more active so the Arctic Oscillation became a little less negative for a while and allowed a slight movement poleward in the jets.
That results in a tighter air flow around the poles and a cooling of the poles with less breakouts of cold air equatorward.
As I said before a quiet sun reduces the rate of energy loss to space from the stratosphere whilst ENSO controls the rate of energy transfer from surface to stratosphere. The combined effect dictates the state of the Arctic Oscillation. The AO is biased towards negative when the sun is inactive because instead of energy escaping to space it tends to be redirected back downward through intensification of the Arctic high pressure cells which then move equatorward.
A negative AO pushes the jets equatorward whilst a positive ENSO pushes them poleward. All subject to a degree of short term chaotic variability.
So the situation remains for a continued slow overall cooling of the troposphere with, for the moment, strongly cooling poles and a continuing cooling of the northern continental interiors during the current winter season.
So, looking forward, the continued cooling of the northern continents may soon be supplemented by further breakouts of cold air from the Arctic region but at this point I cannot predict the direction of breakout. It could be across China, N. America or Europe or a mixture depending on future synoptics.
I look at the DMI arctic temp chart and the AMRS-E chart every day out of habit – as a curious amatuer. In the past several days the DMI chart went 5K below mean and I was curious to see the reaction on the AMRS-E chart. Behold… cold temperatures cause a decrease in artic ice extent. Sure there are other factors at play but it seems odd to me.
Old saying: Once bitten, twice shy. So much of the temperature record everywhere seems to be in doubt, especially with the closing down of so many ground weather stations, that I am gun shy of any purported temperature data. And so, I wonder about the data provided by the Danish Meteorological Institute. “tfp” provided an overview of the process used to produce the numbers and graph at (04:11:58) :
“The daily mean temperature of the Arctic area north of the 80th northern parallel is estimated from the average of the 00z and 12z analysis for all model grid points inside that area. The ERA40 reanalysis data set from ECMWF, has been applied to calculate daily mean temperatures for the period from 1958 to 2002, from 2002 to 2006 data from the global NWP model T511 is used and from 2006 to present the T799 model data are used.”
This doesn’t say how many thermometer sites (satellite data??) were used, so I have to question if the calculations are similar to the “fill-in-the-box” method criticized for the Steig warming “revelations” from Antarctica. I do not believe in the AGW story, but I want to be on solid ground when I argue any other point of view. Can anyone certify that the Danish calculations are valid? (I want to believe them!!)
IanM
ShrNfr (06:47:07) :
Al Gore notices the orange in the middle of Greenland and immediately seizes on it for a new film with Michael Moore on how the ocean levels will increase 2,000 feet due to the melting of Greenland.
2,000 feet? Do you have a reference where that number comes from?
“SlylyForward (08:12:32) :
ShrNfr (06:47:07) :
Al Gore notices the orange in the middle of Greenland and immediately seizes on it for a new film with Michael Moore on how the ocean levels will increase 2,000 feet due to the melting of Greenland.
2,000 feet? Do you have a reference where that number comes from?”
From the documentary “2012” by Dr. Emmerich.
S Thompson,
All of the Arctic above 80N is already saturated with ice. Cold temperatures there won’t change the sea ice extent.
anna v (04:50:25) :
Ice is supposed to have the black body constant. Where it is the long night plus ice, the globe is radiating and no watts/metersquare are coming in at all.
Actually there’ll be long wave coming in, probably around 100+ W/m^2.
How much is that? At 252K 225watts/met^2 are radiated from the ice to space, at 238K 182watts/m^2. No radiation is coming in, the only efficient way the temperature can go up in the long night is by convection.
Since most of the time there is a surface temperature inversion convection isn’t likely, more likely advection.
For those of you wondering about the UAH January 2010 anomaly, there is a post bye Luboš Motl over at The Reference Frame that talks about the latent heat of snow.
http://motls.blogspot.com/2010/01/warming-induced-by-latent-heat-of-snow.html?
Interesting read.
MrC
It’s amusing and rather predictable that ~100 days of ~5º above the average excites no comment on this board but a couple of days below gets a headline.
Juraj V. (03:34:22) :
Interesting that ice cover extent slowed down despite the cold. Probably the ice is being compacted by winds. This generates thick ice and open water, exposed to severe cold, will freeze very quickly as soon as winds stop. We are on a good way to see summer minimum above 2007, 2008 and 2009.
So you think that a few cold days will reverse the effects of the last 100 days? With the continued drift out of the Fram I’d be very surprised to see a minimum that high.
AndyW,
Obviously you are not in Europe. Temperatures are running near record cold.
http://wxmaps.org/pix/temp4.html
Phil,
The coldest temperature in six years what this article is about, not “a few days below normal.”
By the way, UAH are probably guessing the temperatures above 82 degrees North by interpolating the temperatures around that region, so they’re likely not seeing the recent cooling in the extreme Arctic.
The disk around the North pole up to 80 degrees North is 0.75% of the surface of the Earth, so if the Danish far Arctic temperatures were added into a weighted average, those 14 degrees in 3 weeks would subtract about 0.1 deg Celsius from the global average. See more comments
http://motls.blogspot.com/2010/01/extreme-arctic-cooled-quickly-reduces.html
MrCannuckistan (08:47:46) :
For those of you wondering about the UAH January 2010 anomaly, there is a post bye Luboš Motl over at The Reference Frame that talks about the latent heat of snow.
Interesting read.
The usual Motl stuff, ‘a little knowledge is a dangerous thing’ with him. He forgets that there’s another hemisphere where ~2million square km of ice melted in the same time. But even ignoring that, the latent heat warming will be confined to the NH over the period of a month so when we look at the monthly data from UAH we’ll be able to see if he’s right and there is a huge increase in the NH ExtraTropical contribution.
Does warmer air in the arctic result in heat being lost from the total global energy budget?
P Gosselin (02:36:21) :
Seems like the cold we had in the middle lattitudes has retreated back to Arctic.
US, Siberia and southern Canada aren’t as cold as they were a couple a weeks ago.
This moderation of temperature in Southern Canada at this time is completely normal. We have a well defined period of “January thaw” that varies some with degree and timing but remains consistent. If there has been a sufficiently cold enough period to begin significant freeze over of portions of the lower Great Lakes (variable in extent from year to year), then we lose lake-effect snows, and tend toward drier, clear nights. This usually heralds a run of deep dry cold through February, which breaks with the arrival of the spring sun and associated seasonal weather.
*******
Caleb (04:55:21) :
I’m interested in the up-spike of the UAH world-wide temps. How much of the very cold air is “missed,” as it is “underneath” the part of the lower troposphere the satellite measures?
*******
I’m pretty sure sat measurements do indeed miss temp anomalies on the ground, especially at higher latitudes where shallow, cold temp inversions are common during the long nights. Perhaps Dr Spencer could chime in.
Looking at noise in the red data vs the green average, the current temperature looks like two sigma from the mean. Assuming the max for the year is coming up, it looks like a one-in-twenty-year event (i.e., two sigma).
Not spectacularly scary.
REPLY: It was never portrayed as scary, just interesting – A
Phil doth quote:
Actually there’ll be long wave coming in, probably around 100+ W/m^2.
Can you help me understand from where? At 80N the inclination of the Sun is nasty. You would be lucky to get 10% of the solar constant of 1365 w/m2 and then divide by 2 because the sun takes nights off, less another 30% for that albedo thing…leaves about 50 watts? Water vapor almost absent due to cold and we know about the hole in the ozone layer, so greenhouse effects from those two also way down, radiance from ice just leaking out lickety split. ERBE data shows earth losing about 120 watts/m2 or so at in the arctic
so Ana’s 180 – 50 = about right?
The other area to watch during 2010 is what happens to crops in North Asia. Ithas been like this since mid Decemebr. Daily Average temperatures were running 20-25 Below Normal . Normals run -5-10C tHIS COLD IS
http://www.findlocalweather.com/weather_maps/temperature_north_asia.html
So Phil, 14.25% of Antartica has melted? Or was the southern ocean? or was it ?
h/t to Steve Goddard
Thanks Steven Goddard.
Luboš Motl (10:02:06) :
By the way, UAH are probably guessing the temperatures above 82 degrees North by interpolating the temperatures around that region, so they’re likely not seeing the recent cooling in the extreme Arctic.
Presumably, if UAH missed the recent cooling, they also missed the much warmer arctic temperatures over the past 5 or 6 years. Perhaps that explains why there has been no ‘cooling’ in the GISS record since 2003.
this should mean thicker ice that will melt a bit slower in the summer