Foreword: Don J. Easterbrook sent me this essay on Friday for publication here, but with the dustup over Monckton’s paper and the APS, I decided to hold off publishing it for a bit. For background, see Easterbrook’s web page here. – Anthony
Shifting of the Pacific Decadal Oscillation from its warm mode to cool mode assures global cooling for the next three decades.
Don J. Easterbrook, Dept. of Geology, Western Washington University, Bellingham, WA
Addressing the Washington Policymakers in Seattle, WA, Dr. Don Easterbrook said that shifting of the Pacific Decadal Oscillation (PDO) from its warm mode to its cool mode virtually assures global cooling for the next 25-30 years and means that the global warming of the past 30 years is over. The announcement by NASA that the (PDO) had shifted from its warm mode to its cool mode (Fig. 1) is right on schedule as predicted by past climate and PDO changes (Easterbrook, 2001, 2006, 2007) and is not an oddity superimposed upon and masking the predicted severe warming by the IPCC. This has significant implications for the future and indicates that the IPCC climate models were wrong in their prediction of global temperatures soaring 1°F per decade for the rest of the century.

Figure 1. Cooling of the Pacific Ocean and setting up of the cool-mode PDO. Sea surface temperature anomaly in the Pacific Ocean from April 14-21, 2008. The anomaly compares the recent temperatures measured by the Advanced Microwave Scanning Radiometer for EOS (AMSR-E) on NASA’s Aqua satellite with an average of data collected by the NOAA Pathfinder satellites from 1985-1997. Places where the Pacific was cooler than normal are blue, places where temperatures were average are white, and places where the ocean was warmer than normal are red. The cool water anomaly in the center of the image shows the lingering effect of the year-old La Niña. However, the much broader area of cooler-than-average water off the coast of North America from Alaska (top center) to the equator is a classic feature of the cool phase of the Pacific Decadal Oscillation (PDO). The cool waters wrap in a horseshoe shape around a core of warmer-than-average water. (In the warm phase, the pattern is reversed). Unlike El Niño and La Niña, which may occur every 3 to 7 years and last from 6 to 18 months, the PDO can remain in the same phase for 20 to 30 years. (NASA image by Jesse Allen, AMSR-E data processed and provided by Chelle Gentemann and Frank Wentz, Remote Sensing Systems. Caption by Rebecca Lindsey, adapted from a press release from NASA JPL).
Instead of a rise of 1°F during the first decade of this century as predicted by IPCC climate models (Fig 2), global temperatures cooled slightly for the past nine years and cooled more than 1°F this year (Fig 3). Global cooling over the past decade appears to be due to a global cooling trend set up by the PDO cool mode and a similar shift in the Atlantic. The IPCC’s prediction of a 1° F warming by 2011, will require warming of about 1° F in the next three years and unless that happens, the IPCC models will be proven invalid.
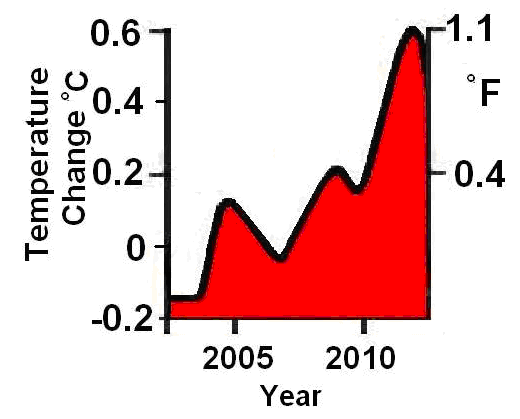
Figure 2. IPCC predicted warming.
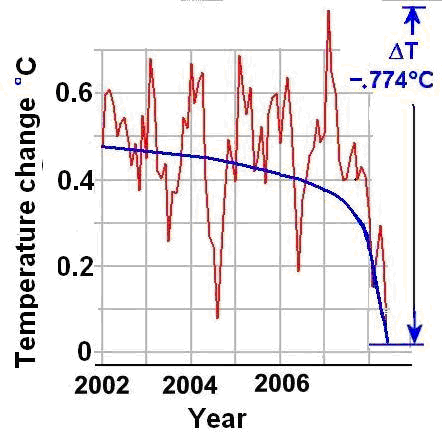
Figure 3. Measured cooling.
As shown by the historic pattern of PDOs over the past century (Fig. 4) and by corresponding global warming and cooling, the pattern is part of ongoing warm/cool cycles that last 25-30 years. Each time the PDO mode has shifted from warm to cool or cool to warm, the global climate has changed accordingly. In 1977, the PDO shifted from cool mode to warm mode (Fig. 4) and set off the global warming from 1977 to 1998, often referred to as the “Great Climate Shift.” The recent shift from PDO warm mode to cool mode is similar to the shift that occurred in the mid-1940’s and resulted in 30 years of global cooling (Fig. 4). The global warming from ~1915 to ~1945 was also brought on by a mode shift in the PDO (Fig. 4). Every indication points continuation of the PDO patterns of the past century and global cooling for the next 30 years (Fig. 4). Thus, the global warming the Earth has experienced since 1977 appears to be over!
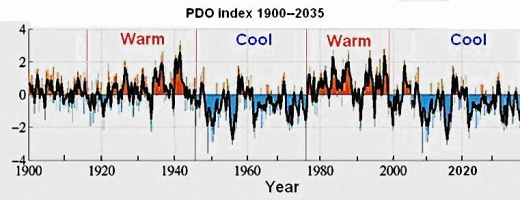
Figure 4. PDO indices, 1900-2008 with predictions to 2040.
The bucket adjustment is another data correction to fix “inconvenient data”. We look under every stone to find problems with the data, when it doesn’t conform. The data that happens to agree with our theory is assumed pure as the driven snow, and is to be defended at all costs.
no doubt this has been caused by me, according to gore global cooling is caused by global warming. in the meantime i live in a 3 room apt., drive a honda, utility bill of about $60.00 per month,and recycle. gore lives in a 20 room mansion, travels in a private jet, drives a suv, and his house uses more energy then 20 other average sized homes. i will do no more until the leaders of the green movement show me a better example.
Tallbloke: One of the first steps in calculating the PDO is to subtract the global SST from each North Pacific 5-degree by 5-degree grid cell, north of 20N. If the bucket adjustment effects North Pacific and global SST by the same amount, the arithmetic difference would be the same.
Jack Koenig: You can hold off. Don’t anger your wife over it. I’ve done some preliminary investigations and I’m finding there’s too much noise in localized land surface temperature data to draw anything of value from it for a comparison to SST; probably why they use climate models.
Example: The AMO is supposed to have a significant influence on European temperature. But here’s a graph of GHCN land surface temperature data for Europe versus global. There’s no way I’m going to be able to extract anything from that data that even remotely resembles the AMO.
http://i38.tinypic.com/k318gl.jpg
The approx 11-year cycle in the European LST is interesting, though. It doesn’t match up perfectly with the solar cycle over the 100+ years, but it’s been really close in recent years.
I think I’ll start plugging away at the LST and see what sort of recognizable SST curves start popping up.
Thanks anyway.
Regards
Roger Pielke sites new research which points recent warming to Oceans!
http://climatesci.org/2008/07/21/oceanic-influences-on-recent-continental-warming-an-important-new-research-paper-compo-and-sardeshmukh-2008/
Sorry for the typo Glenn. I was doing 3 things at once and managed to do them all, but none of them very well.
My point was the extrapolation of a trend into the future. If we had temperature data for the past 1000 years that was within a known error range, I would be willing to bet, there have been many periods with the same type of warming, as we have seen recently.
Sacrificing economic efficiency on the alter of AGW, makes the same amount of sense as sacrificing a virgin, in order to apease the Gods. Both actions come from the same fear. Lack of control over the weather, and a determination to “do something about it”.
Bob Tisdale (03:01:14) wrote: “Jack Koenig: You can hold off. Don’t anger your wife over it. I’ve done some preliminary investigations and I’m finding there’s too much noise in localized land surface temperature data to draw anything of value from it for a comparison to SST; probably why they use climate models.
Your call. However now that you got my motor running, I may start digging anyhow… but not as fast as originally thought. Regardless, should anything of any import pop up, I’ll let you know. Should you wish, you can safely send your email address to tisdale@climatestudies.com and I’ll forward anything that looks interesting.
Jack Koenig, Editor
The Mysterious Climate project
http://www.climateclinic.com
So, is the PDO an artiface of mistaken SST bathy measurements? Or is it just a statistical fantasy with no relation to the real world? As I stated in an ealier post, the last ENSO cycle differed from previous cycles in that the La Nina was much stronger than was expected, and many scientists expected the opposite; Hadley expected a continuation of the 2006 El Nino. The 2000 La Nina was stronger, but it came in the aftermath of a Super El Nino.
The next 4-6 years will likely clear things up one way or another.
Evan: FYI, the linear trend from 1998 to 2008 appears to be one of mild warming, e.g.
But that’s HadCRUT. Based on GHCN. (And which version? Land surface or Land-Ocean?)
I don’t buy surface readings. I require UAH or RSS. The whole story, evenly covered and weighted. (And no BBQs in orbit, so far as I know.)
Look what happens if we move the analysis window back 2 years, we get a (comparatively) strong warming trend.
I don’t think anyone disputes a warming trend from 1970 to 1998.
1979-1998 (whatever the significance of that window is) is a longer window over the data than 1998-2008, and much longer than 2002-2008 that is being discussed here.
It’s a significant window because it’s from a low point to a high point. And 1998 – 2008 is the other way around. Yes, it’s shorter. (But it’s getting longer!) If one wants to observe trends, one needs to break it up into low-high, high-low points if one wants to understand what is going on.
Evan, you too are missing the point, a very short term trend (which are inherently unreliable) is being used to claim global cooling, when that trend is only cooling (pretty much whatever source of data you choose) if you include the last 18 months of data. Such downward short term trends have happened before and there was no 30 years of short term cooling.
As John Christy says: “Here is my perspective on this issue: Twelve months of data does not make a trend, especially in a system as complex and slow moving as global climate, and even more so when the cause for that short-term cooling is as reasonably well understood and well documented as a switch from a minor El Nino Pacific Ocean warming in January 2007 to the La Nina cooling event now taking place.”
read the rest of it here
If you want to look at trends, the very last thing you should do is break it up into low-high and high-low points as you are then making your analysis strongly dependent on the short term variation, the very thing you want to ignore in looking for a long term trend. Instead look at a plot of the running mean, which doesn’t suffer that problem.
There are plenty of complaints of the AGW camp making such errors, why should the sceptic camp weaken their credibility by repeating them?
“that short-term cooling is as reasonably well understood and well documented as a switch from a minor El Nino Pacific Ocean warming in January 2007 to the La Nina cooling event now taking place”
Uh, not quite so. The ‘unprecedented warming’ of the last century was substantially the 1977 to 2007 positive PDO phase producing El Ninos 60% of the time. We may now reasonably expect La Ninas 60% of the suceeding 30 years.
What do you suppose will be the result interms of Global Temperature? Back to square one baby, you’re bankrupt!
Gary: Well, can you give me evidence to suggest that you are better qualified to comment than Prof. Christy? The rather childish tone of your post “back to square one baby, you’re bankrupt” suggests not.
Don Easterbrook,
I saw your post over at BadAstronomy an Phil’s reply:
I replied to another posting but I made an allusion to Phil’s answer. This apparently has gotten me banned. There have been two updates to the blog page since I submitted it. I tried to resubmit it and was told “You already said that”. What I said was:
That’s a shame. I used to enjoy reading the posts at BA but anymore Phil has turned to ranting and name calling. If an innocuous posting asking for limits and evidence is too much for him to handle, then he’s no more science-related than RC.
What I like about this blog is the laid back stance taken by Anthony and most of the posters. It used to be that way at BA. I hope WUWT never changes.
Seems I owe Phil an apology. My post eventually made it through. Maybe it got stuck in the ether? I spent more than a few hours at airports yesterday. My post seems to have finally appeared while I was enroute to Delaware from Nevada.
Beaker:
Dr. Christy is not talking on point, now is he? Read the above post by Easterbrook.
For the next, roughly 30 years, Neutral and El Nino periods will comprise 40% of that duration. If Dr. Christy disputes this you have a point to make, but he doesn’t does he?
In fact his point, is precisely mine, that any period comprising equal numbers of El Ninos and La Ninas will result in a warmening wash.
Gary, both I and Prof. Christy are arguing that short term trends should not be used as evidence of long term climate change. Now go look at Figure 3, where Easterbrook is doing EXACTLY that. It is possible that Easterbrook is right, but the fact that he uses two rather dodgy graphs to help prove his point is not very reassuring.
Perhaps you ought to have read my posts a bit more clearly, in which case you will see that it is not the overall prediction that I have criticised, which sounds plausible, just the evidence on which it is based.
[…] I don’t think the world is likely to end any time soon, or that the projected catastrophes will turn to anything. The entire concept of some ‘tipping point’ happening when concentrations of atmospheric CO2 reach 500 ppm are utter nonsense, considering CO2 is logarithmic, and that most of the scarier projects (not predictions!) are based on taking the most extreme interpretation of dubious computer models, not actual experiments or observation (which often contradicts the models). […]
[…] I don’t think the world is likely to end any time soon, or that the projected catastrophes will turn to anything. The entire concept of some ‘tipping point’ happening when concentrations of atmospheric CO2 reach 500 ppm are utter nonsense, considering CO2 is logarithmic, and that most of the scarier projections (not predictions!) are based on taking the most extreme interpretation of dubious computer models, not actual experiments or observation (which often contradicts the models). […]
[…] by Roy Cordato on 22 Aug 2008 at 02:38 pm | Tagged as: Uncategorized This is a post by Don J. Easterbrook, Dept. of Geology, Western Washington University, Bellingham, WA on the blog […]
I analyzed 107 years of N. Amer. temperature data in the late ’80s, subjected them to spectral analysis and discovered a 70± 3year cycle with a predicted peak in 1998, but with short term variations of 1/3 total amplitude. Never published because I couldn’t find a possible mechanism. Now there might be one.
Also, please remember that there also exists anecdotal evidence for a 750 ± 50 year cycle (roman warm, dark ages cold, medieval warm, little ice age cold and modern warm). The latter should have peaked in 2000 ± 50. If the 70 year cycle is real, then it would have continuously modified the climate during these longer cool and warm periods.
Don’t believe in cycles? How about the 100,000 yr. “ice age” cycles that have persisted for the last several million years. Really good ice core data over the last 500,000 years.
Dr. Easterbrook:
Your cooling projections are fascinating. However, exploration geologists working in Alaska report that USGS mapped glaciers are either missing or in a definite negative economy. Based on your projections, does this mean that those glaciers will start advancing again? Or are cooling trends a reflection of increased evaporation (and resulting clouds) from the oceans which may mask global warming? Have you researched precipitation trends? If there is increased evaporation due to global warming, then precipitation totals should be on the rise. This is certainly the coolest and wetest August that I can remember. It seems that one must also incorporate precipitation trends to fully understand the climate issues.
[…] is inversely proportionate. Two factors that does match global temperatures is solar output and the Pacific Decadal Oscillation, which has recently shifted into its cool mode. Addressing the Washington Policymakers in Seattle, […]