Sea Ice Page

Arctic sea ice extent Seasonal comparison of Northern Hemisphere sea ice extent in million square kilometers. Data through 15 Nov 2026. Chart built 17 Nov 2026 06:22 UTC. The plotted quantity is sea ice extent, not sea ice area. NSIDC calculates extent as the sum of grid-cell areas where ice concentration is at least 15 percent, and includes the unobserved Arctic pole hole on the assumption that it is ice-covered. Values are the daily figures published in the NSIDC file, not a 5-day mean. The gray band is the 10th to 90th percentile, and the dashed line is the median, for each calendar date in 1981 through 2010. Percentiles use linear interpolation between ranks. Missing days are not filled. 29 February is omitted because that date has fewer than 20 baseline years. Days are aligned by month and day so 1 March lines up in leap and non-leap years. Lowest daily extent in this file, excluding 14 Sep 1984, is 3.340 million km² on 16 Sep 2012. That date falls in 2012, the comparison year on NSIDC's Northern Hemisphere daily graph. The year 2012 is drawn when this file contains it, because the NSIDC user guide uses 2012 as the comparison year on the Northern Hemisphere daily graph. Source: NSIDC Sea Ice Index G02135 v4.0. https://noaadata.apps.nsidc.org/NOAA/G02135/north/daily/data/N_seaice_extent_daily_v4.0.csv. In this file the Source Data column switches to NSIDC-0803 (AMSR2) on 1 Jan 2025, the date the NSIDC Version 4 user guide gives for that input. NSIDC's transition notice says AMSR2 typically places the ice edge slightly inboard of SSMIS, by less than about 0.1 million km² in the Northern Hemisphere, and that the intercalibration is preliminary. Plotted values are not adjusted. Through 20 August 1987 the observations in this file are every other day, the SMMR spacing NSIDC documents. 14 September 1984 is omitted from the baseline and from the lowest-day search because the NSIDC user guide says that day's concentration field contains bad data and the extent value should not be used in analysis. This file has no observations from 3 December 1987 through 12 January 1988. The NSIDC user guide says there are no data from 3 December 1987 to 13 January 1988. The chart does not adjust published values and does not claim the series is homogeneous across input-product changes. 0 2 4 6 8 10 12 14 16 18 Jan Feb Mar Apr May Jun Jul Aug Sep Oct Nov Dec Extent (million km²) Arctic sea ice extent Northern Hemisphere · extent, not area 8.999 million km² 15 Nov 2026 Million km² · daily published values, not a 5-day mean 1981–2010 10th–90th percentile 1981–2010 median 2012 · lowest in this file 2025 · previous year 2026 · latest year Source: NSIDC Sea Ice Index G02135 v4.0. Extent, not area. Data through 15 Nov 2026. https://noaadata.apps.nsidc.org/NOAA/G02135/north/daily/data/N_seaice_extent_daily_v4.0.csv
Arctic (Northern Hemisphere) sea ice extent, million km², from the NSIDC daily file. Source: NSIDC Sea Ice Index G02135 v4.0
Antarctic sea ice extent Seasonal comparison of Southern Hemisphere sea ice extent in million square kilometers. Data through 15 Nov 2026. Chart built 17 Nov 2026 04:22 UTC. The plotted quantity is sea ice extent, not sea ice area. NSIDC calculates extent as the sum of grid-cell areas where ice concentration is at least 15 percent, and includes the unobserved Arctic pole hole on the assumption that it is ice-covered. Values are the daily figures published in the NSIDC file, not a 5-day mean. The gray band is the 10th to 90th percentile, and the dashed line is the median, for each calendar date in 1981 through 2010. Percentiles use linear interpolation between ranks. Missing days are not filled. 29 February is omitted because that date has fewer than 20 baseline years. Days are aligned by month and day so 1 March lines up in leap and non-leap years. Lowest daily extent in this file, excluding 14 Sep 1984, is 1.848 million km² on 21 Feb 2023. The year 2012 is drawn when this file contains it, because the NSIDC user guide uses 2012 as the comparison year on the Northern Hemisphere daily graph. Source: NSIDC Sea Ice Index G02135 v4.0. https://noaadata.apps.nsidc.org/NOAA/G02135/south/daily/data/S_seaice_extent_daily_v4.0.csv. In this file the Source Data column switches to NSIDC-0803 (AMSR2) on 1 Jan 2025, the date the NSIDC Version 4 user guide gives for that input. NSIDC's transition notice says AMSR2 typically places the ice edge slightly inboard of SSMIS, by less than about 0.15 million km² in the Southern Hemisphere, and that the intercalibration is preliminary. Plotted values are not adjusted. Through 20 August 1987 the observations in this file are every other day, the SMMR spacing NSIDC documents. 14 September 1984 is omitted from the baseline and from the lowest-day search because the NSIDC user guide says that day's concentration field contains bad data and the extent value should not be used in analysis. This file has no observations from 3 December 1987 through 12 January 1988. The NSIDC user guide says there are no data from 3 December 1987 to 13 January 1988. The chart does not adjust published values and does not claim the series is homogeneous across input-product changes. 0 2 4 6 8 10 12 14 16 18 20 Jan Feb Mar Apr May Jun Jul Aug Sep Oct Nov Dec Extent (million km²) Antarctic sea ice extent Southern Hemisphere · extent, not area 14.777 million km² 15 Nov 2026 Million km² · daily published values, not a 5-day mean 1981–2010 10th–90th percentile 1981–2010 median 2012 · comparison year 2023 · lowest in this file 2025 · previous year 2026 · latest year Source: NSIDC Sea Ice Index G02135 v4.0. Extent, not area. Data through 15 Nov 2026. https://noaadata.apps.nsidc.org/NOAA/G02135/south/daily/data/S_seaice_extent_daily_v4.0.csv
Antarctic (Southern Hemisphere) sea ice extent, million km², from the NSIDC daily file. Source: NSIDC Sea Ice Index G02135 v4.0
Global sea ice extent, Arctic plus Antarctic
Global sea ice extent: Arctic plus Antarctic, on days present in both NSIDC daily files. Source: NSIDC Sea Ice Index G02135 v4.0
Arctic September minimum sea ice extent by year
Arctic September minimum: the lowest daily extent in each September. 14 Sep 1984 is left out because NSIDC says that day should not be used. Source: NSIDC Sea Ice Index G02135 v4.0
PIOMAS monthly Arctic sea ice volume
PIOMAS monthly Arctic sea ice volume, thousand km³. Source: University of Washington Polar Science Center

Note: the latest PIOMAS month available is February 2026.

JAXA Arctic sea ice extent by year
JAXA / ADS Arctic sea ice extent, current year compared with past years. Source: Arctic Data archive System (NIPR)
Current Arctic sea ice extent map – NSIDC Sea Ice Index
Current Arctic sea ice extent map, updated daily. Source: NSIDC Sea Ice Index
Map of the Arctic Ocean and its marginal seas
Map of the Arctic Ocean and its marginal seas (Beaufort, Chukchi, East Siberian, Laptev, Kara, Barents and others), for reading the regional sea ice charts. Source: Wikimedia Commons

Daily Mean Temperature North of 80°N – 2026Latest: Nov 16, 2026: 251.34 K = -21.81°C (-7.3°F), +2.9°C (+5.1°F) vs 1958–2002 mean240245250255260265270275280-30-20-100JanFebMarAprMayJunJulAugSepOctNovDecTemperature (K)Temperature (°C)273.15 K = 0°C (32°F)Data: DMI, ERA40 1958–2002 climate (green), ECMWF operational analysis (red)

Danish Meteorological Institute (DMI) – chart drawn automatically from DMI’s daily data | → DMI Mean Temperature above 80°N data files (all years)

RSS Northern Polar Temperature Lower Troposphere (TLT) – 1979 to present:

RSS/AMSU lower troposphere temperature time series for the Northern Polar region are available via the RSS interactive browser. Select Channel TLT (v4.0) and Region North Polar.

→ Open RSS MSU/AMSU Time Series Browser

Remote Sensing Systems (RSS) – Microwave Sounding Units (MSU/AMSU)


Northern Hemisphere Surface Temperatures
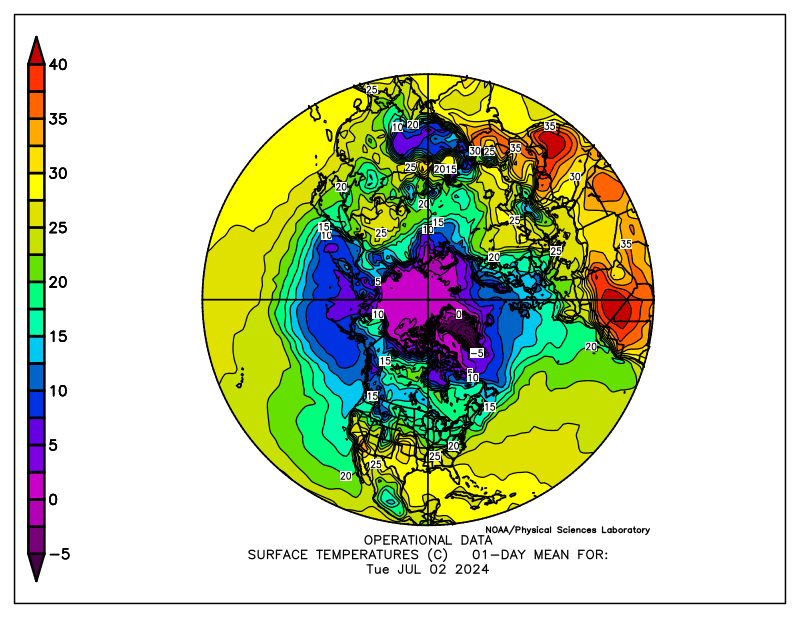
Northern Hemisphere Surface Temperatures – NOAA PSL

NOAA – Physical Sciences Laboratory (PSL) – Click the image to view at source | → NOAA PSL Maps


Arctic Sea Surface Temperature

▶ NOAA Coral Reef Watch daily 5 km SST

Moyhu – Arctic Sea Surface Temperature – 50 Day Animation

Moyhu – Arctic Sea Surface Temperature – 365 Day Animation


Sea Ice Concentration

Arctic Sea Ice Concentration:

Arctic sea ice concentration (AMSR2) – University of Bremen

University of Bremen – AMSR2 sea ice concentration, updated daily – Click the image to view at source | → University of Bremen Sea Ice Concentration

Canadian Sea Ice Concentration:

▶ Canadian Ice Service – IceGraph
▶ Canadian Ice Service – latest ice conditions


Arctic Sea Ice Extent With Anomaly

Arctic Sea Ice Extent with Anomaly – NSIDC

National Snow & Ice Data Center (NSIDC) – Click the image to view at source | → NSIDC Arctic Sea Ice News


Arctic Sea Ice Thickness

Arctic thin sea ice thickness (SMOS/SMAP) – University of Bremen

University of Bremen – Thin Ice Thickness – → University of Bremen Sea Ice

N.B. Per the University of Bremen: Thin sea ice thickness data are calculated only during the freezing season (October to April in the Arctic). During the melting season the procedure does not yield meaningful results.

Real-Time Nowcast/Forecast in Meters:

▶ Polar Portal (DMI) sea ice thickness and volume

Arctic Sea Ice Speed & Drift:

▶ EUMETSAT OSI SAF sea ice products

Arctic Sea Ice Volume – Model from the University of Washington (Note: this is only updated monthly, and is a model output, not a real-time observation, details here):

Arctic Sea Ice Volume Anomaly – University of Washington PIOMAS

University of Washington – Polar Science Center – PIOMAS Arctic Sea Ice Volume Model – Click the image to view at source | → UW PIOMAS Sea Ice Volume


Greenland Ice Sheet Surface Mass Balance

▶ Polar Portal – Greenland surface mass balance (map and daily graphs)


Arctic Satellite Imagery

NASA WorldView – True Color Arctic Satellite Image – With zoom – NASA GIBS/WorldView

NASA WorldView – Bands 3-6-7 Arctic Satellite Image – With Zoom – NASA

NASA WorldView – Aqua True Color Arctic Satellite Image – With Zoom – NASA


Antarctic Graphs

Antarctic Sea Ice Extent – 15% or Greater:

Antarctic sea ice extent, current year against the 1981–2010 median – NSIDC

National Snow & Ice Data Center (NSIDC) – Click the image to view at source | → NSIDC Sea Ice News

JAXA Antarctic Sea Ice Extent – 15% or Greater:

JAXA Antarctic Sea Ice Extent – Current Season JAXA Antarctic Sea Ice Extent – All Years

JAXA / NIPR – → VISHOP Sea Ice Extent Viewer

JAXA extent data can be downloaded from the VISHOP viewer.


Antarctic Temperature

RSS Southern Polar Temperature Lower Troposphere (TLT) – 1979 to present:

RSS/AMSU lower troposphere temperature time series for the Southern Polar region are available via the RSS interactive browser. Select Channel TLT (v4.0) and Region South Polar.

→ Open RSS MSU/AMSU Time Series Browser

Remote Sensing Systems (RSS) – Microwave Sounding Units (MSU/AMSU)


Antarctic Sea Surface Temperature

Southern Ocean SST:

Moyhu – Antarctic Sea Surface Temperature – 50 Day Animation

Moyhu – Antarctic Sea Surface Temperature – 365 Day Animation


Antarctic Sea Ice Imagery

Southern Hemisphere Sea Ice Extent With Anomaly:

Antarctic Sea Ice Extent with Standard Deviation – NSIDC

National Snow & Ice Data Center (NSIDC) – Click the image to view at source | → NSIDC Sea Ice News


South Pole Station Webcam

South Pole Station Webcam – Amundsen-Scott – NOAA GML

Amundsen-Scott South Pole Station – NOAA Global Monitoring Laboratory (GML) | → NOAA GML South Pole Observatory


Source Guide

Danish Meteorological Institute (DMI) – Centre for Ocean and Ice
Home Page – https://www.dmi.dk/
80°N temperature data files – https://download.dmi.dk/pub/plus80N_temperatureindex/

climate4you.com – Ole Humlum – Professor, University of Oslo Department of Geosciences
Home Page – https://www.climate4you.com/
Sea Ice Page – https://www.climate4you.com/SeaIce.htm

moyhu – Nick Stokes
Home Page – https://moyhu.blogspot.com/
Regional Hi-Res SST Movies – https://moyhu.blogspot.com/p/sst-regional-movies-as-described-here-i.html

Naval Research Laboratory (NRL) – HYCOM Consortium for Data-Assimilative Ocean Modeling
HYCOM Arctic Home Page – https://www7320.nrlssc.navy.mil/GLBhycomcice1-12/

National Snow and Ice Data Center (NSIDC)
Home Page – https://nsidc.org/
Sea Ice Index – https://nsidc.org/data/seaice_index/
Arctic Sea Ice News & Analysis – https://nsidc.org/arcticseaicenews/
Charctic Interactive Graph – https://nsidc.org/arcticseaicenews/charctic-interactive-sea-ice-graph/
Northern Hemisphere Sea Ice Extent Data – https://noaadata.apps.nsidc.org/NOAA/G02135/north/daily/data/
Southern Hemisphere Sea Ice Extent Data – https://noaadata.apps.nsidc.org/NOAA/G02135/south/daily/data/

University of Bremen
Home Page – https://www.iup.uni-bremen.de/eng/
Sea Ice Concentration Page – https://seaice.uni-bremen.de/sea-ice-concentration/
Thin Ice Thickness – https://seaice.uni-bremen.de/thin-ice-thickness/

JAXA – Japan Aerospace Exploration Agency / National Institute of Polar Research (NIPR)
VISHOP Sea Ice Extent Viewer – https://ads.nipr.ac.jp/vishop/#/extent

NASA – Worldview / GIBS
Arctic Imagery – https://worldview.earthdata.nasa.gov/?p=arctic

National Oceanic & Atmospheric Administration (NOAA) – National Centers for Environmental Information (NCEI)
Home Page – https://www.ncei.noaa.gov/

National Oceanic & Atmospheric Administration (NOAA) – National Weather Service – Environmental Modeling Center
Home Page – https://www.emc.ncep.noaa.gov/

U.S. National Ice Center (USNIC) (formerly natice.noaa.gov)
Products Page – https://usicecenter.gov/Products

National Oceanic & Atmospheric Administration (NOAA) Arctic Program
https://arctic.noaa.gov/

NOAA – Physical Sciences Laboratory (PSL) (formerly ESRL)
Home Page – https://psl.noaa.gov/
Products Page – https://psl.noaa.gov/products/
Climate and Weather Data – https://psl.noaa.gov/data/
Maps Room – https://psl.noaa.gov/map/

Nansen Environmental and Remote Sensing Center (NERSC) – Arctic Regional Ocean Observing System (Arctic ROOS)
Home Page – https://nersc.no/en/

OSI-SAF – EUMETSAT Ocean and Sea Ice Satellite Application Facility (formerly Norway Met SAF)
Home Page – https://osi-saf.eumetsat.int/
Sea Ice Products – https://osi-saf.eumetsat.int/products/sea-ice-products

University of Washington – Polar Science Center – PIOMAS Arctic Sea Ice Volume
https://psc.apl.washington.edu/research/projects/arctic-sea-ice-volume-anomaly/

Polar Portal – Greenland Surface Mass Balance
https://polarportal.dk/en/greenland/surface-conditions/

Environment and Climate Change Canada – Canadian Ice Service
https://www.canada.ca/en/environment-climate-change/services/ice-forecasts-observations/latest-conditions.html