The Week That Was: 2015-03-07 (March 7, 2015) Brought to You by SEPP (www.SEPP.org) The Science and Environmental Policy Project
THIS WEEK:
By Ken Haapala, President, Science and Environmental Policy Project (SEPP)
Assertions and Creditable Evidence: This week, the movie, Merchants of Doubt, was released, which claims that certain scientists were in the pay of tobacco companies, etc. without advancing credible evidence. These scientists had the audacity of challenging that human emissions of greenhouse gases, particularly carbon dioxide, are causing unprecedented and dangerous global warming. Of course, warming has stopped even though emissions continue to increase and atmospheric carbon dioxide (CO2) continues to increase.
The movie is based on a book of the same name by Oreskes and Conway, which offers no credible evidence showing that the four scientists, including SEPP Chairman, Fred Singer, were paid by tobacco companies.
Without a causal mechanism, establishing that inhaling hot cigarette smoke was the primary cause of lung cancer was a difficult, statistically debatable process. Initially, many possible causes were considered, including replacing dirt roads with asphalted roads. The work by Sir Bradford Hill, and others, is laudatory.
There is no question that tobacco companies used unscrupulous means to attack the credibility of the researchers. This is well documented. Today’s issue centers on claims that anyone who questions the rigor of the statistical work supporting a politically popular cause must be using similar methods as the tobacco companies did – guilt by association. Fred Singer, who does not smoke, had the audacity of questioning the claim that second-hand smoke causes cancer. The claim is extremely weak, and far below any standard statistical threshold. For this, he was attacked in both the movie and the book as receiving money from tobacco companies, without any credible evidence supporting the claim.
These efforts illustrate how politically motivated persons will label those, who criticize the lack of rigorous science supporting a politically popular cause, as anti-science, or as paid by third parties. That scientists, and once highly-regarded scientific institutions, join this effort demonstrates the general lowering of standards of acceptable scientific rigor.
Fred Singer has challenged the producer of the movie for evidence. Ken Haapala is asking those who give it positive reviews to please provide credible evidence supporting claims that Singer were financially supported by tobacco companies. Of course, there is none. In fact, during his 25-year service as president of SEPP he received no salary or fee income whatsoever. Further, SEPP does not solicit support from corporations or government.
There may be a silver lining in the release of the movie. It comes at a time of increasing popularity of courtroom drama and crime shows. These are educating the viewing public that hearsay and rumor are not credible evidence. Some members of the public may begin to question the claims in the book and the movie that fail to produce credible evidence as hearsay and rumor. Who knows, they may begin to ask the same question about claims that human emissions of carbon dioxide are causing dangerous global warming? See links under Communicating Better to the Public – Dream Evidence Up.
###################################################
Quote of the Week: It is in the admission of ignorance and the admission of uncertainty that there is a hope for the continuous motion of human beings in some direction that doesn’t get confined, permanently blocked, as it has so many times before in various periods in the history of man. Richard Feynman [Brainy Quote]
###################################################
Number of the Week: Down 0.20%; Up 13.1% — impact of the “stimulus drill?”
###################################################
Witch Hunt: As described in the February 28 TWTW, some members of Congress, who advocate that government regulations can protect the public from global warming/climate change, have begun a Witch Hunt against those skeptical about the science supporting the claim that human emissions of carbon dioxide are causing dangerous global warming. The list includes Roger Pielke Jr. who is not a skeptic, but fell afoul of the President’s science advisor, John Holdren, who asserts that climate change is increasing severe weather events, and associated costs. Pielke asserted that the evidence does not support this claim about increasing weather events, and, if the data is adjusted for inflation and a shift of more people living in areas that experience such events, such as sandy ocean beaches on the east coast of the US, there is no increase in the costs of these events. Pielke’s analysis is backed-up by data from the two largest re-insurance companies in the world, Munich Re and Swiss Re.
Two of the more notable commentaries that appeared this week in the push-back came from Richard Lindzen, Professor Emeritus of Atmospheric Science at MIT, himself a target, and Robert Carter, who was Professor and Head of School of Earth Sciences between 1981 and 1999 at James Cook University in Australia. Carter is a lead editor of the latest publications of the Non-governmental International Panel on Climate Change (NIPCC), in 2013 and 2014.
Writing in the Wall Street Journal, Lindzen addressed the political assault on climate skeptics in general terms, pointing out that the change in terminology from “man-made global warming” to “climate change” “indicates the silliness of the issue.” “The climate has been changing since the Earth was formed. This normal course is now taken to be evidence of doom.”
“Individuals and organizations highly vested in disaster scenarios have relentlessly attacked scientists and others who do not share their beliefs. The attacks have taken a threatening turn.
“As to the science itself, it’s worth noting that all predictions of warming since the onset of the last warming episode of 1978-98—which is the only period that the United Nations Intergovernmental Panel on Climate Change (IPCC) attempts to attribute to carbon-dioxide emissions—have greatly exceeded what has been observed. These observations support a much reduced and essentially harmless climate response to increased atmospheric carbon dioxide.
“In addition, there is experimental support for the increased importance of variations in solar radiation on climate and a renewed awareness of the importance of natural unforced climate variability that is largely absent in current climate models. There also is observational evidence from several independent studies that the so-called “water vapor feedback,” essential to amplifying the relatively weak impact of carbon dioxide alone on Earth temperatures, is canceled by cloud processes.
“There are also claims that extreme weather—hurricanes, tornadoes, droughts, floods, you name it—may be due to global warming. The data show no increase in the number or intensity of such events. The IPCC itself acknowledges the lack of any evident relation between extreme weather and climate, though allowing that with sufficient effort some relation might be uncovered.
World leaders proclaim that climate change is our greatest problem, demonizing carbon dioxide. Yet atmospheric levels of carbon dioxide have been vastly higher through most of Earth’s history. Climates both warmer and colder than the present have coexisted with these higher levels.
“Currently elevated levels of carbon dioxide have contributed to increases in agricultural productivity. Indeed, climatologists before the recent global warming hysteria referred to warm periods as “climate optima.” Yet world leaders are embarking on costly policies that have no capacity to replace fossil fuels but enrich crony capitalists at public expense, increasing costs for all, and restricting access to energy to the world’s poorest populations that still lack access to electricity’s immense benefits.
“Billions of dollars have been poured into studies supporting climate alarm, and trillions of dollars have been involved in overthrowing the energy economy. So it is unsurprising that great efforts have been made to ramp up hysteria, even as the case for climate alarm is disintegrating.
Lindzen points out that the New York Times uses old material to trigger an investigation by Rep. Raul Grijalva of Arizona into Willie Soon. Lindzen further states that three Senators also used the article, “as the basis for a hunting expedition into anything said, written and communicated by seven individuals— David Legates, John Christy, Judith Curry, Robert Balling, Roger Pielke Jr. , Steven Hayward and me—about testimony we gave to Congress or other governmental bodies. We were selected solely on the basis of our objections to alarmist claims about the climate.
Mr. Grijalva’s letters convey an unstated but perfectly clear threat: Research disputing alarm over the climate should cease lest universities that employ such individuals incur massive inconvenience and expense—and scientists holding such views should not offer testimony to Congress. After the Times article, Sens. Edward Markey (D., Mass.), Sheldon Whitehouse (D., R.I.) and Barbara Boxer (D., Calif.) also sent letters to numerous energy companies, industrial organizations and, strangely, many right-of-center think tanks (including the Cato Institute, with which I have an association) to unearth their alleged influence peddling.
The lengthy article by Carter details the current status of non-government grant-funding in the US and how it applied to Willie Soon, who is being demonized in the press and by members of Congress for being partially funded by utilities in the past. Carter also outlines the paper Soon co-authored with three others suggesting that their simple model out-performs IPCC models in forecasting recent temperatures; then, asks if the paper engendered a conflict of interest. The issue appears to be more a false scandal contrived by Greenpeace and its advocates in the media and Congress. [Note that Southern Company, the utility mentioned in the NYT article, is also a lead owner of the nuclear plants in the US now under construction.]
The leaders of major scientific institutions should be highly concerned. This method of creating an environmental-media-political scandal can extend to virtually all forms of research financing – government or private. As government reports have documented, since fiscal year 1993, the US government has spent more than $35 billion on climate science, with no major programs on the natural causes of global warming/climate change. Fairly or unfairly, those who dispensed and received these fund can be accused by others of promoting biased climate science. See links under Suppressing Scientific Inquiry – The Witch Hunt
*************
Changing Tunes: On his web site, No Tricks Zone, Pierre Gosselin, links to Senate testimony by EPA Administrator Gina McCarthy who states: The performance of the models “makes no difference to the validity and robustness of climate science.” This is from the head of the agency that gave the projections from climate models as a justification for declaring that greenhouse gases, particularly carbon dioxide, endanger human health. No one in the Climate Establishment, including the EPA, has demonstrated the validity of climate models, or produced credible evidence that human carbon dioxide emissions cause unprecedented and dangerous global warming. The claimed proof is in the models, which McCarthy now claims do not make a difference
The entire apparatus of fear of global warming is built on fears generated by the climate models. Perhaps the first group in need of aggressive investigation are government bureaucrats and scientists: to include all sources of past funding and contributions to funding of outside groups. Government funding is no assurance of unbiased, high-quality of work.
As Fred Singer commented in Nature: “Successive IPCC summaries have claimed increasing certainty [from 50% in 1996, rising to >95% in 2013] about a human cause of global warming — even as the disparity between observations and IPCC models continues to grow year by year –now for more than 18 years.
This is becoming somewhat ridiculous — especially since there has been no satisfactory explanation for this disparity — and no validation at all of these failed climate models. Yet politicians seem anxious to devise hugely expensive solutions to a non-existent problem; these will hurt the poor of the world and increase poverty in developed countries.”
See link under EPA and other Regulators on the March and http://www.nature.com/news/un-climate-panel-charts-next-steps-1.17019?WT.ec_id=NATURE-20150305
*************
Homo genus: In Ethiopia, researchers have discovered the 2.8 million year-old jawbone of a skull now thought to be evidence of the first human from the Homo genus. Of the some 20 species in the Homo genus, the only one surviving is Homo sapiens, which evolved in the Tropics. Yet, government bureaucrats and some government funded scientists insist that warming will harm the health of Homo sapiens? See link under Questioning the Orthodoxy, though the report does not ask the question.
*************
New Ice Age? Writing in ICECAP, Joe D’Aleo discusses the extreme cold that has marked the northern part of North America, west of the Rockies, over the past few years. In the early 1970s, climate alarmists would have called it proof of a new Ice Age. Rather than calling it proof of anything, D’Aleo makes the following observation in the post:
“Note that we have high respect for NOAA forecasters at all levels who strive hard to provide accurate forecasts and life-saving warnings. However, the last two years had high confidence in cold forecasts based on ocean temperature patterns. I was told over dozen years ago, NOAA seasonal forecasters are not permitted to work with any factors not statistically determined by the universities or labs to be valid. Private sector forecasters can play detective and look at all factors- like ocean warm and cold pools outside the tropical Pacific and solar. See how well the ocean pools and other factors’ analog pattern (left) fit the actual November to February mean (through February 27) (right)” [Graph on web site. Boldface added.]
The observation illustrates an important issue that is becoming a major problem to weather forecasting in the US, particularly in winter as the ocean circulations shift. Government-funded research has not validated that natural changes play a major role in global warming/climate change. Please note, D’Aleo’s company, WeatherBell Analytics LLC, is forecasting that this week’s warm-up west of the Rockies will not last. See link under Changing Weather.
*************
Number of the Week: Down 0.20%; Up 13.1% — impact of the “stimulus drill?” Using data from the Bureau of Labor Statistics, energy economist Mark Perry points out that, from 2008 to the end of 2014, employment in Texas grew by 13.4%. He attributes much of this growth to the tremendous boost of oil production in Texas from the use of deep underground horizontal drilling and hydraulic fracturing of dense shale – fracking. No doubt, part of the employment growth is from the use of these techniques to extract natural gas in Texas. One could call these techniques the “stimulus bit.”
Perry calculates that during the same period, without Texas, US employment, fell 0.20%. [This fall in employment is in spite of the so-called 2009 “stimulus bill” which, including subsequent deficit spending, greatly increased national debt. When analyzing the “stimulus bill” some economists reported that less than 10% of the spending went to stimulating productivity, not including faddish energy schemes such as solar, wind, and electric vehicles.]
The contrast may not be completely compelling, but it is important. Which is better for the public, a “stimulus bill” which increases debt and does not increase employment, or the “stimulus drill” which requires no subsidies and increases productivity and employment?
Yet, many green organizations, and the politicians and media who support them, advocate a “stimulus bill” and oppose the “stimulus drill.”
###################################################
ARTICLES:
Please note that articles that are not linked or summarized here are reproduced in the Articles Section of the full TWTW that can be found on the web site under the date of the TWTW.
1. The Political Assault on Climate Skeptics
Members of Congress send inquisitorial letters to universities, energy companies, even think tanks.
By Richard Lindzen, WSJ, Mar 4, 2015
[SUMMARY: This important op-ed is largely summarized in the This Week section above. **********************
2. ‘Merchants of Doubt’ Review: Pulling Back the Curtain
A polemic pleads for skepticism and clear thinking in the face of rampant misinformation and science denial
By Joe Morgenstern, WSJ, Mar 5, 2015
http://www.wsj.com/articles/merchants-of-doubt-review-pulling-back-the-curtain-1425586417
[SUMMARY: Mr Morgenstern’s comments on the film were respectful, compared to most. In the comments section, Mr. Morgenstern was politely asked to provide evidence that Fred Singer received money or was employed by tobacco companies, since the new president, Ken Haapala, has found no such evidence.
**********************
3. Limits Sought on GMO Corn as Pest Resistance Grows
Rootworm gains ground; seed producers criticize EPA proposal
By Jacob Bunge, WSJ, Mar 5, 2015
http://www.wsj.com/articles/limits-sought-on-gmo-corn-as-pest-resistance-grows-1425587078
[SUMMARY: The ability of rootworm larvae to adapt to GM corn can become an important issue for producers of genetically modified organisms (GMO). Companies provided GMO corn can help by insisting that the purchasers of their products, particularly farmers in the Mid-West, use prudent, well established methods, such as crop rotation, to alleviate the pest, rather than repeatedly sowing with the same corn year after year.]
###################################################
NEWS YOU CAN USE:
Suppressing Scientific Inquiry – The Witch Hunt
Richard Lindzen: The Political Assault On Climate Sceptics
Shortened version of Lindzen’s comments in the WSJ, GWPF, Mar 5, 2015
http://www.thegwpf.com/richard-lindzen-the-political-assault-on-climate-sceptics/
Statement by Dr. Willie Soon
By Willie Soon, Heartland, Mar 2, 2015
https://www.heartland.org/policy-documents/statement-dr-willie-soon
Statement Regarding Allegations Concerning Dr. Willie Soon
By Robert M. Carter, The Heartland Institute, Mar 3, 2015
https://www.heartland.org/policy-documents/statement-regarding-allegations-concerning-dr-willie-soon
The journal Nature strongly opposes Dems ‘fishing expedition’ witch-hunt of climate skeptics
By Staff Writer, The Hockey Schtick, Mar 4, 2015
http://hockeyschtick.blogspot.com/2015/03/the-journal-nature-strongly-opposes.html
Peter Foster: Crushing climate thoughtcrime
By Peter Foster, Financial Post, Feb 26, 2015 Updated Mar 3, 2015 [H/t GWPF]
http://business.financialpost.com/2015/02/26/peter-foster-crushing-climate-thoughtcrime/
Running Updates on the “Witch Hunt”
By Roger Pielke Jr. His Blog, Mar 2, 2015
http://rogerpielkejr.blogspot.com/2015/03/this-post-will-serve-as-running-update.html
Stifling Climate Research & Opinion: Another Desparado Mistake
By James Rust, Master Resource, Mar 5, 2015
https://www.masterresource.org/debate-issues/nyt-stifled-research/
A Shameful Climate Witch Hunt
By Rich Lowry, Real Clear Politics, Feb 28, 2015
http://www.realclearpolitics.com/articles/2015/02/28/a_shameful_climate_witch_hunt_125769.html
AMS opposes climate witch hunts
By Luboš Motl, The Reference Frame, Feb 28, 2015
http://motls.blogspot.com/2015/02/ams-opposes-climate-witch-hunts.html#more
Climatic Jihad?
By Paul Driessen, WUWT, Feb 28, 2015
http://wattsupwiththat.com/2015/02/28/climatic-jihad/
Climate skeptic blasts ‘shameless attempt to silence’ research
By Timothy Cama, The Hill, Mar 2, 2015
Climate Change Researcher Offers a Defense of His Practices
By Justin Gillis, NYT, Mar 2, 2015
Dr Willie Soon: A Scientist in the Humble Quest for Truth
By Christopher Monckton, Breitbart, Feb 28, 2015
http://www.breitbart.com/london/2015/02/28/dr-willie-soon-a-scientist-in-the-humble-quest-for-truth/
Green Slander
By Alan Caruba, Warning Signs, Feb 28, 2015
http://factsnotfantasy.blogspot.com/2015/02/green-slander.html
Political Science: Heat’s on Climate Change Dissidents
By Debra J. Saunders, Townhall, Mar 1, 2015 [H/t Clyde Spencer]
“Regurgitate Unsupportable Accusations, We Much?” Kert Davies is Back. Again
By Russell Cook, Somewhat Reasonable, Feb 26, 2015
Statement from Heartland on the climate skeptic witch-hunt
By Anthony Watts, WUWT, Mar 2, 2015
http://wattsupwiththat.com/2015/03/02/statement-from-heartland-on-the-climate-skeptic-witch-hunt/
Challenging the Orthodoxy
Differential temperature trends at the surface and in the lower atmosphere
By Roger Pielke Sr. Phil Klotzbach, John Christy, and Dick McNider, Climate Etc. Mar 4, 2015
European Institute For Climate And Energy: Ocean Cycles Are Main Driver, No Relationship Between Arctic Sea Ice And European Winters!
By P Gosselin, No Tricks Zone, Mar 3, 2015
Former IPCC Climatologist Lennart Bengtsson Calls Out Spiegel On Climate Gloom: “Wrong…Hopelessly Naïve…Ought To Know Better”
By P Gosselin, No Tricks Zone, Mar 4, 2015
Monckton: The assumption that “temperature feedbacks” would double or triple warming is the largest error made by climate models
By Staff Writer, The Hockey Schtick, Mar 3,, 2015
http://hockeyschtick.blogspot.com/2015/03/moncton-assumption-that-temperature.html
Questioning the Orthodoxy
New fossil pushes back Homo genus 400,000 years
By Brooks Hays, Addis Ababa, Ethiopia (UPI), Mar 4, 2015
http://www.terradaily.com/reports/New_fossil_pushes_back_Homo_genus_400000_years_999.html
Chilling Climate Change at New York Times
By Larry Bell, Newsmax, Mar 2, 2015
The Delusional and Disastrous Triple Point of White House Climatology
By Anthony Sadar, American Thinker, Feb 28, 2015 [H/t Timothy Wise]
Ice Is Melting But The Polar Bears Are Fine, Say Sceptics
By Ben Webster, The Times, Via GWPF, Feb 27, 2015
http://www.thegwpf.com/ice-is-melting-but-the-polar-bears-are-fine-say-sceptics/
How wrong can the Guardian be?
By Andrew Montford, Bishop Hill, Mar 2, 2015
http://bishophill.squarespace.com/blog/2015/3/2/how-wrong-can-the-guardian-be.html
Memo To Global Warming Alarmists: Science Is Often Wrong
By Kerry Jackson, The Hill, Mar 3, 2015
Social Benefits of Carbon
Munching bugs thwart eager trees, reducing the carbon sink
By Staff Writers, Madison WI (SPX), Mar 04, 2015
http://www.terradaily.com/reports/Munching_bugs_thwart_eager_trees_reducing_the_carbon_sink_999.html
Major changes in world’s leaf growth patterns over recent decades
By Staff Writers, Otago, New Zealand (SPX), Mar 05, 2015
[SEPP Comment: Need to substantiate the claim of damage to migrating birds, etc.]
Problems in the Orthodoxy
IPCC in transition
By Judith Curry, Climate Etc. Mar 3, 2015
http://judithcurry.com/2015/03/03/ipcc-in-transition/
Junk Science Week 2015: Time for post-Pachauri reform at IPCC
By Judith Curry, Financial Post, Mar 4, 2015
[SEPP Comment: Shortened version of Curry’s comments (immediately above) with a graph showing the growing disparity between model projections and actual surface temperatures ((1961 to 2010, HadCRUT)]
IPCC The Politics of Bureaucracies: Pachauri’s Bizarre Tip Of Iceberg
By Tim Ball, WUWT, Mar 4, 2015
India to partner with Africa to fight climate change
By Staff Writer, Times of India, Mar, 4, 2015 [H/t GWPF]
IUCN Specialist Group quietly adds “sea ice changes” to their polar bear status table
By Susan Crockford, Polar Bear Science, Mar 1, 2015
Seeking a Common Ground
2 new papers on the ‘pause’
By Judith Curry, Climate Etc. Mar 5, 2015
http://judithcurry.com/2015/03/05/2-new-papers-on-the-pause/
Nominate Judith Curry as the next Chair of the Intergovernmental Panel On Climate Change
By Tom Fuller, WUWT, Mar 4, 2015
Plenty of Wiggle Room in Scientific Certainty
By Mike Kimmitt, American Thinker, Feb 28, 2015
http://www.americanthinker.com/articles/2015/02/plenty_of_wiggle_room_in_scientific_certainty.html
What is the Optimum Temperature with respect to human mortality?
By Indur Goklany, WUWT, Mar 2, 2015
Population: the elephant in the room
By Martin Livermore, The Scientific Alliance, Mar 6, 2015
http://scientific-alliance.org/node/914
“Forecasting this far ahead is not for the faint-hearted. [to 2300]
[SEPP Comment: As the article states: “Forecasting this far ahead is not for the faint-hearted.” To establish government policy based on such forecasts is absurd.]
Review of Recent Scientific Articles by CO2 Science
2500 Years of Northern South China Sea Surface Temperatures
Yan, H., Soon, W. and Wang, Y. 2015. A composite sea surface temperature record of the northern South China Sea for the past 2500 years: A unique look into seasonality and seasonal climate changes during warm and cold periods. Earth-Science Reviews 141: 122-135., Mar 3, 2015
http://www.co2science.org/articles/V18/mar/a4.php
“These procedures led to their determining that the SSTs of 80-year warm-period time-windows centered on AD 990 and AD 50 were 0.89°C and 1.55°C higher than those of the instrumental period of AD 1990-2000.”
The Medieval Warm Period in West Greenland’s Disko Bugt Area
Ouellet-Bernier, M.-M., de Vernal, A., Hillaire-Marcel, C. and Moros, M. 2014. Paleoceanographic changes in the Disko Bugt area, West Greenland, during the Holocene. The Holocene 24: 1573-1583. Mar 2, 2015
http://www.co2science.org/articles/V18/mar/a1.php
“These efforts revealed the existence of a number of periods of alternating cold and warm sea surface temperatures (SSTs) throughout the Holocene, the last of which warm periods was the Medieval Warm Period that occurred between approximately 1000 and 800 years BP. And in reporting their findings, Ouellet-Bernier et al. say that during this period the region’s “summer SSTs increased to about 10°C,” which they describe as being “much higher than the present day summer SST of about 4.4°C at the coring site,” as recorded in the World Ocean Database of the NODC (2001).”
An 1860 to 2012 History of Storminess in Northern Denmark
Clemmensen, L.B., Hansen, K.W.T and Kroon, A. 2014. Storminess variation at Skagen, northern Denmark since AD 1860: Relations to climate change and implications for coastal dunes. Aeolian Research 15: 101-112. Feb 27, 2015
http://www.co2science.org/articles/V18/feb/a25.php
“’between 1860 and 1875 storminess (wind events exceeding Beaufort 8) is extremely high, but since then storminess decreases.” And they note that, concomitantly, around 1870 the annual drift potential (DP) of coastal dunes was ‘”also extremely high and reaches up to 9600 vector units (VU, knots).” But they say that “since 1980 DP levels are below 3000 VU and decreasing,” which significant “shift in wind climate towards less storminess is seen at a number of stations in NW Europe.”
A Three-Decade History of Australian Region Tropical Cyclones
Dowdy, A.J. 2014. Long-term changes in Australian tropical cyclone numbers. Atmospheric Science Letters 15: 292-298.
http://www.co2science.org/articles/V18/feb/a24.php
“And so we would appear to have another example wherein the claims of proponents of CO2-induced increases in the number of occurrences of various extreme weather events do not appear to jibe with what is observed in the real world of nature.”
Models v. Observations
Antarctic Sea Ice Did The Exact Opposite Of What Models Predicted
By Michael Bastasch, Daily Caller, Mar 2, 2015
http://dailycaller.com/2015/03/02/antarctic-sea-ice-did-the-exact-opposite-of-what-models-predicted/
Climate Models Turn Out To Be “Fairy Tales” … Long-Term Central Europe Winters Show Distinct COOLING Trend!
By P Gosselin, No Tricks Zone, Mar 1, 2015
Model Issues
Lessons from the ‘Irreducibly Simple’ kerfuffle
By Rud Istvan, Climate Etc. Mar 1, 2015
http://judithcurry.com/2015/03/01/lessons-from-the-irreducibly-simple-kerfuffle/
Measurement Issues
Can Adjustments Right a Wrong?
By John Goetz, WUWT, Mar 6, 2015
http://wattsupwiththat.com/2015/03/06/can-adjustments-right-a-wrong/
California’s hockey-sticked temperature outliers
By Patrick Michaels, WUWT, Mar 3, 2015
http://wattsupwiththat.com/2015/03/03/californias-hockey-sticked-temperature-outliers/
Historic documents show half of Australia’s warming trend is due to “adjustments”
Adjustments that cool historic temperatures have almost doubled Australia’s rate of warming.
By Jo Nova, Her Blog, Mar 2, 2015
Changing Weather
A remarkable February 2015
By Joe D’Aleo, ICECAP, Mar 1, 2015
http://icecap.us/index.php/go/joes-blog/a_remarkable_february_2015/
February 2015 coldest in 115 years
By Staff Writers, New Ottawa, Feb 27, 2015 [H/t Climate Depot]
http://ottawa.ctvnews.ca/february-2015-coldest-in-115-years-1.2257188
[SEPP Comment: The coldest ever recorded in eastern Ontario, Canada.]
This is how rain and snow travel across the globe
By Arielle Duhaime-Ross, NASA, Feb 26, 2015 [H/t Clyde Spencer]
http://www.theverge.com/2015/2/26/8116853/NASA-precipitation-map-rain-snow
Polar Vortex Common In The 19thC
By Paul Homewood, Not a Lot of People Know That, Feb 28, 2015
https://notalotofpeopleknowthat.wordpress.com/2015/02/28/polar-vortex-common-in-the-19thc/
Family log of spring’s arrival helps predict climate-driven change
By Staff Writers, Edinburgh, UK (SPX), Mar 05, 2015
More Ice on Great Lakes Now Than During 2014 Polar Vortex
By Barbara Hollingsworth, CNS News, Mar 2, 2015 [H/t Timothy Wise]
NOAA – 2634 Low Max Records Broken or tied From 2015-02-19 to 2015-02-25
By Staff Writer, Sunshine Hours, Feb 28, 2015
Changing Climate
Emperor penguins may have suffered in ice age cold: study
By Staff Writers, Sydney (AFP), March 2, 2015
http://www.spacedaily.com/reports/Emperor_penguins_may_have_suffered_in_ice_age_cold_study_999.html
Evidence Of A Warmer Holocene In The Andes
By Paul Homewood, Not a Lot of People Know That, Mar 2, 2015
https://notalotofpeopleknowthat.wordpress.com/2015/03/02/evidence-of-a-warmer-holocene-in-the-andes/
EPA tackles emissions from refrigerators, air conditioners
By Tim Devaney, The Hill, Mar 2, 2015
http://thehill.com/regulation/234317-epa-tackles-emissions-from-refrigerators-air-conditioners
Changing Cryosphere – Land / Sea Ice
State of the Sea Ice – February 2015
By Robert Cook, WUWT, Mar 5, 2015
http://wattsupwiththat.com/2015/03/05/state-of-the-sea-ice-february-2015/
A 3-D View of the Greenland Ice Sheet Opens Window on Ice History
By Staff Writers, Jackson School of Geosciences, U. Texas, Jan 23, 2015
New paper finds an Arctic glacier was much smaller than the present 4,000-10,000 years ago
By Staff Writer, The Hockey Schtick, Mar 4, 2015
http://hockeyschtick.blogspot.com/2015/03/new-paper-finds-arctic-glacier-was-much.html
Combined Arctic ice observations show decades of loss
By Staff Writers, Seattle WA (SPX), Mar 04, 2015
http://www.spacedaily.com/reports/Combined_Arctic_ice_observations_show_decades_of_loss_999.html
Changing Earth
A new level of earthquake understanding
By Staff Writers, Berkeley CA (SPX), Mar 05, 2015
http://www.terradaily.com/reports/A_new_level_of_earthquake_understanding_999.html
Un-Science or Non-Science?
Deforestation could shift monsoons, leaving India high and dry
By Alisa Tang, Reuters, Mar 2, 2015 [H/t Clyde Spencer]
http://news.yahoo.com/deforestation-could-shift-monsoons-leaving-india-high-dry-200514498.html
Flashback 1985: Gov’t Scientists Predicted NYC Would Resemble Daytona Beach
By Michael Bastasch, Daily Caller, Mar 5, 2015
http://dailycaller.com/2015/03/05/new-york-city-global-warming/
Lowering Standards
BBC: Climate Change By The Numbers
By David Whitehouse, GWPF, Mar 4, 2015
http://www.thegwpf.com/climate-change-by-the-numbers/
“Also, the “pause” is clearly a major area of research and debate in climate science having been described by Nature as the biggest problem in climate science. It’s been so for years, so isn’t it about time the BBC did a proper treatment of it and not just seek comments from the usual suspects? Discussion about the “pause” is everywhere, except on the airwaves.”
[SEPP Comment: BBC misrepresenting the importance of the current trend of no temperature increase.]
Historical horizon
By Andrew Montford, Bishop Hill, Mar 5, 2015
http://bishophill.squarespace.com/blog/2015/3/5/historical-horizon.html
The BBC: an advertising agency for greens
By Andrew Montford, Bishop Hill, Mar 5, 2015
http://bishophill.squarespace.com/blog/2015/3/5/the-bbc-an-advertising-agency-for-greens.html
Communicating Better to the Public – Exaggerate, or be Vague?
Rebutting the claim: Did Human-Caused Climate Change Lead to War in Syria?
By Paul C. “Chip” Knappenberger and Patrick J. Michaels, WUWT, Mar 4, 2015
“It is not until you dig pretty deep into the technical scientific literature, that you find out that the anthropogenic climate change impact on drought conditions in the Fertile Crescent is extremely minimal and tenuous—so much so that it is debatable as to whether it is detectable at all.”
Syria’s civil war linked partly to drought, global warming
By Seth Borenstein, AP, Mar 2, 2015 [H/t Clyde Spencer]
http://news.yahoo.com/syrias-civil-war-linked-partly-drought-global-warming-202505671.html
[SEPP Comment: Where is the temperature data to show global warming, or regional warming? See link immediately above.]
Narrow Media Coverage of Study linking Climate Change to Syria Conflict Misses Fractious Debate on a Field’s Scholarship
By Keith Kloor, Discover, Mar 4, 2015 [H/t GWPF]
NOAA Claims: ‘Elusive El Niño arrives’ – the question is, ‘where’?
By Anthony Watts, WUWT, Mar 5, 2015
http://wattsupwiththat.com/2015/03/05/noaa-claims-elusive-el-nino-arrives-the-question-is-where/
Communicating Better to the Public – Make things up.
Now It’s OK To Lie About Climate Change – Yale Project
By Paul Homewood, Not a Lot of People Know That, Mar 1, 2015
“So, apparently, it is now OK for scientists and other “trusted people” to make claims they know are not true, and use any extreme weather event to support the theory.”
Update: AP’s Seth Borenstein at it again hyping Antarctic melt fears – Recycles same claims from 2014, 1990, 1979, 1922 & 1901! – Climate Depot’s Point-By-Point Rebuttal
By Marc Morano, Climate Depot, Feb 28, 2015
We are already seeing the first examples of how climate change will leave us all thirsty
By Chelsea Harvey, Business Insider, Mar 3, 2015 [H/t Clyde Spencer]
http://news.yahoo.com/already-seeing-first-examples-climate-152527002.html
[SEPP Comment: The articles features a photo of an almost dry Almaden Reservoir near San Jose, California dated January 2014. TWTW Reader Clyde Spencer comments: “I have walked across the bottom of Almaden Reservoir in the 1950s! It was built to capture Winter rains, which were then used to replenish the ground aquifer of Santa Clara Valley by slowing releasing the water into percolation ponds. They were never really intended to hold water all year long.”]
Communicating Better to the Public – Dream Evidence Up.
Naomi Oreskes, THE Merchant of Doubt herself, uses tactics of the tobacco lobby
By Jo Nova, Her Blog, Mar 7, 2015
Meet the Merchants of Doubt: The PR Firms Giving You Cancer, Causing Acid Rain and Killing the Planet
By Lewis Beale, Daily Beast, Mar 3, 2015
Exposing the Doubt-Mongers Trying to Convince You Climate Change Isn’t Real
By Greg Evans, Newsweek, Mar 1, 2015 [H/t Marc Morano]
http://www.newsweek.com/exposing-doubt-mongers-trying-convince-you-climate-change-isnt-real-310372
Communicating Better to the Public – Do a Poll?
Eyeroller: American Thoracic Society Survey Says – Climate change affects your health!
By Anthony Watts, WUWT, Mar 4, 2015
“Moral duty” poll: 57% don’t think UN Scientists can speak with authority on climate
By Jo Nova, Her Blog, Mar 4, 2015
Expanding the Orthodoxy
Doctor objects to ‘stunt’ on climate change while NHS in crisis
Frontline medic accuses Scotland’s Health Minister of ineptitude as she urges hard-pressed staff to take part in Earth Hour campaign on global warming
By Anslan Cramb, Telegraph, UK, Mar 4, 2015 [H/t GWPF]
Non-Green Jobs
Despite falling oil prices, Texas oil output surged in December to the highest level since the 1970s
Mark Perry, AEIdeas, Mar 2, 2015
President Barack Obama’s plan to kill jobs
By David Kreutzer, Milwaukee Journal Sentinel, Feb 28, 2015
The Environmental Protection Agency Comes Down on Texas Jobs
By Staff Writers, NCPA, Mar 4, 2015
Link to study: The EPA Hopes To Kill The Texas Jobs Machine
By Merrill Matthews, Institute for Policy Innovation, Jan 28, 2015
http://www.ipi.org/ipi_issues/detail/the-epa-hopes-to-kill-the-texas-jobs-machine
Funding Issues
Objective Behind Climate Change Is Economic, Not Climatic
A brilliant strategy has superbly garnered the support of virtually every left-leaning organization, media outlet, journalist, and academic across the country.
By Richard Larsen, Western Journalism, Mar 2, 2015
The Political Games Continue
White House threatens veto of EPA ‘secret science’ bill
By Timothy Cama, The Hill, Mar 3, 2015
Just Saying No Isn’t Enough: Environmental Reforms Congress Should Adopt
By Diane Katz, Daily Signal, Mar 5, 2015
Litigation Issues
Judge rules EPA lied about transparency, tells agency to halt discrimination against conservatives
By Stephen Dinan, Washington Times, Mar 2, 2015
http://www.washingtontimes.com/news/2015/mar/2/judge-rules-epa-lied-about-transparency/
Subsidies and Mandates Forever
International Remedies for Foreign Investors in Europe’s Renewable Energy Sector
By Baiju S. Vasani, et al, Jones Day, Feb 2015 [H/t GWPF]
[SEPP Comment: Lawyers will press claims against governments that pulled subsidies.]
‘Lack of clarity’ over energy policy hits UK’s ranking in green power league
Britain falls behind France to 8th place in ranking of attractiveness for renewable energy investment
By Alan Tovey, Telegraph, UK, Mar 2, 2015
[SEPP Comment: Investments that require subsidies to motivate investors are poor investments.]
EPA and other Regulators on the March
“Stunning Development” … EPA Chief Doesn’t Even Know If Climate Projections Are Right Or Wrong!
By P Gosselin, No Tricks Zone, Mar 6, 2015 (Video)
Coal company says EPA climate rule already hurting industry
By Timothy Cama, The Hill, Feb 27, 2015
Sorry EPA, There’s No Evidence You Care About Grid Reliability
By Staff Writers, IER, Feb 26, 2015
Manufacturers: Even with costs halved, ozone reg could still be most expensive
By Lydia Wheeler, The Hill, Feb 26, 2015
White House reviews EPA airplane emissions plan
By Timothy Cama, The Hill, Mar 3, 2015
More sauce
By Andrew Montford, Bishop Hill, Feb 27, 2015
http://bishophill.squarespace.com/blog/2015/2/27/more-sauce.html
[SEPP Comment: The Competitive Enterprise Institute requested information exchanged between members of an EPA office and the Senators who demanded information on certain global warming skeptics.]
Energy Issues – Non-US
Too much energy? Asia at 2030
By Dan Blumenthal, et al, AEI, Feb 25, 2015 [H/t GWPF]
https://www.aei.org/publication/much-energy-asia-2030/
Link to full report: Too much energy? Asia at 2030
By Blumenthal & Scissors, et al, AEI, Feb 2015
https://www.aei.org/wp-content/uploads/2015/02/Too-Much-Energy.pdf
UPDATE 3-China tries to ditch its coal addiction, reduce energy intensity
By Chen Aizhu, Dominique Patton and Kathy Chen, Reuters, Mar 5, 2015
Clean coal capacity in India predicted to hit 103 GW
By Kelvin Ross, Power Engineering, Mar 4, 2015 [H/t GWPF]
[SEPP Comment: Article does not define what is meant by clean coal.]
Energy Issues — US
Making the Moral Case for Fossil Fuels
By Janet Levy, American Thinker, Feb 28, 2015
http://www.americanthinker.com/articles/2015/02/making_the_moral_case_for_fossil_fuels.html
Role of Combined Heat Power
By Donn Dears, Power For USA, Mar 6, 2015
https://dddusmma.wordpress.com/2015/03/06/role-of-combined-heat-power/
US oil keeps booming despite low prices — for now
By Jared Gilmour, The Christian Science Monitor, Mar 3, 2015 [H/t GWPF]
http://www.adn.com/article/20150303/us-oil-keeps-booming-despite-low-prices-now
New Yorkers want to secede to ensure their homes are destroyed by earthquakes and their drinking water poisoned
By Andrew Montford, Bishop Hill, Ma4 4, 2015
Gulf states battle for drilling proceeds
By Timothy Cama, The Hill, Mar 1, 2015
http://thehill.com/policy/energy-environment/234201-gulf-states-battle-for-drilling-proceeds
Washington’s Control of Energy
Warren Buffett slams Keystone delay
By Timothy Cama, The Hill, Mar 2, 2015
http://thehill.com/policy/energy-environment/234349-warren-buffett-slams-keystone-delay
Washington Post: President Obama is Lying About the Keystone Pipeline
By Robert Rapier, Energy Trends, R, Squared, Mar 4, 2015 [H/t Cooler Heads]
[SEPP Comment: Contrary to the article, the cost and safety of transport is important.]
Return of King Coal?
Lithium from the coal in China
By Staff Writers, Handan, China (SPX) Feb 27, 2015
http://www.spacedaily.com/reports/Lithium_from_the_coal_in_China_999.html
[SEPP Comment: Another way to justify coal?]
Oil Spills, Gas Leaks & Consequences
EPA: Methane Emissions from Natural Gas Production Fell 35% Since 2007
By Steve Everley, The Energy Collective, Mar 2, 2015 [H/t GWPF]
Link to EPA report: National Greenhouse Gas Emissions Data: DRAFT INVENTORY OF U.S. GREENHOUSE GAS EMISSIONS AND SINKS: 1990-2013
By Staff Writers, For public Comment, (February 2015)
http://www.epa.gov/climatechange/ghgemissions/usinventoryreport.html
Alternative, Green (“Clean”) Solar and Wind
Oregon’s signature solar energy project built on foundation of false hopes and falsehoods
By Ted Sickinger & Jeff Manning, The Oregonian, Feb 27, 2015 [H/t Myron Ebell]
http://www.oregonlive.com/politics/index.ssf/2015/02/oregon_signature_solar_project.html
How a Solar Farm Set Hundreds of Birds Ablaze
By Brian Stallard, Nature World News, Feb 23, 2015 [H/t WUWT]
http://www.natureworldnews.com/articles/12918/20150223/solar-farm-set-hundreds-birds-ablaze.htm
Is Wave Energy in Our Future?
By Donn Dears, Power For USA, Mar 3, 2015
https://dddusmma.wordpress.com/2015/03/03/is-wave-energy-in-our-future/
[SEPP Comment: Another energy fad?]
Alternative, Green (“Clean”) Energy — Other
FoE in support for fracking shock
By Andrew Montford, Bishop Hill, Mar 6, 2015
http://bishophill.squarespace.com/blog/2015/3/6/foe-in-support-for-fracking-shock.html
[SEPP Comment: Friends of the Earth support fracking for geothermal.]
Health, Energy, and Climate
Climate Change Is Bringing Out Ticks in the Northeast Earlier Each Year
By Bernadette Strong, Youth Health, Feb 28, 2015 [H/t Climate Depot]
Link to paper: Climate change and Ixodes tick-borne diseases of humans
By Ostfeld and Brunner, The Royal Society B, Feb 16, 2015
http://rstb.royalsocietypublishing.org/content/370/1665/20140051
Oh Mann!
Another Couple of Notes about Michael Mann’s “Faux Pause” Post and Steinman et al. 2015
By Bob Tisdale, WUWT, Mar 5, 2015
Climate Oscillations and the Global Warming Faux Pause
By Michael Mann, Huff Post, Mar 2, 2015
A cause for pause? Scientists offer reasons for global warming ‘hiatus’
By Monte Morin, LA Times, Feb 26, 2015 [H/t Clyde Spencer]
http://www.latimes.com/science/sciencenow/la-sci-sn-global-warming-hiatus-20150226-story.html
Mann’s meme generator, from ‘false hockey sticks’ to ‘false pauses’
By Anthony Watts, WUWT, Mar 2, 2015
http://wattsupwiththat.com/2015/03/02/manns-meme-generator-from-false-hockey-sticks-to-false-pauses/
Environmental Industry
Scientists question rush to build Nicaragua canal
By Brooks Hays, Houston (UPI), Mar 4, 2015
http://www.terradaily.com/reports/Scientists_question_rush_to_build_Nicaragua_canal_999.html
[SEPP Comment: Is there any place on the planet that is not home to some of the region’s most fragile ecosystems? Surprised it took so long for environmentalists to oppose the proposal.]
Other Scientific News
NASA has a plan to take the most detailed scans the world’s forests ever
By Pierre Bienaimé, Business Insider, Mar 3, 2015 [H/t Clyde Spencer]
http://news.yahoo.com/nasa-plan-most-detailed-scans-174933650.html
[SEPP Comment: Is NASA becoming the world’s green policeman – or spy?]
Other News that May Be of Interest
Cultural Tipping Point Reached – Hollywood has started mocking global warming
By David Archibald, WUWT, Feb 28, 2015
How Did Multicellular Life Evolve
By Charles Q. Choi for Astrobiology Magazine, Moffet Field CA (SPX), Feb 26, 2015
http://www.spacedaily.com/reports/How_Did_Multicellular_Life_Evolve_999.html
Nobel Peace committee demotes controversial head
By Pierre-Henry Deshaye, Oslo (AFP) March 3, 2015
http://www.spacewar.com/reports/Nobel_Peace_committee_demotes_controversial_head_999.html
###################################################
BELOW THE BOTTOM LINE:
It’s Proof, Proof I tell you! Australia is getting hotter and the future is… back in 1922
By Jo Nova, Her Blog, Mar 3, 2015
Of Bad Luck and Space Mission Numbering
By Roy Spencer, Global Warming, Mar 4, 2015
http://www.drroyspencer.com/2015/03/of-bad-luck-and-space-mission-numbering/
What stage of climate grief are you locked in?
By Jo Nova, Her Blog, Mar 6, 2015
http://joannenova.com.au/2015/03/what-stage-of-climate-grief-are-you-locked-in/
###################################################
Another Richard P. Feynman quote worth adding:
Most people don’t know that your quote is merely a restatement of another Feynman quote:
“Of course, warming has stopped even though emissions continue to increase and atmospheric carbon dioxide (CO2) continues to increase.”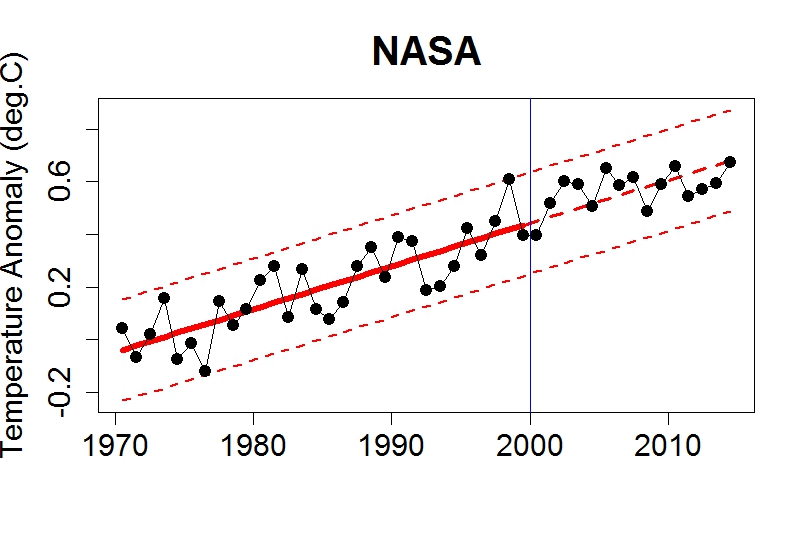
Has the warming stopped? Nope, global warming continues at a similar rate to 1970-2000 period
Tamino: “They just don’t seem to realize that the real embarrassment to their precious “pause” is the trend.”
https://tamino.wordpress.com/2015/01/20/its-the-trend-stupid-3/
Bevan,
That is rank, mindless cherry-picking. You select only those factoids that support your confirmation bias — as you reject the mountain of empirical evidence showing that global warming has stopped.
MMGW is your Religion, no more and no less. Science has nothing to do with it.
@dbstealey
“you reject the mountain of empirical evidence showing that global warming has stopped”
could you point me to this mountain of empirical evidence??
oh wait. there is none.
Here’s some simple empirical evidence that global warming has not stopped.
Below is a plot of trends calculated from RSS-TLT data set for all start years from 1979 through 2009 (black dots), with 95% confidence intervals on the trend estimates corrected for the effects of autocorrelation (black vertical bars). The red dashed line is the estimated trend for 1979-2009.
From a wise statistician: “Every one of the 95% confidence intervals, for every choice of start year, includes the first trend estimate. None of them provides statistically valid evidence that the warming rate in any of the start years is any different than it has been all along. Bottom line: from this analysis, there’s no valid evidence that the warming rate…has changed at all”.
https://tamino.wordpress.com/2014/12/04/a-pause-or-not-a-pause-that-is-the-question/
Bevan
You ask dbstealey
As a start, I suggest you look at the graph you presented.
It shows the rise you indicated from 1970 to 1997.
It shows no rise from 1997 to the present.
This concurs with the statement in the article which you dispute; viz.
And your cherry-pick is a small part of the ” mountain of empirical evidence showing that global warming has stopped”.
Global Average Temperature Anomally has not risen (or fallen) at a rate discernibly different from zero at 95% confidence for several years according to all its different compilations. The data compiled by Dr Ross McKitrick (of RSS) provides these values he has computed for the length of the period to present when global warming was not discernibly different from zero at 95% confidence for each data set.
SATELLITE INDICATIONS
UAH: No discernible warming since July 1996: i.e. for 16 years.
RSS: No discernible warming since December 1992: i.e. for 26 years.
SURFACE INDICATIONS
HadCRUT4.3: No discernible warming since May 1997: i.e. for 19 years
Hadsst3: No discernible warming since May 1995: i.e. for 21 years
GISS: No discernible warming since June 2000: i.e. for more than 14 years.
In conclusion, Bevan, I request that you please desist from your habit of posting nonsense which wastes space on threads.
Richard
Bevan
“Tamino” only posts stuff on his web site when he knows it is so wrong that he won’t put his real name to it and publish it formally.
Richard
@richardscourtney
“Global Average Temperature Anomaly has not risen (or fallen) at a rate discernibly different from zero at 95% confidence for several years according to all its different compilations.”
nor has the warming reduced to a rate discernibly different from its rate over the period 1979-2009, as the figure I posted above demonstrates. So you cannot argue on the basis of trends and their uncertainties in that global warming has stopped. and the statistics support that conclusion.
Didn’t Michael Mann just publish a paper saying that Tamino is cherrypicking timelines from the 60 year cycle in temperatures. Well, yes he did.
Temperatures go back to 1850. Why does Tamino start in 1970. Why did he specifically exclude the AMO or the 60 year cycle in temperatures from his analysis. Why did he use the faulty PMOD composite (which is known to be suffering from instrument degradation) for the solar cycle which produced a coefficient which is opposite to that known to be correct (Tamino just reversed the sign – I mean the guy writes textbooks about timeseries forecasting and he just went ahead and reversed a coefficient sign from his regression but left the independent variables the same. That is straight-up lack of integrity.)
1944 to 1970 – temps down -0.1C.
1970 to 2014 – temps up +0.6C
7 decades +0.5C of warming –> 0.07C per decade –> quite a bit lower than global warming’s predicted +0.22C per decade.
Bill, the cooling from the 40s to 1979 used to be far greater for both the entire NH, and for the globe.
At one point Hansen showed .6 degrees cooling; 1940ish high to 1979,
https://stevengoddard.wordpress.com/alterations-to-climate-data/
Bevan
March 8, 2015 at 11:53 pm
@dbstealey
“you reject the mountain of empirical evidence showing that global warming has stopped”
could you point me to this mountain of empirical evidence??
Well, we can start with the chart you posted.
It shows, quite clearly, that the warming trend since 1997 has been statistically flat.
Bevan
It would help if you were to read the information presented to you and did NOT misrepresent it by quoting part of it out of context.
I wrote
Your reply says in total
So, you cited ‘cherry-picked data’ and when more complete information was provided you misquoted it and pointed back to your cherry-pick.
Discernible global warming has stopped. Everybody who knows about the subject – including the IPCC – knows that discernible global warming has stopped. In reality, you also know discernible global warming has stopped but you run from this truth because it does not fit with what you want to believe.
Richard
To Bevan:
There are trends and there are trends. Here is January 2015 update
http://www.climate4you.com/images/HadCRUT4%20GlobalMonthlyTempSince1958%20VersusCO2.gif
@richard
“please desist from your habit of posting nonsense”
I must insist that this is not nonsense but very simple statistics.
Here are two examples:
The estimated trend for the 1997-2009 period is approximately 0.00±0.02C per year, meaning the estimated trend could be as high as +0.02C per year or as low as -0.02C per year.
For the period 2002-2009, the trend is approximately -0.1±0.04C per year, meaning the estimated trend could be as high as +0.03C per year or as low as -0.05C per year.
In both those examples, and as you and and Ross McKitrick correctly state, the warming rate since 1997 is not statistically distinguishable from zero i.e. the confidence intervals include the value zero. So we can’t say on the basis of those data whether it has warmed or cooled over the last 10-15 years or so. It would seem that their is a ‘pause’ in global warming.
However, by the same logic, every one of those confidence intervals, for every choice of start year, includes the first trend estimate (e.g. the warming rate over the period 1979-2009, +0.01C per year). None of them provides statistically valid evidence that the warming rate since any of the start years is any different than it has been all along.
”
Bevan
March 9, 2015 at 1:18 pm
Here are two examples:
The estimated trend for the 1997-2009 period is approximately 0.00±0.02C per year, meaning the estimated trend could be as high as +0.02C per year or as low as -0.02C per year.
For the period 2002-2009, the trend is approximately -0.1±0.04C per year, meaning the estimated trend could be as high as +0.03C per year or as low as -0.05C per year.
In both those examples, and as you and and Ross McKitrick correctly state, the warming rate since 1997 is not statistically distinguishable from zero i.e. the confidence intervals include the value zero. So we can’t say on the basis of those data whether it has warmed or cooled over the last 10-15 years or so. It would seem that their is a ‘pause’ in global warming.”
Uh, neither of your examples shows the last 10-15 years which would be 2000 to 2015 and, as many here have pointed out, we can’t say whether it has either cooled or warmed for almost 18 years now. Essentially, it has been statistically flat. Hence, the phrase “the warming has paused or stopped or halted” (whichever word one prefers).
It is good to see you accept that we are in a “pause”. Your next step is to notice that the pause does not match up with the projections/predictions of the climate models.
@JohnWho
“It is good to see you accept that we are in a “pause”.”
It is good to see you are ignoring the last paragraph that I posed:
by the same logic, every one of those confidence intervals, for every choice of start year, includes the first trend estimate (e.g. the warming rate over the period 1979-2009, +0.01C per year). None of them provides statistically valid evidence that the warming rate since any of the start years is any different than it has been all along.
How Bevan sees trends…
Brilliant!
Yes, does kind of put things in perspective, doesn’t it.
Top notch, Bevan. Evidence, physics, and statistics– the antidote for drinking one’s own bathwater.
I agree warrenlb, the bathwater Bevan has been drinking is extremely dirty and can only be cleansed with evidence, physics, and statistics.
But first, he must remove the blinders from his eyes so he can see how dirty the bathwater is.
No, I’m not referring to Bevan.
I’m talking about those who claim to be better scientists than those publishing in peer reviewed journals, yet never publish themselves; and when asked, claim peer review is corrupt.
Accusations of world-wide conspiracy, corruption, and constant excuse-making are their stock in trade.
@warrenlb:
Yes, ‘top notch’ if you like cherry-picking since the LIA.
But if you want to see if global warming is still happening, look here.
warrenlb says:
I’m talking about those who claim to be better scientists than those publishing in peer reviewed journals
Willis Eschenback has published. So has Richard Lindzen, Roy Spencer, Richard Courtney, Anthony Watts, and many others here. I doubt that any of them would agree with your MMGW Religion.
As far as who is a better scientist, all of them are superior to Michael Mann. If you would like to discuss Tiljander, Wegman, and many other of Mann’s debunked notions, just say the word.
That’s the security blanket that you cling to: peer review.
Well, if WUWT and the fifty other skeptic blogs have such an impact on science and opinion, where does that leave your “peer reviewed” climate science?
People don’t have much regard for the peer reviewed hype anymore.
The late warming trend will not resume for ten-twenty years, Bevan. The CO2 scare is a bust.
Tamino and Gavin Schmidt banned discussion of solar modulation of planetary temperature and the discussions of the anomalous solar magnetic cycle 24 changes on their blog sites. It is a physical fact that the sun is currently changing anomalously and it is a physical fact that past solar magnetic cycle changes correlate with past cyclic warming and cooling cycles in the paleo record. Solar changes modulate planetary temperature.
Schmidt’s comment: ‘Off message’.
I certainly agree with Schmidt’s comment: The assertion that the majority of the warming in the last 50 years was due to solar changes, not due to the increase in atmospheric CO2 is off the warmist’s message. P.S. Atmospheric CO2 levels will also anomalously drop. Salby is correct. The majority of the recent rise in atmospheric CO2 was not due to anthropogenic emissions.
Bevan,
Will there be a global warmist celebration if the planet anomalously cools and stays anomalously cold? Mission accomplished? I am truly curious. What will the warmist response be to unequivocal global cooling?
The transition from a ‘pause’ in global warming (i.e. no surface warming) to global cooling has started. Why is there suddenly starting in 2012, record sea ice in the Antarctic? Anyone notice the sudden recovery of Arctic sea ice and the sudden increase in snowfall on the Greenland ice sheet? You ain’t seen nothing yet.
Regards,
William
http://arctic.atmos.uiuc.edu/cryosphere/IMAGES/seaice.anomaly.antarctic.png
http://beta.dmi.dk/en/groenland/maalinger/greenland-ice-sheet-surface-mass-budget/
http://wattsupwiththat.files.wordpress.com/2012/09/davis-and-taylor-wuwt-submission.pdf
Davis and Taylor: “Does the current global warming signal reflect a natural cycle” (William: 342 cycles of warming in the Southern hemisphere, same periodicity as the warming in the Northern hemisphere, all of cycles of warming were followed by cooling when the solar magnetic cycle activity changed.)
The sun will be spotless sometime in 2015. Check out the solar large scale magnetic field strength. The strength of the solar large scale magnetic field correlates with the next solar cycle’s activity level. Maunder minimums last from 100 to 150 years. It appears this solar minimum is the special once in 8000 to 10,000 year solar change that causes Heinrich events and terminates interglacial period.
http://www.solen.info/solar/polarfields/polar.html
http://www.solen.info/solar/
http://iopscience.iop.org/1742-6596/440/1/012001
The peculiar solar cycle 24 – where do we stand?
“Anyone notice the sudden recovery of Arctic sea ice”
not me (2015 is the blue curve)
http://nsidc.org/data/seaice_index/images/daily_images/N_stddev_timeseries.png
I still can’t see the recovery of Arctic sea ice?
http://icons.wxug.com/hurricane/2015/nsidc_3.8.15.jpg
It’s GISS, which is basically made up out of whole cloth. HADCRUT4 shows stasis overall, and an actual decline in NH:
http://www.woodfortrees.org/plot/hadcrut4nh/from:1940
Bevan
You write
NO! Absolutely not!
Either you don’t understand the nonsense you are presenting or you are posting deliberate falsehood.
The pertinent facts are
1
The 16 years 1982 to 1998 exhibit a linear trend that is greater than zero (i.e. warming) at 95% confidence.
2.
The 16 years 1998 to 2014 exhibit no linear trend that differs from zero (i.e. no discernible warming or cooling) at 95% confidence.
Global warming discernible at 95% confidence has stopped.
Richard
Richard,
It’s not a falsehood, it is very basic undergraduate level statistics.
I’ll use the graph posted earlier to illustrate my point.
We have one trend estimate, for the period 1979-2009, which shows a warming of +0.012°C per year with 95% confidence intervals of ±0.006°C. The confidence intervals on that trend estimate do not overlap zero, therefore we can conclude that the warming trend over the period 1979-2009 is statistically different from zero at the 95% confidence level e.g. we have warming.
We then have a second set of trend estimates, for trends starting for any year since 1980 and ending in 2009. Some of these estimates show a positive trend, some which show no change and some that actually suggest a negative trend (e.g. 2002-2009 shows a negative trend of about -0.01°C per year).
Taking as an example the period 2000-2009, which shows a trend estimate of 0.0±0.02°C, the confidence intervals on that trend estimates do include the value zero (+0.02°C to -0.02°C), which, as you correctly state, shows warming is not statistically different from zero at 95% confidence interval.
However, those same confidence of +0.02°C to -0.02°C intervals also include the value of +0.012°C, which, as you seem unwilling to accept, shows that we cannot discount the possibility that the trend is not statistically different from +0.012°C per year e.g. we are not in a pause but still in a warming.
Bevan
I beg you to try not to be daft.
Your graph ends at 2005 not 2014.
I wrote
I wrote the truth and you have replied with nonsense.
For example, you say to me
That is a comment you have made on your graph of an unnamed data set which ends at 2005 so provides no information concerning “the period 2000-2009”.
I am discussing the data from Ross McKitrick which I presented above at here which considers a range of different data sets each for data up to the end of 2014.
My comments are true and correct according to all the data sets of global temperature anomaly.
Your comments are factually inaccurate assertions.
Have you been taking lessons in idiocy from warrenlb?
Richard
Friends
For the benefit of onlookers, I write to state why the most recent two consecutive periods of 16 years duration are important. The matter is important because it pertains to the performance of climate models.
As I said,
1.
The 16 years 1982 to 1998 exhibit a linear trend that is greater than zero (i.e. warming) at 95% confidence.
2.
The 16 years 1998 to 2014 exhibit no linear trend that differs from zero (i.e. no discernible warming or cooling) at 95% confidence.
In 2008 the US Government’s National Oceanic and Atmospheric Administration (NOAA) reported
Ref. NOAA, ‘The State of the Climate’, 2008
http://www1.ncdc.noaa.gov/pub/data/cmb/bams-sotc/climate-assessment-2008-lo-rez.pdf
There has been (at the 95% level) a zero trends for an interval of more than 15 yr; i.e. what the models “rule out” has happened.
Richard
“unnamed data set”
RSS TLT = Remote Sensing Systems Temperature Lower Troposphere (as used by Ross)
“which ends at 2005”
read the title of the x-label = “start years”, trends starting in 2005 and ending in 2009
so it does consider the period to 2009. all those trend start in the year labelled on the graph and end in the year 2009
My comments are true and correct according to the global temperature anomalies calculated from the RSS TLT data set.
Bevan
Your graph is here.
It has an x-axis labelled “start years” that runs from 1979 to 2005.
This clearly indicates that it ends in 2005.
You say
Well, assuming the graph is mislabeled as you claim, then the graph still does not pertain to the most recent 16 year period (i.e. 1998 to 2014).
I again beg you to try not to be daft. Your quibbles are only making you look foolish.
Accept reality; i.e.
The pertinent facts are
1.
The 16 years 1982 to 1998 exhibit a linear trend that is greater than zero (i.e. warming) at 95% confidence.
2.
The 16 years 1998 to 2014 exhibit no linear trend that differs from zero (i.e. no discernible warming or cooling) at 95% confidence.
Global warming discernible at 95% confidence has stopped.
Richard
@richardscourtney
“Global Average Temperature Anomaly has not risen (or fallen) at a rate discernibly different from zero at 95% confidence for several years according to all its different compilations.”
nor has the warming reduced to a rate discernibly different from its rate over the period 1979-2009, as the figure I posted above demonstrates. So you cannot argue on the basis of trends and their uncertainties in that global warming has stopped. and the statistics support that conclusion.
sorry mods, managed to double post that reply 🙂
No worries Bevan, your post is wrong both times!
Read richardscourtney on March 9, 2015 at 12:11 am above.
The chart you so strongly champion clearly shows that there has been a “statistically flat” trend since 1997.
You do demonstrate the absurdity of the CAGW meme, however, so thank you for that.
Dear Lord! I forgot to include that you should also cancel your electric service to your home. You don’t need lights or a refrigerator nor anything else run by electricity. The use of those things causes CO2 because either gas or coal is burned to generate electricity
@JohnWho
I take it you are not a statistician then?
The estimated trend for the 1997-2009 period is approximately 0.00±0.02C per year, meaning the estimated trend could be as high as +0.02C per year or as low as -0.02C per year.
as richardscourtney and Ross McKitrick correctly state, the warming rate since 1997 is not statistically distinguishable from zero i.e. the confidence intervals include the value zero. So we can’t say on the basis of those data whether it has warmed or cooled over the last 10-15 years or so. It would seem that their is a ‘pause’ in global warming.
However, every one of those confidence intervals, for every choice of start year, includes the first trend estimate (e.g. the warming rate over the period 1979-2009, +0.01C per year). None of them provides statistically valid evidence that the warming rate since any of the start years is any different than it has been all along.
Bevan, Here’s what you do. If you are so committed to the reduction of CO2 and the deadly effects of its existence and production through the use of fossil fuels, I suggest you do this. Donate your car to a local charity, rip out your gas or electric stove and donate it. Rip out the HVAC unit in your house. You dont need these things because they create CO2. Buy yourself a bicycle (God forbid CO2 was created to manufacture it too) and ride yourself around where ever it is you need to go. You should also plant a garden outside and feed yourself because the grocery store needs energy to preserve the food you can get there and the farmer needs diesel to plant and harvest the food that goes to the grocery store, but never mind all these conveniences because you are committed to creating a ZERO carbon footprint.
Then after you’ve done all these things we might take you seriously. If you do these things then maybe we can convince a lot of other people to do the same because you took the first step in leading to a lower CO2 atmosphere.
They’re not actually 95% confidence intervals. They are statistical chicanery. Gobbledygook based on an inapplicable statistical model. The data are not well represented by a trend line, but by a trend line plus a cyclical function with a repeating period of ~60 years.
When you use that functional basis, not only do you get a much better fit, with much tighter residual error, but you find that the trend and ~60 year cycle have been in evidence for well over 100 years, long before humans could have produced them in any way, shape, or form.
Bevan
I replied to your first posting of your double post. My reply is here.
Richard
re shale, to be fair, maybe this should also be noted:
6 March: Houston Chronicle: Trey Murphy: Reality bites in the Eagle Ford region
(Trey Murphy is a graduate student and researcher in the Texas A&M Geography Department, who is conducting an investigation of the Eagle Ford Shale business climate)
The number of businesses in the area is also going to shrink. Many of the smaller and newly established oil and gas companies have assumed considerable debt to drill wells. With oil prices close to half of their June high, smaller companies are overleveraged and will either have to declare bankruptcy or be absorbed by larger firms. If oil prices stay near the $40-60 level for the next six months, there will be a major consolidation of the Eagle Ford oil and gas business community and a concurrent reduction in the demand for oil-field employment. Given the $87.7 billion local economic impact that’s been estimated by the University of Texas at San Antonio Institute for Economic Development, that’s a potentially sizeable compression of business activity.
Fewer workers and drilling companies will inherently lead to decreased municipal tax receipts, lower demand for city services and less oil flowing through county-taxable pipelines. Based on my conversations with officials across the Eagle Ford, there has been little acknowledgment of this. The alarm needs to be sounded now: Cities across the region need to be aware that the resource roller coaster has crested and should prepare by building emergency cash reserves and working to capture (i.e. house) the DIDO personnel and their families. When I drove through the Eagle Ford last summer to start my research, I was astounded by the number of flares illuminating the night, 18-wheelers choking county roads and restaurants at capacity. Yet with every return, I see fewer flares, emptier cafes and cheaper hotel rooms. Is this a sign of permanent change? I hope not….
http://www.chron.com/opinion/outlook/article/Reality-bites-in-the-Eagle-Ford-region-6119815.php
Excellent interview with former MI6 agent on ISIS , Turkey and new Russian/Chinese financial system:
http://www.todayszaman.com/monday-talk_turkey-might-become-hostage-to-isil-just-like-pakistan-did_371465.html
“There is a huge move of capital out of emerging markets and out of Middle Eastern states whose currencies consequently have been adversely affected. For the first time, too, we see the end of the petro-dollar as a system for recirculating oil revenues to Wall Street.
For the first time, it has turned negative: It is sucking liquidity out from Wall Street, not putting it in. The fall in the price of oil has suddenly created huge financial turbulence, which is endangering the global financial system.”
“Saudi Arabia has enough reserves to last at least two years at this lower oil price.”
Why did the banks need to repeal Dodd-Frank and the Volcker Rule to get taxpayer backing for their losses again? One need not look beyond the oil derivatives…
http://armstrongeconomics.com/2014/12/22/derivatives-market-280-trillion-is-it-really-a-time-bomb/
Wall St is also looking at trillions of dollars in oil derivative losses, just saying, watch your funds even though they now appear backed away from bail-in. Quoting Martin Armstrong- You can move your money to a local regional bank, but this may still not protect you if the wild and crazy NY trading banks blow up as they have always done for each crisis.
In the good old days BEFORE 1985, banks had to get your permission to sell your funds overnight into repo. They still must get that client approval in London – but not USA. Legally they should disclose that fact, but this is the part of the real legal status of a bank account. You deposit what you think is your money. However, legally you simply now become an UNSECURED creditor the same as a common share holder. It ain’t your money any more ! That’s why they created FDIC to start with. This is why lawyers look at this structure and skip over the FDIC problem and say hell – we are not legally obligated to bail out depositors of bankers. This is the collapse in Socialism – it is all the promises that they cannot possibly keep.
It is YOUR BURDEN to investigate the bank and what type of business they derive their profits from. Those that derive profits from trading – walk away while you still can.
I recommend Paul Craig Roberts and Martin Armstrong’s blogs and interviews if you need to get up to speed.
Sanctions Boomerang…
China-Russia partnership mature & stable, not targeting ‘third parties’
http://rt.com/news/238857-china-russia-mature-partnership/
Chinese President Xi Jinping and his Russian counterpart Vladimir Putin met five times last year and have a close personal relationship.
Additionally, Russia and China were instrumental last year in establishing $100 billion BRICS bank that is to serve as a pool of money for infrastructure projects in Russia, Brazil, India, China and South Africa, and will challenge the dominance of the Western-led World Bank and the IMF.
Moscow and Beijing have been boosting cooperation in various fields, including the energy and financial sectors. Most recently, the two countries decided to create a joint rating agency that’ll counter balance the existing Western ‘Big Three’ of S&P, Moody’s and Fitch.
Meanwhile the decision to switch to local currencies in trading settlements has become a major move towards reducing dependence on the US dollar and creates an alternative within the global financial system.
Russia’s Remarkable Renaissance
http://journal-neo.org/2015/03/09/russia-s-remarkable-renaissance-2/
China Blows Kisses to India
http://journal-neo.org/2015/03/05/now-china-blows-kisses-to-india/
In all the back and forth over mere tenths of a degree of “warming” or “not warming” I always wonder how anyone can possibly think that we can really measure “the average temperature of the whole planet” to a tenth of a degree. Heck, sometimes there are claims of a “record year or month” set by a hundredths of a degree!
As I sit here getting ready to go to work, I see that the temperatures being reported for just my city vary up to 3 degrees at stations around the city. Which one is the real temperature? Does anyone really measured the average temperature of Orlando, Florida to a tenth of a degree? Can anyone tell me why they think the highly adjusted, infilled, homogenized, modified, fiddled-with data sets are the gospel truth to a tenth of a degree???
Quite so.
Professor Richard Linzden, 2011
Professor Richard Linzden on Fox News 3 days ago
http://www.climatedepot.com/2015/03/06/watch-mits-dr-richard-lindzen-on-fox-news-we-are-demonizing-a-chemical-a-molecule-essential-to-life-co2/
Bevan
Re: the chart and explanatory paragraph posted earlier , taken from the tamino link that you provided.
Why would I be wrong in drawing the (admittedly simple minded ) conclusion, from just looking at the data points, that since 1997 the warming rate has been negative, ie cooling?
Hi mikewaite,
so the trend estimates (circles) since about 1997 do show a cooling but when we include the confidence intervals on the trend (i.e. the likely uncertainties), shown by the vertical bars, these overlap a trend estimate of zero.
This means it is not possible on the basis of the trends calculated since about 1997 to conclude that it has been cooling, or indeed warming, since 1997.
Here are two examples:
The estimated trend for the 1997-2009 period is approximately 0.00±0.02C per year, meaning the estimated trend could be as high as +0.02C per year or as low as -0.02C per year.
For the period 2002-2009, the trend is approximately -0.1±0.04C per year, meaning the estimated trend could be as high as +0.03C per year or as low as -0.05C per year.
In both those examples, and as richardscourtney and Ross McKitrick correctly state, the warming rate since 1997 is not statistically distinguishable from zero i.e. the confidence intervals include the value zero. So we can’t say on the basis of those data whether it has warmed or cooled over the last 10-15 years or so. It would seem that their is a ‘pause’ in global warming.
However, by the same logic, every one of those confidence intervals, for every choice of start year, includes the first trend estimate (e.g. the warming rate over the period 1979-2009, +0.01C per year). None of them provides statistically valid evidence that the warming rate since any of the start years is any different than it has been all along.
does that help answer your question?
Bevan , thank you for the examples , it did make the tamino link and the comments of others more comprehensible.
Bevan, what happens to the confidence intervals when the years 2010-2014 are included?
mikewaite
It seems you may be being misled by the nonsense posted by Bevan.
I repeat my response to that nonsense which is here.
The pertinent facts are
1.
The 16 years 1982 to 1998 exhibit a linear trend that is greater than zero (i.e. warming) at 95% confidence.
2.
The 16 years 1998 to 2014 exhibit no linear trend that differs from zero (i.e. no discernible warming or cooling) at 95% confidence.
Global warming discernible at 95% confidence has stopped.
And I add that the rise in atmospheric CO2 concentration has not stopped.
Richard
Richard,
It’s not a falsehood, it is very basic undergraduate level statistics.
I’ll use the graph posted earlier to illustrate my point.
We have one trend estimate, for the period 1979-2009, which shows a warming of +0.012°C per year with 95% confidence intervals of ±0.006°C. The confidence intervals on that trend estimate do not overlap zero, therefore we can conclude that the warming trend over the period 1979-2009 is statistically different from zero at the 95% confidence level e.g. we have warming.
We then have a second set of trend estimates, for trends starting for any year since 1980 and ending in 2009. Some of these estimates show a positive trend, some which show no change and some that actually suggest a negative trend (e.g. 2002-2009 shows a negative trend of about -0.01°C per year).
Taking as an example the period 2000-2009, which shows a trend estimate of 0.0±0.02°C, the confidence intervals on that trend estimates do include the value zero (+0.02°C to -0.02°C), which, as you correctly state, shows warming is not statistically different from zero at 95% confidence interval.
However, those same confidence of +0.02°C to -0.02°C intervals also include the value of +0.012°C, which, as you seem unwilling to accept, shows that we cannot discount the possibility that the trend is not statistically different from +0.012°C per year e.g. we are not in a pause but still in a warming.
Bevan.
You really do like straight lines projections, don’t you? The world, unlike your freshmen physics classroom, does not – and has never – followed straight line projections from anywhere to anywhere else at any time.
This is 2015 – data is available for 2009, 2010, 2011, 2012, 2013, 2014, and parts of 2015.
This is 2015. Data is available for lots of things earlier than the single limited period in all of physics of 1976 – 1996 when both CO2 and global average surface temperature both rose at the same time.
@RACookPE1978
congratulations. that adds nothing to the debate that is going on here.
Bevan
It is a falsehood. In this thread I and others have repeatedly explained to you that it is a falsehood but you ignore all rebuttals and repeat the falsehood.
I link to one of my above responses to one of your previous presentations of that daft graph in this thread.
You do not convert your falsehood into truth by use of repetition.
Richard
Assertions and Creditable Evidence: While assertions are certainly made with little to no evidence, innuendo doesn’t even require assertions.
One classic innuendo tool is the question mark. With a “?” we can have headlines such as:
~ Is the US hiding evidence of UFOs?
~ Is global warming increasing mid-east conflicts?
~ Are climate skeptics paid by big oil?
~ Does Romney hate poor people?
The above are questions, not assertions but clearly imply what the question is asking.
Innuendo works famously in framing public opinion.
Someone once told me that if a newspaper headline was presented as a question ending with a question mark, then the answer was NO!
Betteridge’s law of headlines
http://en.wikipedia.org/wiki/Betteridge%27s_law_of_headlines
Phony socialists love poor people – the more the better !!
… if by ‘love’ you mean ‘use’ …
Reblogged this on "Mothers Against Wind Turbines™" Phoenix Rising… and commented:
Corruption & Collusion in the Climate Scam Crowd!
Is this a good place to post a letter I’ve just sent to the BBC about their recent HORIZON programme? S’pose so
9 March 2015
BBC Complaints (attn. the HORIZON production team)
Dear Sirs or Madams
CLIMATE CHANGE – A HORIZON GUIDE
Naughty Naughty Naughty! To get poor old Dickie Attenborough to risk his reputation by fronting up that self-referential and dimensionless graph! Did he know that the ‘global warming’ illustrated was about half a degree C per century? Hardly a catastrophe. To Hind-cast a model to fit observations, including an unproved CO2 contribution, and then remove your CO2 assumption to prove its effect, is circular.
Why was there no mention anywhere in the programme of the 18+ years of zero warming to date, accompanied by an increase in CO2 and unpredicted by the ‘models’. Why has ‘global warming’ become ‘climate change’?
Sir Dickie was made to say that Antarctic ice is diminishing. It’s increasing. A lie by omission. I’m afraid.
Your lovely presenter, Dr Helen Czerski, correctly pointed up the difficulties with modelling clouds – they remain a dominant uncertainty. Your programme did not mention the more influential greenhouse effect of water vapour, presumably because it’s not ‘man-made’.
You were good enough to screen a piece about the ‘sceptics’ at their conference and to mention that some of them were ‘scientists’. Your treatment, with time-lapse photography, generated an air of eccentricity. Viscount Monckton (“Good Heavens! A Lord! What does he know about science?”) was given a short piece to camera, talking about ‘urbanisation’ and ‘urban heat islands’ distorting temperature records. (“Quick! Quick! Snip him off – he has a cogent sceptics’ point which we can’t discuss here”)
Your treatment of the ‘climategate’ scandal was frankly dishonest. The argument was not about the splicing of two different types of record to produce a ‘hockey stick’ (a methodology since rejected by the IPCC, by the way). Of course the scientists involved were ‘exonerated’ of dishonesty by their peer group and adjured to be more open about their methods, but you did not mention the many exchanges of emails discussing how unwelcome climate trend data were to be kept from the public. THAT was ‘climategate’.
‘The science is settled’ Not so – your programme gave the impression that the ‘sceptics’ were in retreat. Of the many ‘sceptical’ websites I’ll only draw your attention to http://www.petition.project.org which features 31,000 sceptical American scientists. That neither you nor Helen have checked out this website is a dereliction.
Briefly:
Greenland ice cores show climate variability – we are emerging from the Little Ice Age and the planet has been warmer than now in the recent past.
Sea level rise averages at 7 inches per century and the rate does not alter with increase in CO2
Glacier melting began about 1850 and the rate has not altered with the increase in CO2
There is no increase in the frequency or violence of Atlantic tropical storms nor of tornadoes
American rainfall is increasing at 1.8 inches per century.
The increase in CO2 has been enormously beneficial to the biosphere. (See the oped piece in today’s Times newspaper)
And so on and so forth.
As a sometime chief of naval information and public affairs director of the British chemical industry’s trade association, I’m very familiar with journalistic tricks on Television. Given the above, your alarmist weather material– opening the programme with a roof blowing off into a rainy street and all that iceberg calving etc – was frankly dishonest.
Finally, the lovely Helen asked what we should do about it. I know. Let’s deprive the emerging nations of hydrocarbons and keep them in poverty.
Very best wishes
The CAGW are pushing to the limits of their credibility : selective data tampering plus selecting to only investigate the financial arrangements of critics (rather than everyone) is conspiracy. If the public get wind of this they are toast
Unfortunately, the public follows the fashion of the day. Fortunately, fashions change.
YES – The CAGW propaganda has been very successful and popular, and tehy have swallowed the idea that some people are d….ers, but this combination of cheating the data and at the same time knobbling the whistle blowers is toxic. Whistle-blowers are popular and tampering with data begs the question why? The combination treats everyone as if they are also suspect d…ers. This puts the fanatics on teh other side of the fence from the general public, they could get a backlash.
“Suppressing Scientific Inquiry – The Witch Hunt”
brought to you by the Democratic Party of the United States of America.
The east coast cold spell is over now, but too bad somebody did not turn off the heat to Raul Grijalva Ed Markey’s office, two can play this game.
My most extreme cAGW friend routinely uses the tobacco company / petroleum company comparison.
Yet he smokes cigarettes, and his favorite pass time is traveling.
I have never ever gotten him to see the … umm … hypocrisy.
Before I get a half sentence into pointing out his inconsistency, I am accused of being under the sway of the Heartless Institute.
More news is the record low Arctic sea ice extent for late winter.
http://icons.wxug.com/hurricane/2015/ijis_extent.jpg
And the North Atlantic Oscillation off the charts
http://icons.wxug.com/hurricane/2015/noaa_ao_3.9.15.jpg
Full story here: http://www.wunderground.com/blog/JeffMasters/comment.html?entrynum=2929
No, Barry.
The real news is that the Antarctic sea ice is continuing to steadily expand. Remember, the Antarctic sea ice – over the entire year – reflects 68% MORE solar energy than the Arctic absorbs over the same 12 month period. Worse, the more the Arctic sea ice retreats from today’s levels, the more energy is lost to evaporation, convection, conduction, and LW radiation. The more the Antarctic sea ice expands, the more energy is lost immediately as SW energy is reflected back into space.
Well, naturally… All the cold air was right here in the lower 48, courtesy of meridionial circulation.
Ahhh, might be something to that, as it appears that the NW section of the continent had less ice than Canada , Siberia, U.S. during the last ice age (see Alaska area on maps below) and it appears that the Northern hemisphere was affected more than the Southern. This would make sense if the meridional circulation was carrying warmer air from the equator to the arctic and then being recirculated over the Northern continents as snow.
http://www.vukcevic.talktalk.net/NFC.htm
http://www.qpg.geog.cam.ac.uk/lgmextent.html
Your graphs are presented with intent to deceive.
http://arctic-roos.org/observations/satellite-data/sea-ice/observation_images/ssmi1_ice_ext.png
http://psc.apl.washington.edu/wordpress/wp-content/uploads/schweiger/ice_volume/BPIOMASIceVolumeAnomalyCurrentV2.1.png
http://www.cpc.ncep.noaa.gov/products/precip/CWlink/pna/nao.timeseries.gif
your second graph is a model, not observations.
“A closer look at Arctic sea ice extent for each year since 2007”
http://icons.wxug.com/hurricane/2015/nsidc_3.8.15.jpg
You don’t like models? What, then, are you basing your opinions on?
Dueling sources. The fact is, you’re trending noise. Arctic sea ice is not collapsing. It is pretty much steady with the onset of steady temperatures.
Nobody is arguing that the Earth hasn’t warmed. It’s been warming since the exit from the LIA. The question is attribution. The fact that the same steady trend plus the ~60 year cyclic contribution have been in evidence for well over a century establishes that these terms are not due to human forcing.
When you take those out, there’s not much left to attribute to humans even in the worst case.
The discovery of the hominid jawbone was in the Afar region, one of the hottest, inhabited regions on the planet Here is another hominid location in Kenya. It’s been a hot region for the past 4 million years, during hominid evolution.
2C global warming will be welcomed and I think we just might be able to cope.
Good news for those who want there to be record sea ice in the Arctic. There very recently has (2013 and 2014) been a drop in summer temperatures (coldest high Arctic summer temperatures on record) in high latitude temperatures both hemispheres which is the physical reason for the sudden increase in multiyear ice in the Arctic and the record sea ice in the Antarctic.
http://ocean.dmi.dk/arctic/meant80n.uk.php
https://stevengoddard.wordpress.com/2015/03/09/a-return-to-2006-arctic-ice-conditions/
The sudden increase in high latitude planetary cloud cover is to be expected due to the increase in galactic cosmic rays (GCR also called cosmic ray flux CRF, GCR/CRF are mostly high speed protons, GCR is the currently the highest ever recorded during a solar magnetic cycle maximum).
http://cosmicrays.oulu.fi/webform/query.cgi?startday=17&startmonth=07&startyear=1964&starttime=00%3A00&endday=17&endmonth=08&endyear=2014&endtime=00%3A00&resolution=Automatic+choice&picture=on
High latitude and tropical region clouds are also modulated by solar wind bursts, in addition to GCR/CRF. Solar wind bursts create a space charge differential in the ionosphere which removes cloud forming ions in high latitude regions and changes the cloud properties and cloud lifetimes in the tropics, by a mechanism that is called electroscavenging. The return path for the global current caused by solar wind bursts is the ocean. Solar wind bursts are the primary cause of the El Niño (more solar wind bursts) and La Niña events (less solar wind bursts).
The solar wind bursts are primarily caused by coronal holes on the sun, not sunspots. One of the confusions in solving how the sun causes the planet to cyclically warm and cool is coronal holes have appear anomalously on the surface of the sun in low latitude positions, late in the solar cycle.
Peculiarly during the anomalous solar cycle 24 the density of the solar heliosphere (Solar heliosphere is the name for the tenuous gas and pieces of magnetic flux that is throw off of the sun. Solar heliosphere extends well past the orbit of Pluto. The solar heliosphere blocks and deflects the high speed mostly cosmic protons which are called GCR or CRF. GCR/CRF are the principal cause of ion formation in the atmosphere. The amount of ions in the atmosphere affects cloud formation, cloud albedo, drop size, and cloud lifetimes all of which affect planetary temperature.
This paper explains the mechanisms.
http://gacc.nifc.gov/sacc/predictive/SOLAR_WEATHER-CLIMATE_STUDIES/GEC-Solar%20Effects%20on%20Global%20Electric%20Circuit%20on%20clouds%20and%20climate%20Tinsley%202007.pdf
This paper notes planetary temperature changes correlate with the magnitude and number of solar wind bursts (the affect lasts 5 to 10 days).
http://sait.oat.ts.astro.it/MmSAI/76/PDF/969.pdf
Recently the solar heliosphere density has reduced 40%. Due to the reduction in the density solar heliosphere the rise time of solar wind bursts is reduced. This anomalous change was discussed at during the 2013 AGU meeting and is discussed in this paper.
http://arxiv.org/abs/1404.0252