By Joseph D’Aleo, CCM, AMS Fellow
The arctic ice appears to have bottomed out at a level 6.4% higher than the 2007 record. Mark Serreze of the National Snow and Ice Data Center says the Arctic could be ice-free in the summer by about 2030, though that is hard to predict; other scientists say it could be mid-century before that dramatic point is reached. The article continues Why does this matter? Ice that’s floating on the sea surface doesn’t raise the sea level when it melts. But researchers suspect it will alter the weather that reaches us far to the south. It’s already affecting Arctic wildlife.
Thousands of walruses that usually float around on sea ice and dive down to feed on the ocean floor abandoned those floes when the only ice left off the coast of Alaska was over water that was too deep. Walruses spend 2/3rds of their time in water and like the polar bear the talk of their demise will likely be proven wrong. Polar bear populations are at record highs. Here is today’s ice plot versus 2007.

The temperatures in the arctic have indeed risen in recent years and ice has declined, bottoming out in 2007 but it is not unprecedented nor unexpected. The arctic temperatures and arctic ice extent varies in a very predictable 60-70 year cycle that relates to ocean cycles which are likely driven by solar changes. It has nothing to do with CO2, showing poor correlation and since cold open arctic ice is a significant sink for atmospheric CO2 just as warm tropical waters are the primary source.
In 2007, NASA scientists reported that after years of research, their team had assembled data showing that normal, decade-long changes in Arctic Ocean currents driven by a circulation known as the Arctic Oscillation was largely responsible for the major Arctic climate shifts observed over the past several years. These periodic reversals in the ocean currents move warmer and cooler water around to new places, greatly affecting the climate. The AO was at a record low level last winter explaining the record cold and snow in middle latitudes. A strongly negative AO pushes the coldest air well south while temperatures in the polar regions are warmer than normal under blocking high pressure. See post here.
We agree. And indeed both oceans play a role. In the record-setting (since satellite monitoring began in 1979) summer melt season of 2007, NSIDC itself before funding opportunist Serreze took over editorial control, noted the importance of both oceans in the arctic ice.
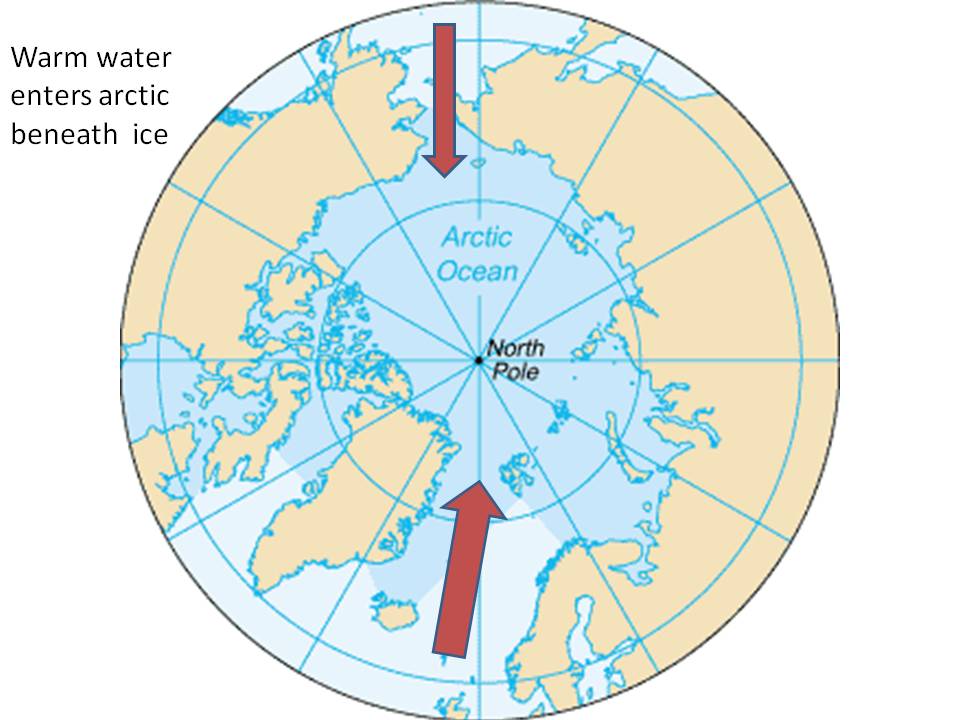
“One prominent researcher, Igor Polyakov at the University of Fairbanks, Alaska, points out that pulses of unusually warm water have been entering the Arctic Ocean from the Atlantic, which several years later are seen in the ocean north of Siberia. These pulses of water are helping to heat the upper Arctic Ocean, contributing to summer ice melt and helping to reduce winter ice growth.
Another scientist, Koji Shimada of the Japan Agency for Marine-Earth Science and Technology, reports evidence of changes in ocean circulation in the Pacific side of the Arctic Ocean. Through a complex interaction with declining sea ice, warm water entering the Arctic Ocean through Bering Strait in summer is being shunted from the Alaskan coast into the Arctic Ocean, where it fosters further ice loss. Many questions still remain to be answered, but these changes in ocean circulation may be important keys for understanding the observed loss of Arctic sea ice.”

Enlarged here.
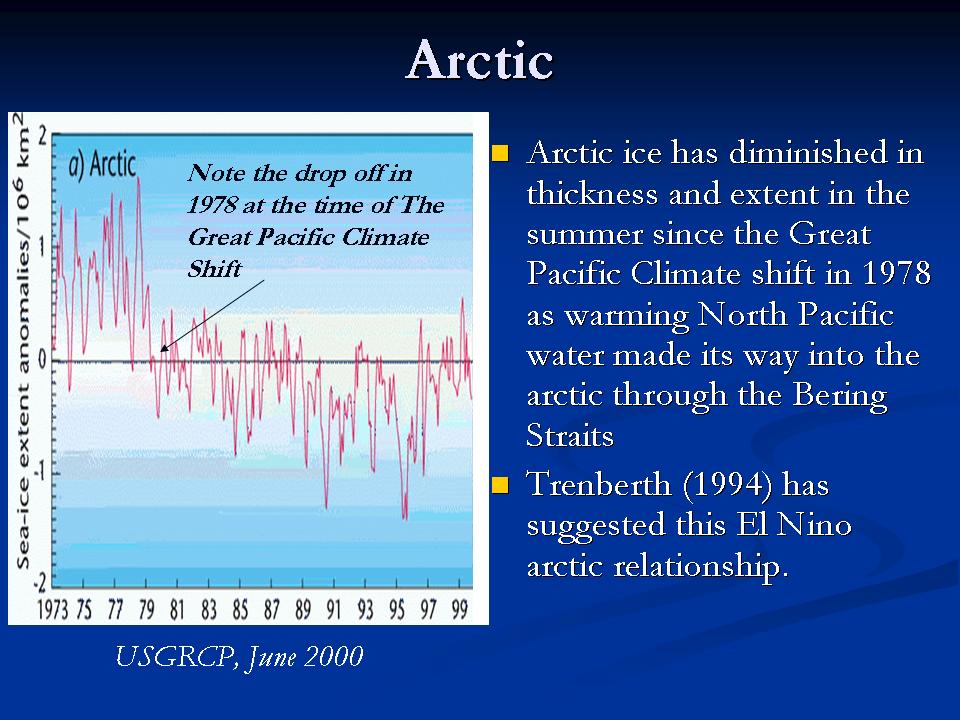
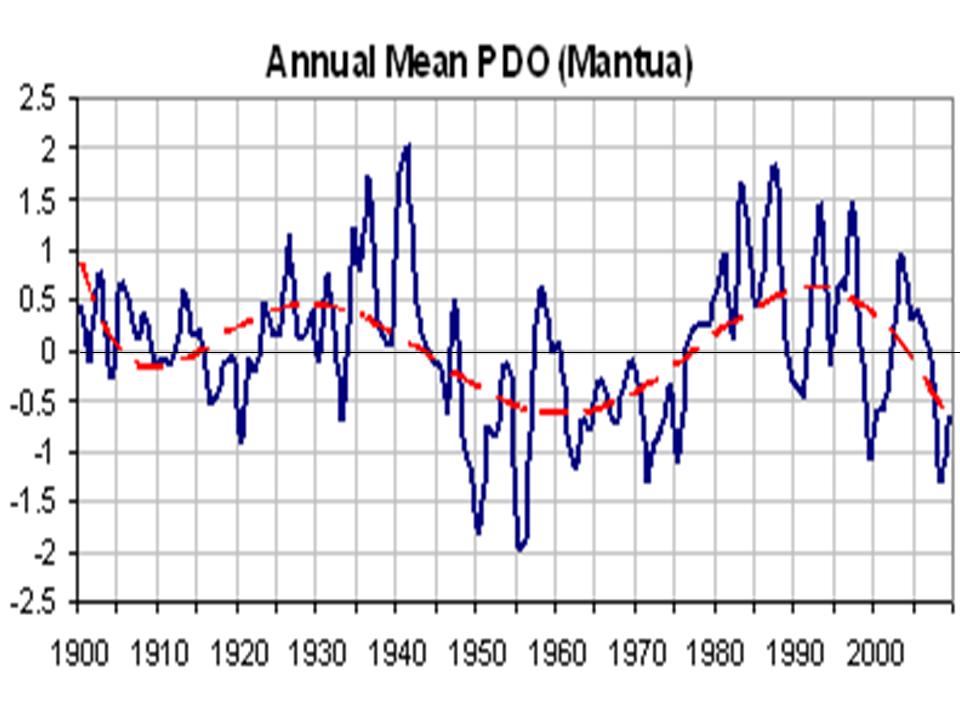
The Pacific warm mode favors more El Ninos and warmer water in the far northern Pacific including the Bering Straits. The PDO flipped into its warm mode in 1978 and the arctic temperatures began to warm and ice began to melt.

Enlarged here.

Enlarged here.
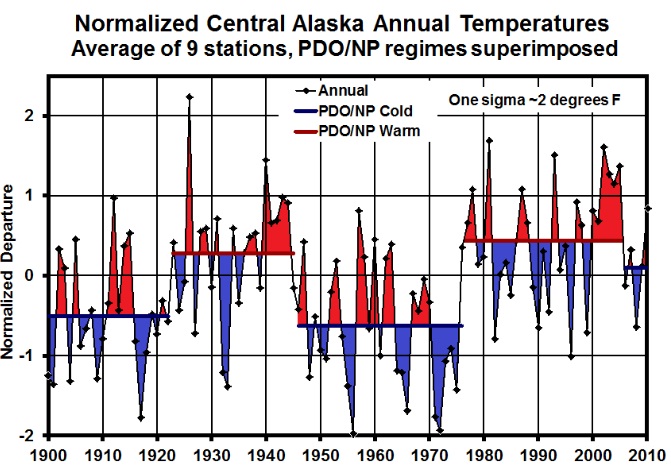
Notice how the temperatures in Alaska go through step changes tied to the PDO (Keen).

Enlarged here.
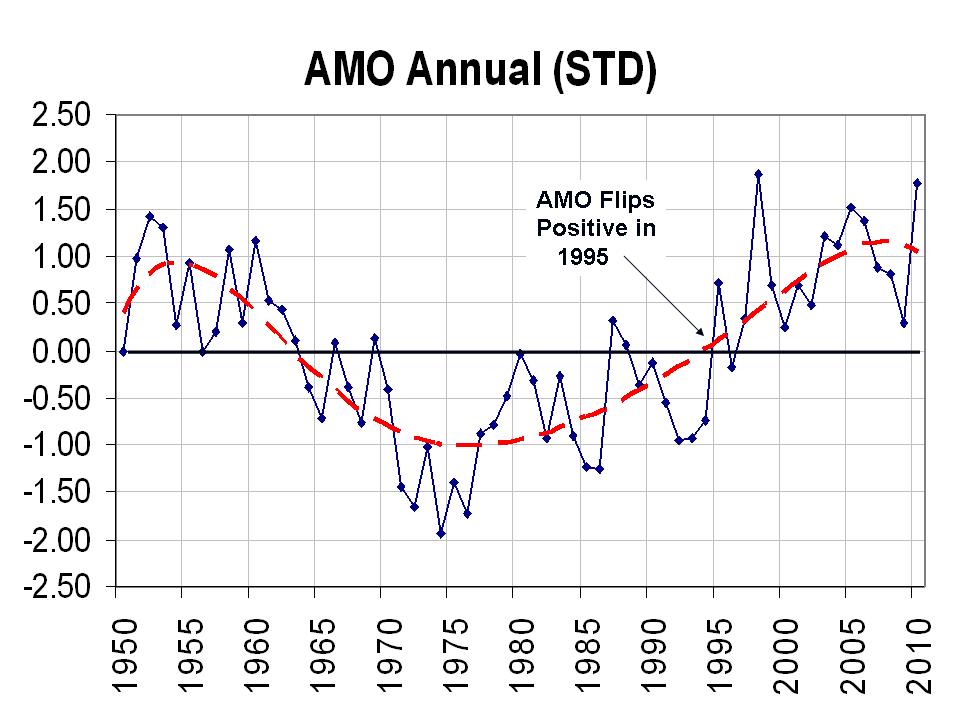
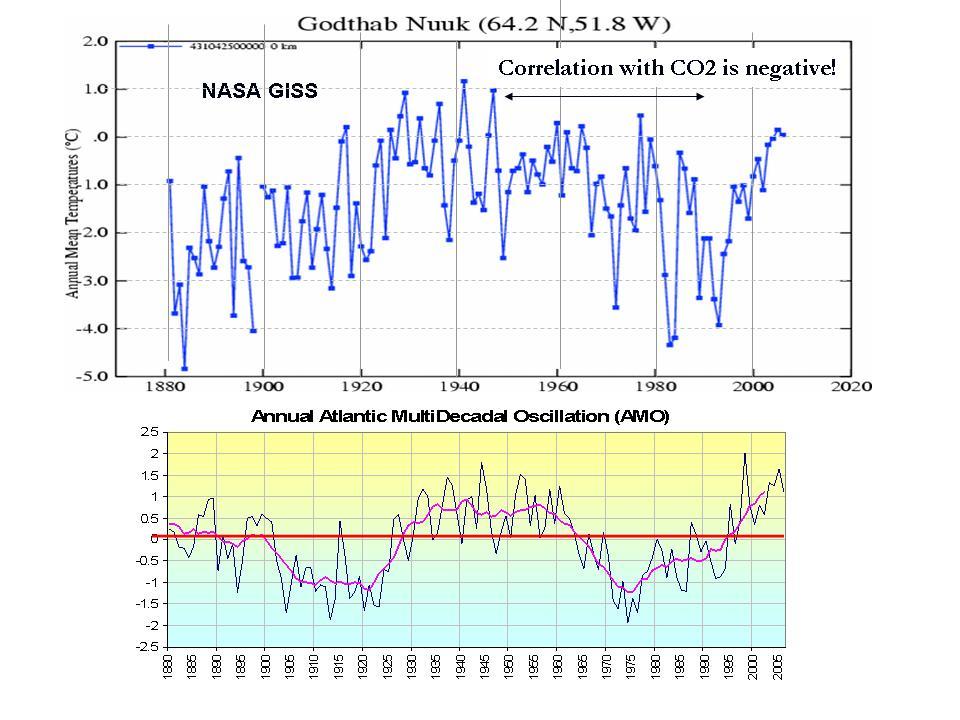
The Atlantic also cycles on a 60-70 year period. The Atlantic Multidecadal Oscillation or AMO returned to the positive warm mode in 1995.

Enlarged here.
Frances et al. (GRL 2007) showed how the warming in the arctic and the melting ice was related to warm water (+3C) in the Barents Sea moving slowly into the Siberian arctic and melting the ice. She also noted the positive feedback of changed “albedo” due to open water then further enhances the warming.
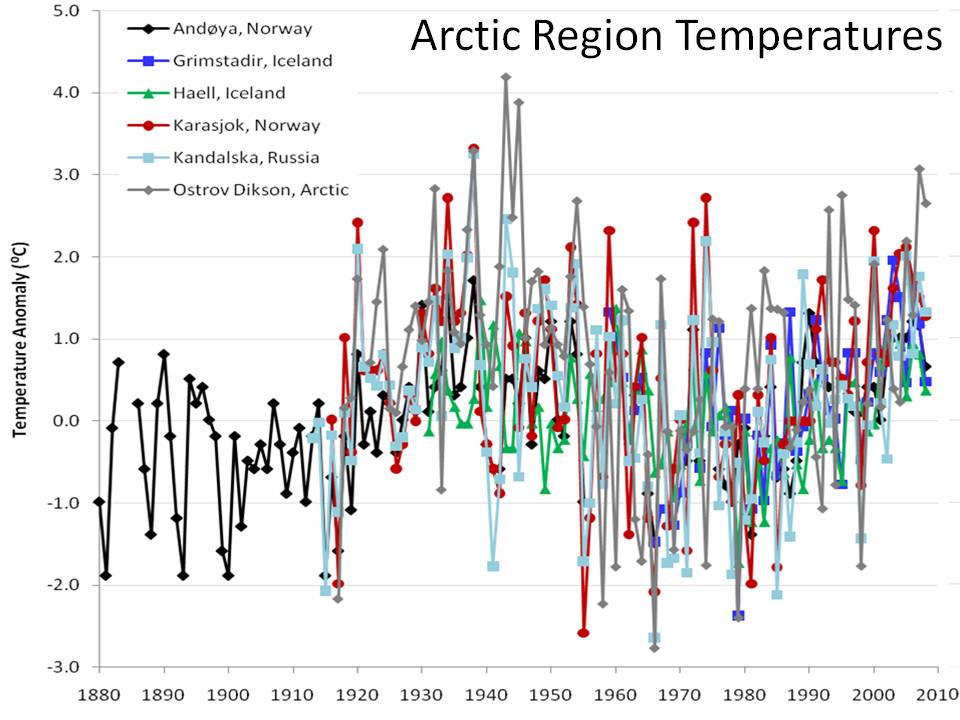
The International Arctic Research Center at the University of Alaska, Fairbanks showed how arctic temperatures have cycled with intrusions of Atlantic water – cold and warm.

Enlarged here.
The correlation was also confirmed by Juraj Vanovcan.

Enlarged here.
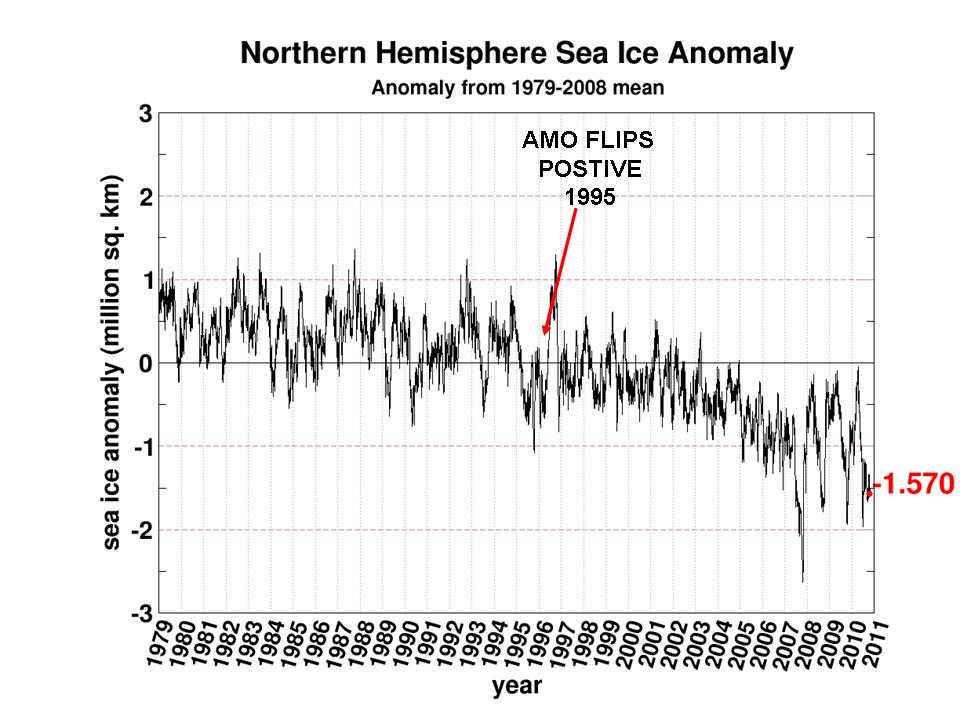
See how quickly the arctic ice reacts to warming of the Atlantic sea surface temperatures in 1995 (source Cryosphere Today). This marked a second leg down. We have seen large swings after the big dip in 2007 following a peak in Atlantic warmth in 2004-2005.

Enlarged here.
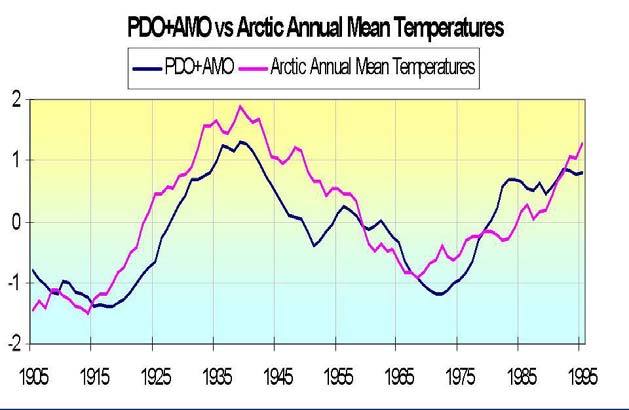
Although the PDO and AMO are measured differently, both reflect a tri-pole of ocean temperatures. Both have warm north and tropics and cool relative to normal in between in the positive phase and cold north and tropics and warm in between in the negative phase. By normalizing the two data sets and then adding the two, you get a measure of net warmth or cooling potential for both global and arctic temperatures. See how well the sum tracks with the arctic temperatures. Though we don’t have measurements of ice extent, there are many stories and anecdotal evidence that arctic ice was in a major decline from the 1920s to 1940s.

Enlarged here.
At the edge of the arctic Greenland behaves in the same way – with warming and cooling tied to the AMO.

Enlarged here.
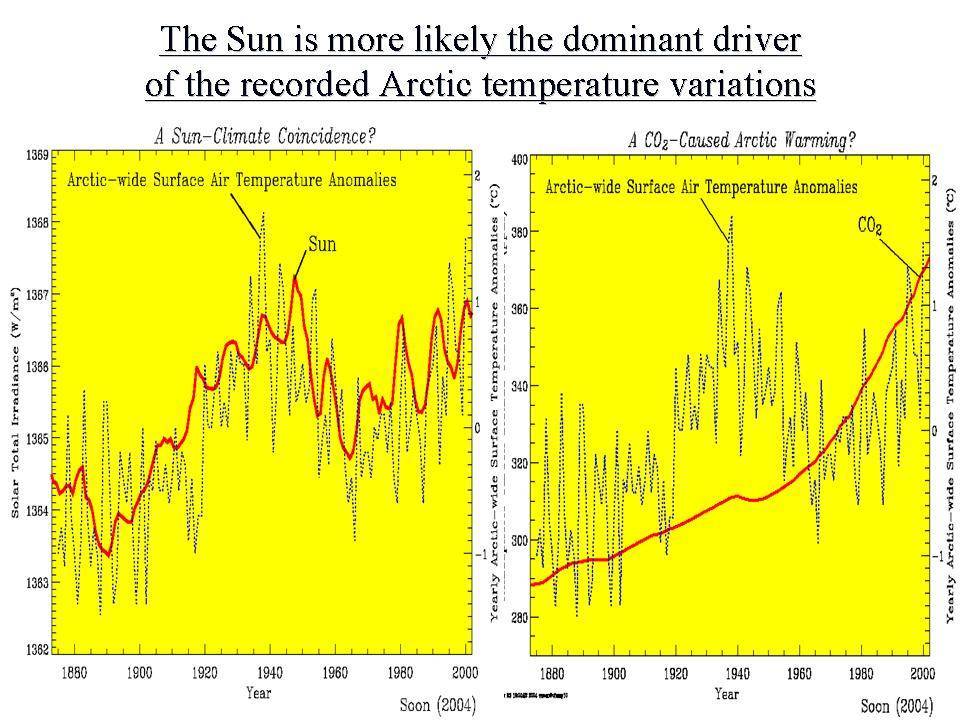
Dr. Willie Soon has shown how the arctic temperatures match the solar Total Solar Irradiance (Hoyt/Schatten/Willson) well. Correlation is poor with CO2.

Enlarged here.
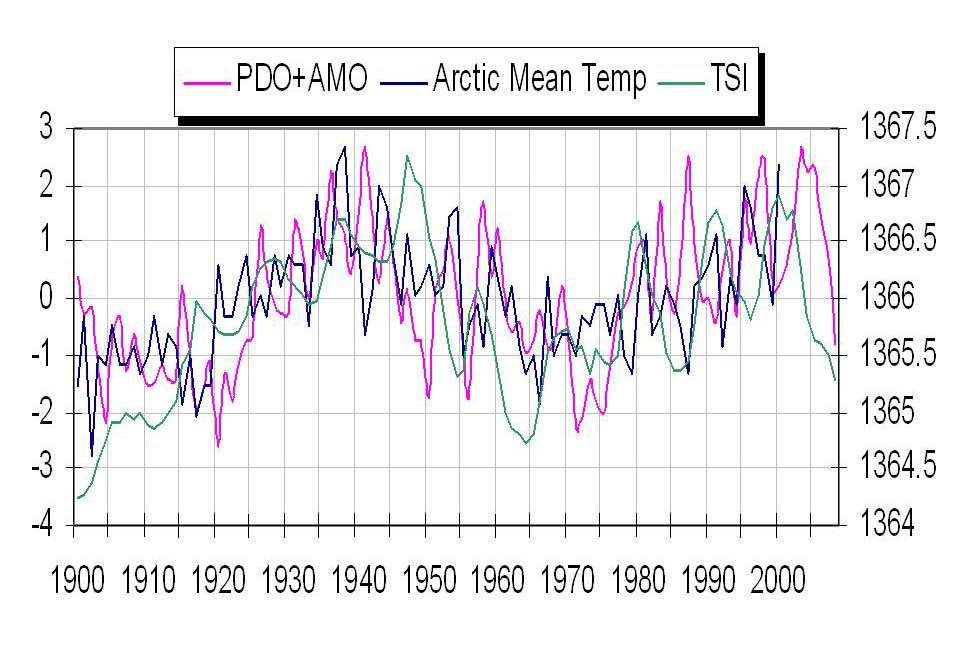
We see here how the annual TSI and annual PDO+AMO track together with arctic temperatures.

Enlarged here.
Though the current spike in the Atlantic temperatures and more high latitude blocking may cause another spike of melting in the next few winters as warm water from the AMO pop the last year works its way into the arctic, longer term you can expect arctic temperatures to decline and ice to rebound as the Pacific stays cold and the Atlantic cools and the sun stays in its 213 year Eddy minimum.
That doesn’t preclude some very cold and snowy winters short term. In 2008 glaciologist Bruce Molnia reported a bitterly cold Alaskan summer of 2008 following a La Nina winter with extreme cold and heavy snows resulted in area glaciers to expand, rather than shrink for the FIRST TIME IN RECORDED HISTORY. Summer temperatures, which were some 3 degrees below average, allowed record levels of winter snow to remain much longer, leading to the increase in glacial mass for the first time in at least 250 years.
See PDF here. See Verity Jones recent post on the arctic data here.

Enlarged here.
See more on glaciers and icecaps here.
See post by Arnd Bernaerts on Verity Jones’ Digging in the Clay here with much more on the arctic. See also here how the decade is almost up for the arctic ice disappearing here.
Also interesting that the minimum was 2 weeks earlier than 2007.
On a similar note, 1st snows of the season in Colorado high country this week :
Interesting and related paper by Polyakov, Walsh and Kwok published today, available here :
http://journals.ametsoc.org/doi/pdf/10.1175/BAMS-D-11-00070.1
Well worth a read, IMO.
Walruses sleep, mate, and nurse their young while in the water. They don’t need ice.
By 2030, not only will the Arctic not be ice free, it will have as much ice as in 1970. That is the bottom of the next cycle.
Hi,
The TSI Chart that is used is not what is considered the proper construction because it shows TSI varying by more than 3watts/M squared. I don’t see many other problems but you can still used the newer reconstructions to show it varies similar to the other indices.
Jim Arndt
It is all about the headline….Second lowest on record….missing that the record is only 4 years old and the whole record is only 30 years long.
How about doing a plot of polar bear and walrus populations versus ice cover ?
The post again raises the PDO plus AMO dataset. The two datasets cannot be added. I discussed this obvious and repeated error most recently here:
http://bobtisdale.wordpress.com/2011/06/08/on-the-amopdo-dataset/
It was also cross post here at WUWT.
Those stinking melt ponds can really mess up a good bias….can’t they
Joe D’Aleo writes: “Dr. Willie Soon has shown how the arctic temperatures match the solar Total Solar Irradiance (Hoyt/Schatten/Willson) well.”
The Hoyt and Schatten TSI reconstruction is obsolete. It was created to explain the warming in the early portion of the 20th Century. I understand that Hoyt no longer agrees with that reconstruction, yet it continues to be referenced and used in comparisons.
If one goes back 6-7000 years ago, there is evidence of an ice-free arctic and less ice than today. This also corresponds to evidence of higher temps.
http://www.ngu.no/en-gb/Aktuelt/2008/Less-ice-in-the-Arctic-Ocean-6000-7000-years-ago/
“One prominent researcher, Igor Polyakov at the University of Fairbanks, Alaska, points out that pulses of unusually warm water have been entering the Arctic Ocean from the Atlantic, which several years later are seen in the ocean north of Siberia. These pulses of water are helping to heat the upper Arctic Ocean, contributing to summer ice melt and helping to reduce winter ice growth.
Another scientist, Koji Shimada of the Japan Agency for Marine-Earth Science and Technology, reports evidence of changes in ocean circulation in the Pacific side of the Arctic Ocean. Through a complex interaction with declining sea ice, warm water entering the Arctic Ocean through Bering Strait in summer is being shunted from the Alaskan coast into the Arctic Ocean, where it fosters further ice loss. Many questions still remain to be answered, but these changes in ocean circulation may be important keys for understanding the observed loss of Arctic sea ice.”
There is substantial evidence that atmospheric oscillations and wind have a major influence on Arctic Sea Ice. In this October, 1 2007 NASA article;
http://www.nasa.gov/vision/earth/lookingatearth/quikscat-20071001.html
Son V. Nghiem of NASA’s Jet Propulsion Laboratory, said that “the rapid decline in winter perennial ice the past two years was caused by unusual winds. “Unusual atmospheric conditions set up wind patterns that compressed the sea ice, loaded it into the Transpolar Drift Stream and then sped its flow out of the Arctic,” he said. When that sea ice reached lower latitudes, it rapidly melted in the warmer waters.
“The winds causing this trend in ice reduction were set up by an unusual pattern of atmospheric pressure that began at the beginning of this century,” Nghiem said.”
Per this 2001 paper, “Fram Strait Ice Fluxes and Atmospheric Circulation: 1950–2000″ by Torgny Vinje published in the American Meteorological Society Journal of Climatet;
“The corresponding decadal maximum change in the Arctic Ocean ice thickness is of the order of 0.8 m. These temporal wind-induced variations may help explain observed changes in portions of the Arctic Ocean ice cover over the last decades. Due to an increasing rate in the ice drainage through the Fram Strait during the 1990s, this decade is characterized by a state of decreasing ice thickness in the Arctic Ocean.”
http://journals.ametsoc.org/doi/abs/10.1175/1520-0442%282001%29014%3C3508%3AFSIFAA%3E2.0.CO%3B2
This 2004 paper “Variations in the Age of Arctic Sea-ice and Summer Sea-ice Extent” by Ignatius G. Rigor & John M. Wallace, states that;
“The winter AO-index explains as much as 64% of the variance in summer sea-ice extent in the Eurasian sector, but the winter and summer AO-indices combined explain less than 20% of the variance along the Alaskan coast, where the age of sea-ice explains over 50% of the year-to year variability. If this interpretation is correct, low summer sea-ice extents are likely to persist for at least a few years. However, it is conceivable that, given an extended interval of low-index AO conditions, ice thickness and summertime sea-ice extent could gradually return to the levels characteristic of the 1980′s.”
http://seaice.apl.washington.edu/IceAge&Extent/Rigor&Wallace2004.pdf
This 2007 paper “Rapid reduction of Arctic perennial sea ice” by Nghiem, Rigor, Perovich, Clemente-Colo, Weatherly and Neumann states that;
“Perennial-ice extent loss in March within the DM domain was noticeable after the 1960s, and the loss became more rapid in the 2000s when QSCAT observations were available to verify the model results. QSCAT data also revealed mechanisms contributing to the perennial-ice extent loss: ice compression toward the western Arctic, ice loading into the Transpolar Drift (TD) together with an acceleration of the TD carrying excessive ice out of Fram Strait, and ice export to Baffin Bay.”
http://seaice.apl.washington.edu/Papers/NghiemEtal2007_MYreduction.pdf
This 2010 paper, “Influence of winter and summer surface wind anomalies on summer Arctic sea ice extent” by Masayo Ogi, Koji Yamazaki and John M. Wallace, published in Geophysical Research Letters states that;
“We have shown results indicating that wind‐induced, year‐to‐year differences in the rate of flow of ice toward and through Fram Strait play an important role in modulating September SIE on a year‐to‐year basis and that a trend toward an increased wind‐induced rate of flow has contributed to the decline in the areal coverage of Arctic summer sea ice.”
http://www.jamstec.go.jp/frcgc/research/d2/masayo.ogi/2009GL042356.pdf
This 2011 paper, “Recent wind driven high sea ice export in the Fram Strait contributes to Arctic sea ice decline”, submitted to The Cryosphere by L. H. Smedsrud, et al. used;
“geostrophic winds derived from reanalysis data to calculate the Fram Strait ice area export back to 1957, finding that the sea ice area export recently is about 25 % larger than during the 1960’s.”
http://www.the-cryosphere-discuss.net/5/1311/2011/tcd-5-1311-2011-print.pdf
” Iceshelves can melt NOT ONLY WITH HOT WATER BUT ALSO WITH CONC: DEICERS. Ocean analysis indicating that 7,100 p.p.m of Megnesium Chloride & 35,000 p.p.m Sodium Chloride are present at certain Oceans & Seas at certain time of year. As I have those datas since 1980, I will be only able to solve this Global Calamities. Welcome to visit Sarva Kala Vallabhan Group & Airconditioning of Mother Earth. & comment. Book publishing soon in US ” Environmental Rapes & H. R. Abuses Lead to Climate Change Control ” ( full color- 500 pages ) by Raveendran Narayanan.For more information Google Search Engine. : “Raveendran Narayanan” “Climate Change”
The post includes a comparison of the Godthab Nuuk Land Surface Temperatures and the AMO:
http://icecap.us/images/uploads/ARCTIC10.jpg
It’s pretty obvious that the two datasets have little in common other than a mid-century hump, but just in case it’s not that easy for you to see, here are the two datasets on the same graph with the AMO data scaled (multiplied by a factor of 5):
http://i55.tinypic.com/2w7kciq.jpg
The Godthab Nuuk data leads the AMO by a couple of decades for the early warming period, so it would be difficult for the “warming and cooling [to be] tied to the AMO” if the Godthab Nuuk temperatures rise for a few decades while the AMO is declining. And the AMO leads the Godthab Nuuk temperature anomalies by a few decades during the latter warming period. It’s tough to tie the AMO to the Godthab Nuuk temps during this period with that much of a lag.
The reality: the correlation coefficient for the two datasets on annual basis is only 0.39. That’s pretty poor.
“Notice how the temperatures in Alaska go through step changes tied to the PDO”
And I noticed that they started tracking Arctic ice at about the time it switched to the warm phase.
Hmm. 6.4% higher would be significant in and of itself, but the fact the minimum extent was reached two weeks earlier could be even more important.
However, since climate is what you expect, and weather is what you get, we’ll just have to wait and see.
Anything is possible says September 16, 2011 at 5:59 pm
Interesting and related paper by Polyakov, Walsh and Kwok published today, available here :
http://journals.ametsoc.org/doi/pdf/10.1175/BAMS-D-11-00070.1
Yes, very interesting:
“Between 2005 and 2008 (Figure 1), the Arctic Ocean lost 42% of its multiyear ice (MYI = ice which survives at least one arctic summer) coverage.”
“Much of the export is MYI. Data collected by the International Arctic Buoy Programme suggest that the thinning of the sea ice in the early to mid-1990s was attributable to an increase in ice area export through Fram Strait. Through that time period, this increased export has been linked to the positive phase of the Arctic Oscillation, which increases the cross-strait gradient in sea level pressure.”
“Interannual variability in sea-ice export through Fram Strait is significant, with a low of 516,000 km2 in 1984–85 and a high of 1,002,000 km2 in 1994–95. An anomalously large wind-driven export event (for example, the peak 1994–95 export) could have a long-lasting impact on the survival of the MYI ice cover, especially when large export events are superimposed on a warming trend.”
“Recent changes of arctic multiyear sea-ice coverage and the likely causes” by Igor V. Polyakov, Ronald Kwok, and John E. Walsh, 2011:
http://journals.ametsoc.org/doi/pdf/10.1175/BAMS-D-11-00070.1
I too, think the early refreeze is important…
For reference, here is the RSS Northern Polar Temperature:
ftp://ftp.ssmi.com/msu/graphics/tlt/plots/rss_ts_channel_tlt_northern%20polar_land_and_sea_v03_3.png
The warming trend is .339 C per decade. I am sure this warming influences some melt around the fringes of the Ice Pack, but it was obviously not the reason that “Between 2005 and 2008 (Figure 1), the Arctic Ocean lost 42% of its multiyear ice (MYI = ice which survives at least one arctic summer) coverage.”
This Sea Ice Thickness 30 day animation is helpful in visualizing sea ice transport through the Fram Straight;
http://www7320.nrlssc.navy.mil/hycomARC/navo/arcticict_nowcast_anim30d.gif
this 12 month Sea Ice Thickness animation gives a good view of the annual cycle;
http://www7320.nrlssc.navy.mil/hycomARC/navo/arcticict_nowcast_anim365d.gif
as does this 30 year Arctic Sea Ice extent animation:
Neven was nice enough to keep a play by play on this year’s Fram Strait Sea Ice Transport, e.g.
“Update August 8th: Added images from the previous three days. Some serious ice transport going on there. If this keeps up…”
“Update August 11th: Added images from the previous two days, and removed images from July. Transport is steaming full speed ahead.”
http://neven1.typepad.com/blog/2011/07/2011-fram-strait-animation.html
This 30 day Wind Speed and Drift Animation is helpful in understanding how atmospheric circulation and wind can transport multi-year sea ice through the Fram Straight.
http://www7320.nrlssc.navy.mil/hycomARC/navo/arcticicespddrf_nowcast_anim30d.gif
And this 12 month Wind Speed and Drift Animation help to see polar vortices form and spin out.
http://www7320.nrlssc.navy.mil/hycomARC/navo/arcticicespddrf_nowcast_anim365d.gif
Polar Vortices;
http://en.wikipedia.org/wiki/Polar_vortex
“are caused when an area of low pressure sits at the rotation pole of a planet. This causes air to spiral down from higher in the atmosphere, like water going down a drain.”
http://www.universetoday.com/973/what-venus-and-saturn-have-in-common/
Here’s an animation of the Arctic Polar Vortex in Winter 2008 – 09;
When a Polar Vortex breaks down it causes a Sudden Stratospheric Warming:
http://en.wikipedia.org/wiki/Sudden_stratospheric_warming
This animation helps to visualize Northern Hemesphere Atmospheric Circulation and the Arctic Oscillation (AO);
http://www.cpc.ncep.noaa.gov/products/intraseasonal/z500_nh_30d_anim.gif
and you can find a wide array of data and information on the AO and other Oscilations on the WUWT Atmospheric Oscillation page:
http://wattsupwiththat.com/reference-pages/atmospheric-oscillation/
I must admit, I tend to skim-read a lot of the scientific detail in some of these posts but, on a more hum-drum basis, what struck me as odd a few weeks ago was the spectacle of the Row To The Pole jokers dragging their boat across thick ice in late summer to get to an arbitrary ex-Magnetic North Pole position (from 1996), 790 miles south of the real North Pole.
The reason it struck me as being odd is that if there is still so much darn ice left at that time of year, and it’s 6.4% above the oft-quoted warmist ‘darling’ year of 2007, then something would have to seriously change to melt the last ~800 miles of ice, in order to have the ‘ice-free Arctic summer’ that the AGW brigade yearn for so badly.
Maybe I’m missing the point, but since things seem to be cooling down again, it strikes me as being a crack-pot idea drummed up to alarm people unnecessarily.
If global warming is causing the increase in Arctic ice melt how come the Antarctic Ice is increasing at .9% per decade?
It’s not difficult to understand…
http://www.skepticalscience.com/Why-is-Antarctic-sea-ice-increasing.html
http://www.newscientist.com/article/dn16988-why-antarctic-ice-is-growing-despite-global-warming.html
http://www.nasa.gov/vision/earth/environment/sea_ice.html
But don’t fret janama, it’s only a temporary phenomenon.
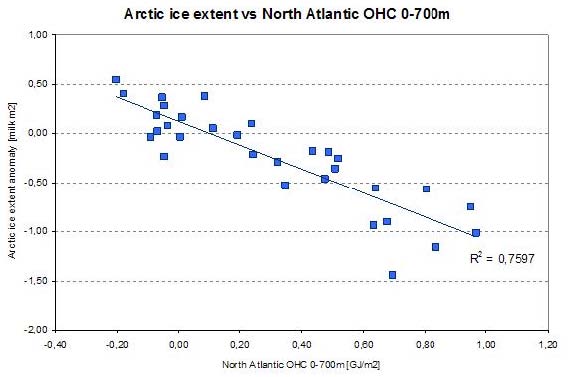
We see that the correlation between the arctic ice-concentration and the Upper Ocean Heat Content (OHC) of the waters northward 60N during summer (April….September) is very tight http://climexp.knmi.nl/data/g20110914_0943_17033_4.png .
Now we calculate the difference between the temperatures of the nordic extratratropics ( northward of 25 N) and the southward extratropics ( southward of 25S) and compare this value with the OHC 60N…90N we find a good coincidence: http://www.dh7fb.de/noaice/ohcamo.gif .
The detrended correlation with yearly smoothed data is 0,6.
The value (N ext – S ext) has a very similar pattern to the AMO and it could describe the transport of heat poleward from the tropics in a global view and not only in the atlantic bassin.
Data: T HadCRUT3, OHC: NODC heat content 0-700m , available via http://climexp.knmi.nl/selectfield_obs2.cgi?someone@somewhere .
Bob Tisdale says:
September 16, 2011 at 6:29 pm
The post again raises the PDO plus AMO dataset. The two datasets cannot be added. I discussed this obvious and repeated error most recently here:
http://bobtisdale.wordpress.com/2011/06/08/on-the-amopdo-dataset/
It was also cross post here at WUWT.
Hi Bob, I’ve asked this question before but not seen a reply from you:
“Why doesn’t someone produce datasets of these major oceanic oscillations which can be compared and added?”
Seems like a no-brainer to a layman. It’s almost as if the climate community doesn’t want to know the answers…
Bob Tisdale says:
September 16, 2011 at 6:42 pm
Joe D’Aleo writes: “Dr. Willie Soon has shown how the arctic temperatures match the solar Total Solar Irradiance (Hoyt/Schatten/Willson) well.”
The Hoyt and Schatten TSI reconstruction is obsolete. It was created to explain the warming in the early portion of the 20th Century. I understand that Hoyt no longer agrees with that reconstruction, yet it continues to be referenced and used in comparisons.
True, but unimportant. Soon has also demonstrated that sunshine hours correlates well with surface temperature elsewhere. Small variations in TSI are apparently amplified by terrestrial feedbacks, as demonstrated by Nir Shaviv in his JGR paper “Using the oceans as a calorimeter”.