Please note that WUWT cannot vouch for the accuracy of the data within this page, as all of the data is linked from third party sources and WUWT is simply an aggregator.
Atmospheric Temperatures:
UAH Lower Atmosphere Temperature Anomalies – 1979 to Present

Surface Temperature, US. Climate Reference Network, 2005 to present:

UAH Lower Atmosphere Temperature Anomalies – 1979 to Present

RSS Temperature Lower Troposphere (TLT) – Brightness Temperature Anomaly – 1979 to Present

Note: Per John Christy, RSS and UAH anomalies are not comparable because they use different base periods, i.e., “RSS only uses 1979-1998 (20 years) while UAH uses the WMO standard of 1981-2010.”
RSS Temperature Middle Troposphere (TMT) – Brightness Temperature Anomaly – 1979 to Present

Temperature Troposphere / Stratosphere (TTS) – Brightness Temperature Anomaly – 1987 to Present

Temperature Lower Stratosphere (TLS) – Brightness Temperature Anomaly – 1979 to Present

Global Surface Temperatures:
Monthly Mean Surface Temperature Anomaly – 1996 to Present
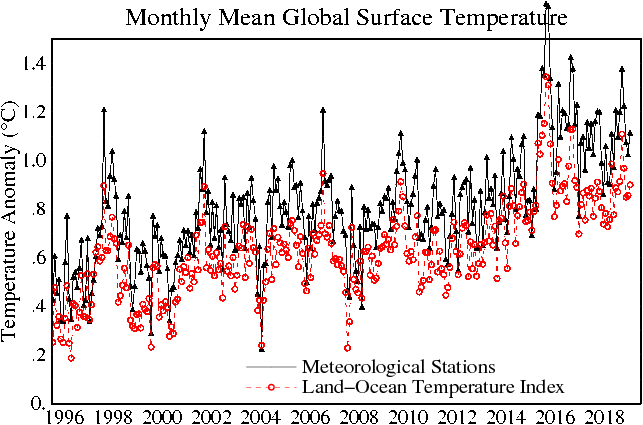
Annual Global Mean Temperature Anomaly Over Land & Sea – 1880 to Present

Annual Global Average Land and Ocean Temperature Anomaly – 1850 to 2012

Monthly Global Average Land Temperature – 1850 to Present

HadCRUT4 Global, Northern and Southern Hemispheric Temperature Anomalies

Ocean Temperature:
Global Sea Surface Temperature Anomaly – NCDC

Global Sea Surface Temperature Anomaly – HadSST2 and HadSST3

Global Sea Surface Temperature Anomaly – Monthly

Global Sea Surface Temperature

Global Sea Surface Temperature Animation – 30 Days Including 7 Day Forecast

Global Sea Surface Temperature – 3 Months – NOAA:
http://www.cpc.ncep.noaa.gov/products/analysis_monitoring/enso_update/gsstanim.gif
Global Sea Surface Temperature – 12 Months – Naval Research Laboratory (NRL):
http://www7320.nrlssc.navy.mil/GLBhycom1-12/navo/globalsst_nowcast_anim365d.gif
Custom Sea Surface Temperature Mapping Tool – from 1981 – NOAA:
http://www.cpc.ncep.noaa.gov/products/GODAS/mnth_movie.shtml
Equatorial Pacific Sea Surface Temperature – 30 Days Including 7 Day Forecast

Equatorial Pacific Sea Surface Temperature – NOAA – 3 Months:
http://www.cpc.ncep.noaa.gov/products/analysis_monitoring/enso_update/sstanim.gif
Equatorial Pacific Sea Surface Temperature Anomalies – BoM – 3 Months:
http://www.bom.gov.au/climate/enso/surface_anim.gif
Equatorial Pacific Sea Surface Temperature – 1 Year Including 7 Day Forecast:
http://www7320.nrlssc.navy.mil/GLBhycom1-12/navo/equpacsst_nowcast_anim365d.gif
Ocean Subsurface Temperature:
BoM Global Subsurface Average Temperature and Anomalies at 150 Meters:

BoM Global Subsurface Average Temperature and Anomalies at 400 Meters:

BoM Monthly Subsurface Pacific Ocean Equatorial Temperature Anomalies down to 400 Meters:

BoM 5 Day Subsurface Pacific Ocean Equatorial Temperature Means and Anomalies down to 500 Meters:

Global Ocean Heat Content – 0-700 Meters – 1955 to Present

Accumulated Cyclone Energy
Global Tropical Cyclone Accumulated Cyclone Energy – 1970 to Present

Northern Hemisphere Temperatures:
Northern Hemisphere Temperature Lower Troposphere (TLT) 1979 to Present

Northern Hemisphere Surface Temperatures

Northern Hemisphere Sea Surface Temperature

RSS Northern Polar Temperature Lower Troposphere (TLT) – 1979 to Present

Mean Temperature above 80°N

Southern Hemisphere Temperatures:
Southern Hemisphere Temperature Lower Troposphere (TLT) 1979 to Present
 - 1979 to Present")
RSS Southern Polar Temperature Lower Troposphere (TLT) – 1979 to Present

Shortlink for this page, suitable for blog posts and Twitter feeds:
Source Guide:
Australian Bureau of Meteorology (BOM):
Home Page – http://www.bom.gov.au/
Climate Page – http://www.bom.gov.au/climate/
ENSO Page – http://www.bom.gov.au/climate/enso/
Center for Ocean-Atmospheric Prediction Studies (COAPS), Florida State University – Ryan N. Maue PhD – Environmental Prediction (NCEP) – Global Forecast System (GFS)
Home Page –http://www.coaps.fsu.edu/index.shtml
Products Page – http://www.coaps.fsu.edu/~maue/weather/
Data Page – http://www.coaps.fsu.edu/~maue/extreme/gfs/current/
Cryosphere Today – Arctic Climate Research at the University of Illinois:
Home Page – http://arctic.atmos.uiuc.edu/
Products Page – http://arctic.atmos.uiuc.edu/cryosphere/
Images Indexed By Date – http://arctic.atmos.uiuc.edu/cryosphere/IMAGES/
DrRoySpencer.com – Dr. Roy Spencer
Home Page – http://www.drroyspencer.com/
Current Temperature Page – http://www.drroyspencer.com/latest-global-temperatures/
Uploads Page – http://www.drroyspencer.com/wp-content/uploads/
Danish Meteorological Institute (DMI) – Centre for Ocean and Ice
http://ocean.dmi.dk/english/index.php
http://ocean.dmi.dk/arctic/index.uk.php
climate4you.com – Ole Humlum
Home Page –http://climate4you.com/
Ole Humlum Bibliography – http://climate4you.com/Text/BIBLIOGRAPHY%20OLE%20HUMLUM.pdf
Center for Ocean-Atmospheric Prediction Studies (COAPS), Florida State University – Ryan N. Maue PhD – Environmental Prediction (NCEP) – Global Forecast System (GFS)
Home Page –http://www.coaps.fsu.edu/index.shtml
Products Page – http://www.coaps.fsu.edu/~maue/weather/
Data Page – http://www.coaps.fsu.edu/~maue/extreme/gfs/current/
Met Office – Hadley Center
Home Page – http://www.metoffice.gov.uk/
Products Page – http://www.metoffice.gov.uk/hadobs/
Global Temperature Products Page – Products Page – http://www.metoffice.gov.uk/hadobs/hadcrut3/diagnostics/comparison.html
National Oceanic & Atmospheric Administration (NOAA) – Climate Prediction Center (CPC)
Home Page – http://www.cpc.ncep.noaa.gov/
Products Page – http://www.cpc.ncep.noaa.gov/products/
Monitoring and Data Products Page – http://www.cpc.ncep.noaa.gov/products/MD_index.shtml
Atmospheric & SST Indices Page – http://www.cpc.ncep.noaa.gov/data/indices/
Regional Climate Maps – http://www.cpc.ncep.noaa.gov/products/analysis_monitoring/regional_monitoring/
Monitoring and Data Page – http://www.cpc.ncep.noaa.gov/products/monitoring_and_data/
FTP Page – ftp://ftp.cpc.ncep.noaa.gov/
National Oceanic & Atmospheric Administration – (NOAA) – Environmental Modeling Center (EMC)
Home Pagehttp://www.emc.ncep.noaa.gov/
National Oceanic and Atmospheric Administration (NOAA) – Earth System Research Laboratory (ESRL)
Home Page – http://www.esrl.noaa.gov/
Physical Sciences Division (PSD) Products Page – http://www.esrl.noaa.gov/psd/products/
Physical Sciences Division (PSD) Data Data Page – http://www.esrl.noaa.gov/psd/data/
Physical Sciences Division (PSD) Data Maps Page – http://www.esrl.noaa.gov/psd/map/
National Aeronautics and Space Administration (NASA) Goddard Institute for Space Studies (GISS)
Home Page – http://data.giss.nasa.gov/gistemp/
Products – http://data.giss.nasa.gov/
National Oceanic and Atmospheric Administration (NOAA) – National Operational Hydrologic Remote Sensing Center (NOHRSC)
Home Page – http://www.nohrsc.noaa.gov/
Snow Analysis Page –http://www.nohrsc.noaa.gov/nsa/
Forecasts – http://www.nohrsc.noaa.gov/forecasts/
National Oceanic and Atmospheric Administration (NOAA) – National Ice Center (NATICE):
Home Page – http://www.natice.noaa.gov/mission.html?bandwidth=high
Products Page – http://www.natice.noaa.gov/products/products_on_demand.html?bandwidth=high
National Oceanic and Atmospheric Administration (NOAA) – National Climatic Data Center (NCDC)
Home Page – http://www.ncdc.noaa.gov/oa/about/about.html?bandwidth=high
Products Page – http://www.ncdc.noaa.govgov/oa/ncdc.html?bandwidth=high
FTP Page – http://www1.ncdc.noaa.gov/pub/data/cmb/?bandwidth=high
National Oceanic & Atmospheric Administration – (NOAA) – National Oceanographic Data Center (NODC)
Home Pagehttp://www.nodc.noaa.gov/
Products Page – http://www.nodc.noaa.gov/General/NODC-About/NODC-Major-Products.html
Data Page – http://www.nodc.noaa.gov/General/getdata.html
Heat Content Page – http://www.nodc.noaa.gov/OC5/3M_HEAT_CONTENT/
Naval Research Laboratory (NRL) Monterey Marine Meteorology Division
Home Page – http://www.nrlmry.navy.mil/
Products Page – http://www.nrlmry.navy.mil/proddemo.htm
Satellite Products Page- http://www.nrlmry.navy.mil/sat_products.html
NOGAPS Forcast Products Page – http://www.nrlmry.navy.mil/metoc/nogaps/NOGAPS_global_net.html
Data Page – http://www.nrlmry.navy.mil/archdat/
Multi-view – http://www.nrlmry.navy.mil/sat-bin/global.cgi
Navel Coasal Ocean Model – http://www7320.nrlssc.navy.mil/global_ncom/
FTP Page – http://www7320.nrlssc.navy.mil/global_ncom/Links/
FTP Page Global – http://www7320.nrlssc.navy.mil/global_ncom/Links/glb/
Remote Sensing Systems (RSS)
Home Page – http://ssmi.com/?bandwidth=high
MSU Page – http://ssmi.com/msu/msu_browse.html?bandwidth=high
MSU FTP Page – ftp://ftp.ssmi.com/msu/?bandwidth=high
FTP Page – ftp://ftp.ssmi.com/?bandwidth=high
Rutgers University – Global Snow Lab (GSL)
Home Page – http://climate.rutgers.edu/snowcover/index.php?bandwidth=high
Products Page – http://climate.rutgers.edu/snowcover/chart_seasonal.php?ui_set=eurasia&ui_season=1?bandwidth=high
University of Colorado at Boulder
Home Page – http://sealevel.colorado.edu/
Sea Level Calibration Page: http://sealevel.colorado.edu/content/calibration
Sea Level Release Notes Page: http://sealevel.colorado.edu/content/release-notes
Temperature Results Page – http://sealevel.colorado.edu/results.php
FTP Page – http://sealevel.colorado.edu/current/
University of East Anglia (UEA) – Climatic Research Unit (CRU)
Home Page – http://www.cru.uea.ac.uk/
Data Page – http://www.cru.uea.ac.uk/data
Additional Resources:
University of Alabama at Huntsville – Distributed Information Services for Climate and Ocean Products and Visualizations for Earth Research (DISCOVER) Project:
Home Page – http://discover.itsc.uah.edu/
Temperature Page – http://discover.itsc.uah.edu/amsutemps/amsutemps.html
Global Temp Page – http://discover.itsc.uah.edu/amsutemps/
Sea Surface Temperature Page – http://discover.itsc.uah.edu/amsutemps/execute.csh?amsutemps+001
Temperature 14,000 feet Page: – http://discover.itsc.uah.edu/amsutemps/execute.csh?amsutemps+002
Temperature 25,000 feet Page – http://discover.itsc.uah.edu/amsutemps/execute.csh?amsutemps+003
Temperature 36,000 feet Page: – http://discover.itsc.uah.edu/amsutemps/execute.csh?amsutemps+004
Temperature 46,000 feet Page – http://discover.itsc.uah.edu/amsutemps/execute.csh?amsutemps+005
Temperature 56,000 feet Page: – http://discover.itsc.uah.edu/amsutemps/execute.csh?amsutemps+006
Temperature 68,000 feet Page – http://discover.itsc.uah.edu/amsutemps/execute.csh?amsutemps+007
Temperature 82,000 feet Page: – http://discover.itsc.uah.edu/amsutemps/execute.csh?amsutemps+008
Temperature 102,000 feet Page – http://discover.itsc.uah.edu/amsutemps/execute.csh?amsutemps+009
Temperature 118,000 feet Page: – http://discover.itsc.uah.edu/amsutemps/execute.csh?amsutemps+010
Temperature 135,000 feet Page – http://discover.itsc.uah.edu/amsutemps/execute.csh?amsutemps+011