Please note that WUWT cannot vouch for the accuracy of the data within this page, as all of the data is linked from third party sources and WUWT is simply an aggregator.
Atmospheric Temperatures:
UAH Lower Atmosphere Temperature Anomalies – 1979 to Present

Surface Temperature, US. Climate Reference Network, 2005 to present:

UAH Lower Atmosphere Temperature Anomalies – 1979 to Present

RSS Temperature Lower Troposphere (TLT) – Brightness Temperature Anomaly – 1979 to Present

Note: Per John Christy, RSS and UAH anomalies are not comparable because they use different base periods, i.e., “RSS only uses 1979-1998 (20 years) while UAH uses the WMO standard of 1981-2010.”
RSS Temperature Middle Troposphere (TMT) – Brightness Temperature Anomaly – 1979 to Present

Temperature Troposphere / Stratosphere (TTS) – Brightness Temperature Anomaly – 1987 to Present

Temperature Lower Stratosphere (TLS) – Brightness Temperature Anomaly – 1979 to Present

Global Surface Temperatures:
Monthly Mean Surface Temperature Anomaly – 1996 to Present
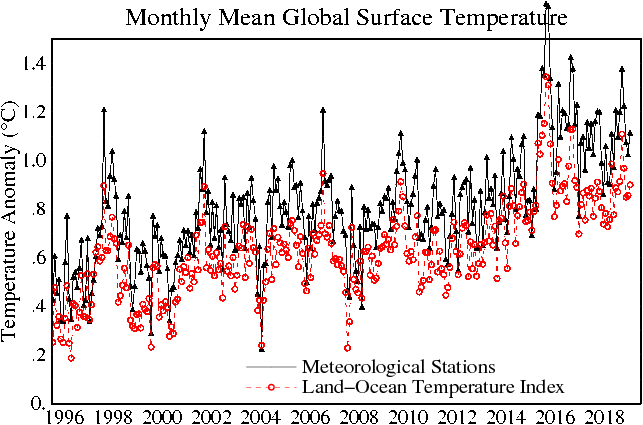
Annual Global Mean Temperature Anomaly Over Land & Sea – 1880 to Present

Annual Global Average Land and Ocean Temperature Anomaly – 1850 to 2012

Monthly Global Average Land Temperature – 1850 to Present

HadCRUT4 Global, Northern and Southern Hemispheric Temperature Anomalies

Ocean Temperature:
Global Sea Surface Temperature Anomaly – NCDC

Global Sea Surface Temperature Anomaly – HadSST2 and HadSST3

Global Sea Surface Temperature Anomaly – Monthly

Global Sea Surface Temperature

Global Sea Surface Temperature Animation – 30 Days Including 7 Day Forecast

Global Sea Surface Temperature – 3 Months – NOAA:
http://www.cpc.ncep.noaa.gov/products/analysis_monitoring/enso_update/gsstanim.gif
Global Sea Surface Temperature – 12 Months – Naval Research Laboratory (NRL):
http://www7320.nrlssc.navy.mil/GLBhycom1-12/navo/globalsst_nowcast_anim365d.gif
Custom Sea Surface Temperature Mapping Tool – from 1981 – NOAA:
http://www.cpc.ncep.noaa.gov/products/GODAS/mnth_movie.shtml
Equatorial Pacific Sea Surface Temperature – 30 Days Including 7 Day Forecast

Equatorial Pacific Sea Surface Temperature – NOAA – 3 Months:
http://www.cpc.ncep.noaa.gov/products/analysis_monitoring/enso_update/sstanim.gif
Equatorial Pacific Sea Surface Temperature Anomalies – BoM – 3 Months:
http://www.bom.gov.au/climate/enso/surface_anim.gif
Equatorial Pacific Sea Surface Temperature – 1 Year Including 7 Day Forecast:
http://www7320.nrlssc.navy.mil/GLBhycom1-12/navo/equpacsst_nowcast_anim365d.gif
Ocean Subsurface Temperature:
BoM Global Subsurface Average Temperature and Anomalies at 150 Meters:

BoM Global Subsurface Average Temperature and Anomalies at 400 Meters:

BoM Monthly Subsurface Pacific Ocean Equatorial Temperature Anomalies down to 400 Meters:

BoM 5 Day Subsurface Pacific Ocean Equatorial Temperature Means and Anomalies down to 500 Meters:

Global Ocean Heat Content – 0-700 Meters – 1955 to Present

Accumulated Cyclone Energy
Global Tropical Cyclone Accumulated Cyclone Energy – 1970 to Present

Northern Hemisphere Temperatures:
Northern Hemisphere Temperature Lower Troposphere (TLT) 1979 to Present

Northern Hemisphere Surface Temperatures

Northern Hemisphere Sea Surface Temperature

RSS Northern Polar Temperature Lower Troposphere (TLT) – 1979 to Present

Mean Temperature above 80°N

Southern Hemisphere Temperatures:
Southern Hemisphere Temperature Lower Troposphere (TLT) 1979 to Present
 - 1979 to Present")
RSS Southern Polar Temperature Lower Troposphere (TLT) – 1979 to Present

Shortlink for this page, suitable for blog posts and Twitter feeds:
Source Guide:
Australian Bureau of Meteorology (BOM):
Home Page – http://www.bom.gov.au/
Climate Page – http://www.bom.gov.au/climate/
ENSO Page – http://www.bom.gov.au/climate/enso/
Center for Ocean-Atmospheric Prediction Studies (COAPS), Florida State University – Ryan N. Maue PhD – Environmental Prediction (NCEP) – Global Forecast System (GFS)
Home Page –http://www.coaps.fsu.edu/index.shtml
Products Page – http://www.coaps.fsu.edu/~maue/weather/
Data Page – http://www.coaps.fsu.edu/~maue/extreme/gfs/current/
Cryosphere Today – Arctic Climate Research at the University of Illinois:
Home Page – http://arctic.atmos.uiuc.edu/
Products Page – http://arctic.atmos.uiuc.edu/cryosphere/
Images Indexed By Date – http://arctic.atmos.uiuc.edu/cryosphere/IMAGES/
DrRoySpencer.com – Dr. Roy Spencer
Home Page – http://www.drroyspencer.com/
Current Temperature Page – http://www.drroyspencer.com/latest-global-temperatures/
Uploads Page – http://www.drroyspencer.com/wp-content/uploads/
Danish Meteorological Institute (DMI) – Centre for Ocean and Ice
http://ocean.dmi.dk/english/index.php
http://ocean.dmi.dk/arctic/index.uk.php
climate4you.com – Ole Humlum
Home Page –http://climate4you.com/
Ole Humlum Bibliography – http://climate4you.com/Text/BIBLIOGRAPHY%20OLE%20HUMLUM.pdf
Center for Ocean-Atmospheric Prediction Studies (COAPS), Florida State University – Ryan N. Maue PhD – Environmental Prediction (NCEP) – Global Forecast System (GFS)
Home Page –http://www.coaps.fsu.edu/index.shtml
Products Page – http://www.coaps.fsu.edu/~maue/weather/
Data Page – http://www.coaps.fsu.edu/~maue/extreme/gfs/current/
Met Office – Hadley Center
Home Page – http://www.metoffice.gov.uk/
Products Page – http://www.metoffice.gov.uk/hadobs/
Global Temperature Products Page – Products Page – http://www.metoffice.gov.uk/hadobs/hadcrut3/diagnostics/comparison.html
National Oceanic & Atmospheric Administration (NOAA) – Climate Prediction Center (CPC)
Home Page – http://www.cpc.ncep.noaa.gov/
Products Page – http://www.cpc.ncep.noaa.gov/products/
Monitoring and Data Products Page – http://www.cpc.ncep.noaa.gov/products/MD_index.shtml
Atmospheric & SST Indices Page – http://www.cpc.ncep.noaa.gov/data/indices/
Regional Climate Maps – http://www.cpc.ncep.noaa.gov/products/analysis_monitoring/regional_monitoring/
Monitoring and Data Page – http://www.cpc.ncep.noaa.gov/products/monitoring_and_data/
FTP Page – ftp://ftp.cpc.ncep.noaa.gov/
National Oceanic & Atmospheric Administration – (NOAA) – Environmental Modeling Center (EMC)
Home Pagehttp://www.emc.ncep.noaa.gov/
National Oceanic and Atmospheric Administration (NOAA) – Earth System Research Laboratory (ESRL)
Home Page – http://www.esrl.noaa.gov/
Physical Sciences Division (PSD) Products Page – http://www.esrl.noaa.gov/psd/products/
Physical Sciences Division (PSD) Data Data Page – http://www.esrl.noaa.gov/psd/data/
Physical Sciences Division (PSD) Data Maps Page – http://www.esrl.noaa.gov/psd/map/
National Aeronautics and Space Administration (NASA) Goddard Institute for Space Studies (GISS)
Home Page – http://data.giss.nasa.gov/gistemp/
Products – http://data.giss.nasa.gov/
National Oceanic and Atmospheric Administration (NOAA) – National Operational Hydrologic Remote Sensing Center (NOHRSC)
Home Page – http://www.nohrsc.noaa.gov/
Snow Analysis Page –http://www.nohrsc.noaa.gov/nsa/
Forecasts – http://www.nohrsc.noaa.gov/forecasts/
National Oceanic and Atmospheric Administration (NOAA) – National Ice Center (NATICE):
Home Page – http://www.natice.noaa.gov/mission.html?bandwidth=high
Products Page – http://www.natice.noaa.gov/products/products_on_demand.html?bandwidth=high
National Oceanic and Atmospheric Administration (NOAA) – National Climatic Data Center (NCDC)
Home Page – http://www.ncdc.noaa.gov/oa/about/about.html?bandwidth=high
Products Page – http://www.ncdc.noaa.govgov/oa/ncdc.html?bandwidth=high
FTP Page – http://www1.ncdc.noaa.gov/pub/data/cmb/?bandwidth=high
National Oceanic & Atmospheric Administration – (NOAA) – National Oceanographic Data Center (NODC)
Home Pagehttp://www.nodc.noaa.gov/
Products Page – http://www.nodc.noaa.gov/General/NODC-About/NODC-Major-Products.html
Data Page – http://www.nodc.noaa.gov/General/getdata.html
Heat Content Page – http://www.nodc.noaa.gov/OC5/3M_HEAT_CONTENT/
Naval Research Laboratory (NRL) Monterey Marine Meteorology Division
Home Page – http://www.nrlmry.navy.mil/
Products Page – http://www.nrlmry.navy.mil/proddemo.htm
Satellite Products Page- http://www.nrlmry.navy.mil/sat_products.html
NOGAPS Forcast Products Page – http://www.nrlmry.navy.mil/metoc/nogaps/NOGAPS_global_net.html
Data Page – http://www.nrlmry.navy.mil/archdat/
Multi-view – http://www.nrlmry.navy.mil/sat-bin/global.cgi
Navel Coasal Ocean Model – http://www7320.nrlssc.navy.mil/global_ncom/
FTP Page – http://www7320.nrlssc.navy.mil/global_ncom/Links/
FTP Page Global – http://www7320.nrlssc.navy.mil/global_ncom/Links/glb/
Remote Sensing Systems (RSS)
Home Page – http://ssmi.com/?bandwidth=high
MSU Page – http://ssmi.com/msu/msu_browse.html?bandwidth=high
MSU FTP Page – ftp://ftp.ssmi.com/msu/?bandwidth=high
FTP Page – ftp://ftp.ssmi.com/?bandwidth=high
Rutgers University – Global Snow Lab (GSL)
Home Page – http://climate.rutgers.edu/snowcover/index.php?bandwidth=high
Products Page – http://climate.rutgers.edu/snowcover/chart_seasonal.php?ui_set=eurasia&ui_season=1?bandwidth=high
University of Colorado at Boulder
Home Page – http://sealevel.colorado.edu/
Sea Level Calibration Page: http://sealevel.colorado.edu/content/calibration
Sea Level Release Notes Page: http://sealevel.colorado.edu/content/release-notes
Temperature Results Page – http://sealevel.colorado.edu/results.php
FTP Page – http://sealevel.colorado.edu/current/
University of East Anglia (UEA) – Climatic Research Unit (CRU)
Home Page – http://www.cru.uea.ac.uk/
Data Page – http://www.cru.uea.ac.uk/data
Additional Resources:
University of Alabama at Huntsville – Distributed Information Services for Climate and Ocean Products and Visualizations for Earth Research (DISCOVER) Project:
Home Page – http://discover.itsc.uah.edu/
Temperature Page – http://discover.itsc.uah.edu/amsutemps/amsutemps.html
Global Temp Page – http://discover.itsc.uah.edu/amsutemps/
Sea Surface Temperature Page – http://discover.itsc.uah.edu/amsutemps/execute.csh?amsutemps+001
Temperature 14,000 feet Page: – http://discover.itsc.uah.edu/amsutemps/execute.csh?amsutemps+002
Temperature 25,000 feet Page – http://discover.itsc.uah.edu/amsutemps/execute.csh?amsutemps+003
Temperature 36,000 feet Page: – http://discover.itsc.uah.edu/amsutemps/execute.csh?amsutemps+004
Temperature 46,000 feet Page – http://discover.itsc.uah.edu/amsutemps/execute.csh?amsutemps+005
Temperature 56,000 feet Page: – http://discover.itsc.uah.edu/amsutemps/execute.csh?amsutemps+006
Temperature 68,000 feet Page – http://discover.itsc.uah.edu/amsutemps/execute.csh?amsutemps+007
Temperature 82,000 feet Page: – http://discover.itsc.uah.edu/amsutemps/execute.csh?amsutemps+008
Temperature 102,000 feet Page – http://discover.itsc.uah.edu/amsutemps/execute.csh?amsutemps+009
Temperature 118,000 feet Page: – http://discover.itsc.uah.edu/amsutemps/execute.csh?amsutemps+010
Temperature 135,000 feet Page – http://discover.itsc.uah.edu/amsutemps/execute.csh?amsutemps+011
Anybody else here notice that all the graphs show warming-just curious????
Yes Jerry, we all know that it has been warming for ~250 years since the depths CO2Science.Org – Click the pic to view at source[/caption]
 JoNova.com – Click the pic to view at source[/caption]
endof the Little Ice Age:1,100 Years – Ljungqvist et al
[caption id="" align="alignnone" width="542"]
1,100 Years Ljungqvist et al
[caption id="" align="alignnone" width="542"]
However, anthropogenic CO2 emissions have only been potentially consequential since ~1950;
https://wattsupwiththat.com/2014/03/29/when-did-anthropogenic-global-warming-begin/
and Phil Jones noted during a 2010 BBC interview, “As for the two periods 1910-40 and 1975-1998 the warming rates are not statistically significantly different.” As such, the warming from 1910 – 1940, before Anthropogenic CO2 became potentially consequential, is “not statistically significantly different” from the warming during the period from 1975 – 1998. If CO2 is a potent greenhouse gas at current atmospheric concentrations, we should see significant acceleration in the warming that was already occurring naturally due to the rebound from the Little Ice Age.
Warming is evidence of Earth’s temperature changing naturally, the lack of acceleration of this warming is evidence that CO2 is not a potent greenhouse gas at current atmospheric concentrations.
If you have any other questions, please do let us know…
“The main drivers of the Little Ice Age cooling were decreased solar activity and increased volcanic activity. These factors cannot account for the global warming observed over the past 50-100 years. Furthermore, it is physically incorrect to state that the planet is simply “recovering” from the Little Ice Age.”
Couldn’t have said it better myself.
https://skepticalscience.com/coming-out-of-little-ice-age-advanced.htm
You’ve produced a nice cherry picking of temperature proxies and timescaling.
http://www.realclimate.org/images/m08.jpg
CO2 forcings have been directly measured: http://newscenter.lbl.gov/2015/02/25/co2-greenhouse-effect-increase/
Kyle December 13, 2016 at 12:08
“The main drivers of the Little Ice Age cooling were decreased solar activity and increased volcanic activity”
We do not know what caused the Little Ice Age. Solar activity,volcanic activity are both possible factors, but the data is very limited for this time period.
“These factors cannot account for the global warming observed over the past 50-100 years.”
Of course “decreased solar activity and increased volcanic activity” “cannot account for the global warming observed over the past 50-100 years.” However, increased solar activity and decreased volcanic activity certainly could be possible factors in the “global warming observed over the past 50-100 years”.
“Furthermore, it is physically incorrect to state that the planet is simply “recovering” from the Little Ice Age.”
I did not say recovering, I said rebounding.
“Couldn’t have said it better myself.”
A sad statement fact given Skepticalscience.com’s inaccuracy.
“You’ve produced a nice cherry picking of temperature proxies and timescaling.”
I provided the most reliable proxies for the time period, whereas you’ve produced an erroneous chart that splices disparate and incomparable data sets.
As I noted above, during the periods “1910-40 and 1975-1998 the warming rates are not statistically significantly different.” even though Anthorpogenc CO2 emissions were not potentially consequential until after ~1950. What do you think caused the warming between 1910-40?
But from 1910 to 1940 the Sun was warming, and the CO2 was not much changed.
from 1975 to 1998 the Sun was not much changed, and the CO2 was increasing.
Wandering magnetic poles control the weather. Do you believe that? Pull up this link on a desktop monitor, study the graphics, and initiate a discussion.
https://www.harrytodd.org
The UHA temperature graphs have not updated here since September. They show a decisive downturn in temperature now 12/30.
With the increase in competition and product supply within these
industries, as well as tax incentives and possible government subsidies of those clean energy resources, cleaner smarter energy have been around in reach of numerous quickly another several years.
We are currently investigating some areas for average investors and funding your company
too take advantage of some BIG lucrative opportunities later on because they areas grow and develop on the coming years.
– Next you need to get in touch the blades to a shaft which,
subsequently, connects to the motor.
I have just found some time to read through all the threads. I love both the way so mch factual data is presented as well as the clear scientific rebuffals to the odd alarmist popping up. Keep up the good work
The UAH global temperature chart on this page was being updated monthly through February 2019. Since then it has not been updated – as temperatures have moved upward. “Watts up with that”?
[Nothing sinister. From that page: “all of the data is linked from third party sources and WUWT is simply an aggregator.” We will look into why its not linking. Mod]
Mods: no luck with the updates yet? It’s over a year since the above comment was made and the UAH chart still stops in Feb 2018. The RSS TLT chart appears to stop in early 2017 and is still showing the discontinued v3 data. RSS TLT v4 has been in use since July 2017 – almost 3 years now. Have these updates been abandoned by WUWT? Thanks.
The RSS TLT chart (3rd chart from the top) shows the old version 3 data, trend 0.134 K/dec. Updates stopped being added to version 3 some time ago (although the horizontal axis on the chart above suggests otherwise, for some reason). RSS TLT version 4, trend 0.204 K/dec, is the producer’s latest and fully updated operational data set:
http://images.remss.com/data/msu/graphics/TLT_v40/plots/RSS_TS_channel_TLT_Global_Land_And_Sea_v04_0.png
Updated to June 2021
The very globality of the “global” temperature hasn’t been addressed enough, and that should come before everything else, before the trends, before the models and before predictions. How do we know the global sampling was adequate for the entire industrial period when even as of 2013 it wasn’t adequate for one of the main datasets, the HadCRUT4: https://rmets.onlinelibrary.wiley.com/doi/full/10.1002/qj.2297? HadCRUT4 covers 84% of the globe, with the worst coverage in Africa and on the poles. I seriously doubt the globality of pre-war measurements, and even after the war they are suspicious. How do they account for the missing data?
We are taking the mean temperature values for granted in these graphs, on both sides of the debate, but we really shouldn’t.
Also, if we do, HadCRUT4 shows a big pause in the temperature rise between 1940 and 1980. Are we supposed to believe that everybody went green in the most intensive period of the post-war rebuild?
I am wondering where geographically the apparent warming in the past 20 years is occurring. I have seen some maps that show almost all of the delta above 20th century average temps, isolated to regions within and near the former USSR. Do you have some reliable maps showing, say, each decade’s temperature delta spatial distribution across the planet? Would be interesting to see if the same temperature reporting stations keep reporting anomalies each decade, or if the deviations are more well-distributed worldwide.
On the UAH satellite map if a straight line is drawn from the temperature for 1979 and extended through the temperature for 2004 and another line is drawn horizontally from the temperature for 2004 forward in time the presence of changeover from continuous warming to pause in warming is obvious. Since 2004 most of the temperature readings for the succeeding years fall below the horizontal line. This is more obvious when the temperatures for the major El Ninos of 1998 and 2016 are deleted.
The linear warming trend in UAH from Jan 2005 to May 2020 is +0.25 C/dec. That’s considerably faster than the warming trend in UAH from Dec 1978 to Dec 2004 (+0.15 C/dec).
https://woodfortrees.org/graph/uah6/to:2005/plot/uah6/to:2005/trend/plot/uah6/from:2005/plot/uah6/from:2005/trend
If we edit out the warming signal caused by El Nino but retain the cooling signal caused by La Nina then should we be surprised that overall the warming trend reduces?
That’s a bit weird looking at it that way. The data looks like there was a plateau at about -0.2C (anomaly) from 1980 to 1998’s El Nino which left temperatures at 0.0C from 2000 to 2015, another El Nino and then a new level at 0.2C.
A plot of a non-anomaly GAST would be nice — showing the nearly straight and level plain of 14.7 C air temperatures since 1880 or so.
There is only one certainty , the Sun rules the climate by virtue of it’s many cycles. From thousands of years to 50/60 year cycles. Everything else is political money making nonsense.
I have to say, this is a fantastic website. I wish I had discovered it sooner.