
So very close but not quite – Humberto came within about 2 hours of beating the satellite era lateness record for formation of Atlantic hurricane, though it looks to me like NOAA was trying to beat the deadline by giving credence to estimates:
http://www.nhc.noaa.gov/archive/2013/al09/al092013.discus.011.shtml
HURRICANE HUMBERTO DISCUSSION NUMBER  11

NWS NATIONAL HURRICANE CENTER MIAMI FL       AL092013

500 AM AST WED SEP 11 2013

CENTRAL CONVECTION HAS BEEN ON THE INCREASE WITH HUMBERTO DURING THE

LAST FEW HOURS...WITH A LARGE CURVED BAND WRAPPING AROUND THE

CYCLONE ALSO BECOMING BETTER DEFINED.  THE DVORAK ESTIMATES AT 6Z

SUPPORTED ANYTHING FROM 55-65 KT...AND GIVEN THE NOTABLE

STRENGTHENING OF THE CENTRAL DEEP CONVECTION AND OVERALL INCREASE

IN ORGANIZATION...THE INITIAL WINDS ARE RAISED TO 65 KT.
Note that Gustav in 2002 was a much different hurricane, closer to the USA. Humberto probably won’t make it across the Atlantic before turning north and dissipating. http://en.wikipedia.org/wiki/Hurricane_Gustav_(2002)
http://www.nhc.noaa.gov/archive/2002/dis/al082002.discus.013.html
=========================================================
Speaking of hurricanes, we are still in a major unprecedented hurricane drought in the USA- Dr. Roger Pielke Jr. has updated his drought graph:

‘Of course, it could end this month (September) or after, but it will end sometime. Whenever it does it has been remarkable.’
=================================================================
Steve McIntyre: IPCC and the end of summer
Though I haven’t posted for a while, I’ve done quite a bit of work on climate recently, though it hasn’t been the sort of work that lends itself readily to blog posts.
I made a presentation at a workshop session in Erice in the third week of August, which, at Chris Essex’ request, was entitled “Year in Review”, focusing on developments in proxy reconstructions. Ross McKitrick made a presentation with an identical title, covering other topics. I spent much of my time on the section on proxy reconstructions in the forthcoming IPCC report, as presaged in the Second Draft, a document which I’ve had for some time, but which I hadn’t yet parsed. In carrying out my own internal review, I re-examined the voluminous literature on individual proxies: ice cores, speleothems, ocean sediments as well as tree rings and “multi-proxy” reconstructions.
The review reminded me of conversations that I had with two prominent though then relatively early/mid-career climate scientists shortly before the announcement of AR4 in January 2007.
More: http://climateaudit.org/2013/09/11/ipcc-and-the-end-of-summer/
=============================================================
Forbes: Terrifying Flat Global Temperature Crisis Threatens To Disrupt U.N. Climate Conference Agenda
‘Where, Oh Where, Has that Global Warming Gone?’ — ‘One highly plausible answer to this mystery is that the climate models upon which IPCC’s failed projections are based exaggerate climate sensitivity to CO2, underestimate known natural forcings, and simply don’t understand how to factor in and calibrate other influences such as ocean cycles and solar activity.’
======================================================
Climate at the heart of Abbott’s election victory « Australian Climate Madness
In the election of 2010, as climate alarmism’s downward spiral was well underway, Julia Gillard shackled her fortunes to the Greens, environmental extremists who demanded urgent action on climate as part of the deal to support Labor. Gillard was forced to break her pre-election promise on the introduction of a carbon [dioxide] tax, and from that moment, trust in her and Labor was gone.
Celebrate! Climate Commission to be abolished! « Australian Climate Madness
The hopelessly politicised Climate Commission, the function of which was apparently to spin government propaganda as “science”, is to be abolished, along with a raft of other pointless climate organisations.
Here’s how ACM reported some of the worst Climate Commission excesses
========================================================
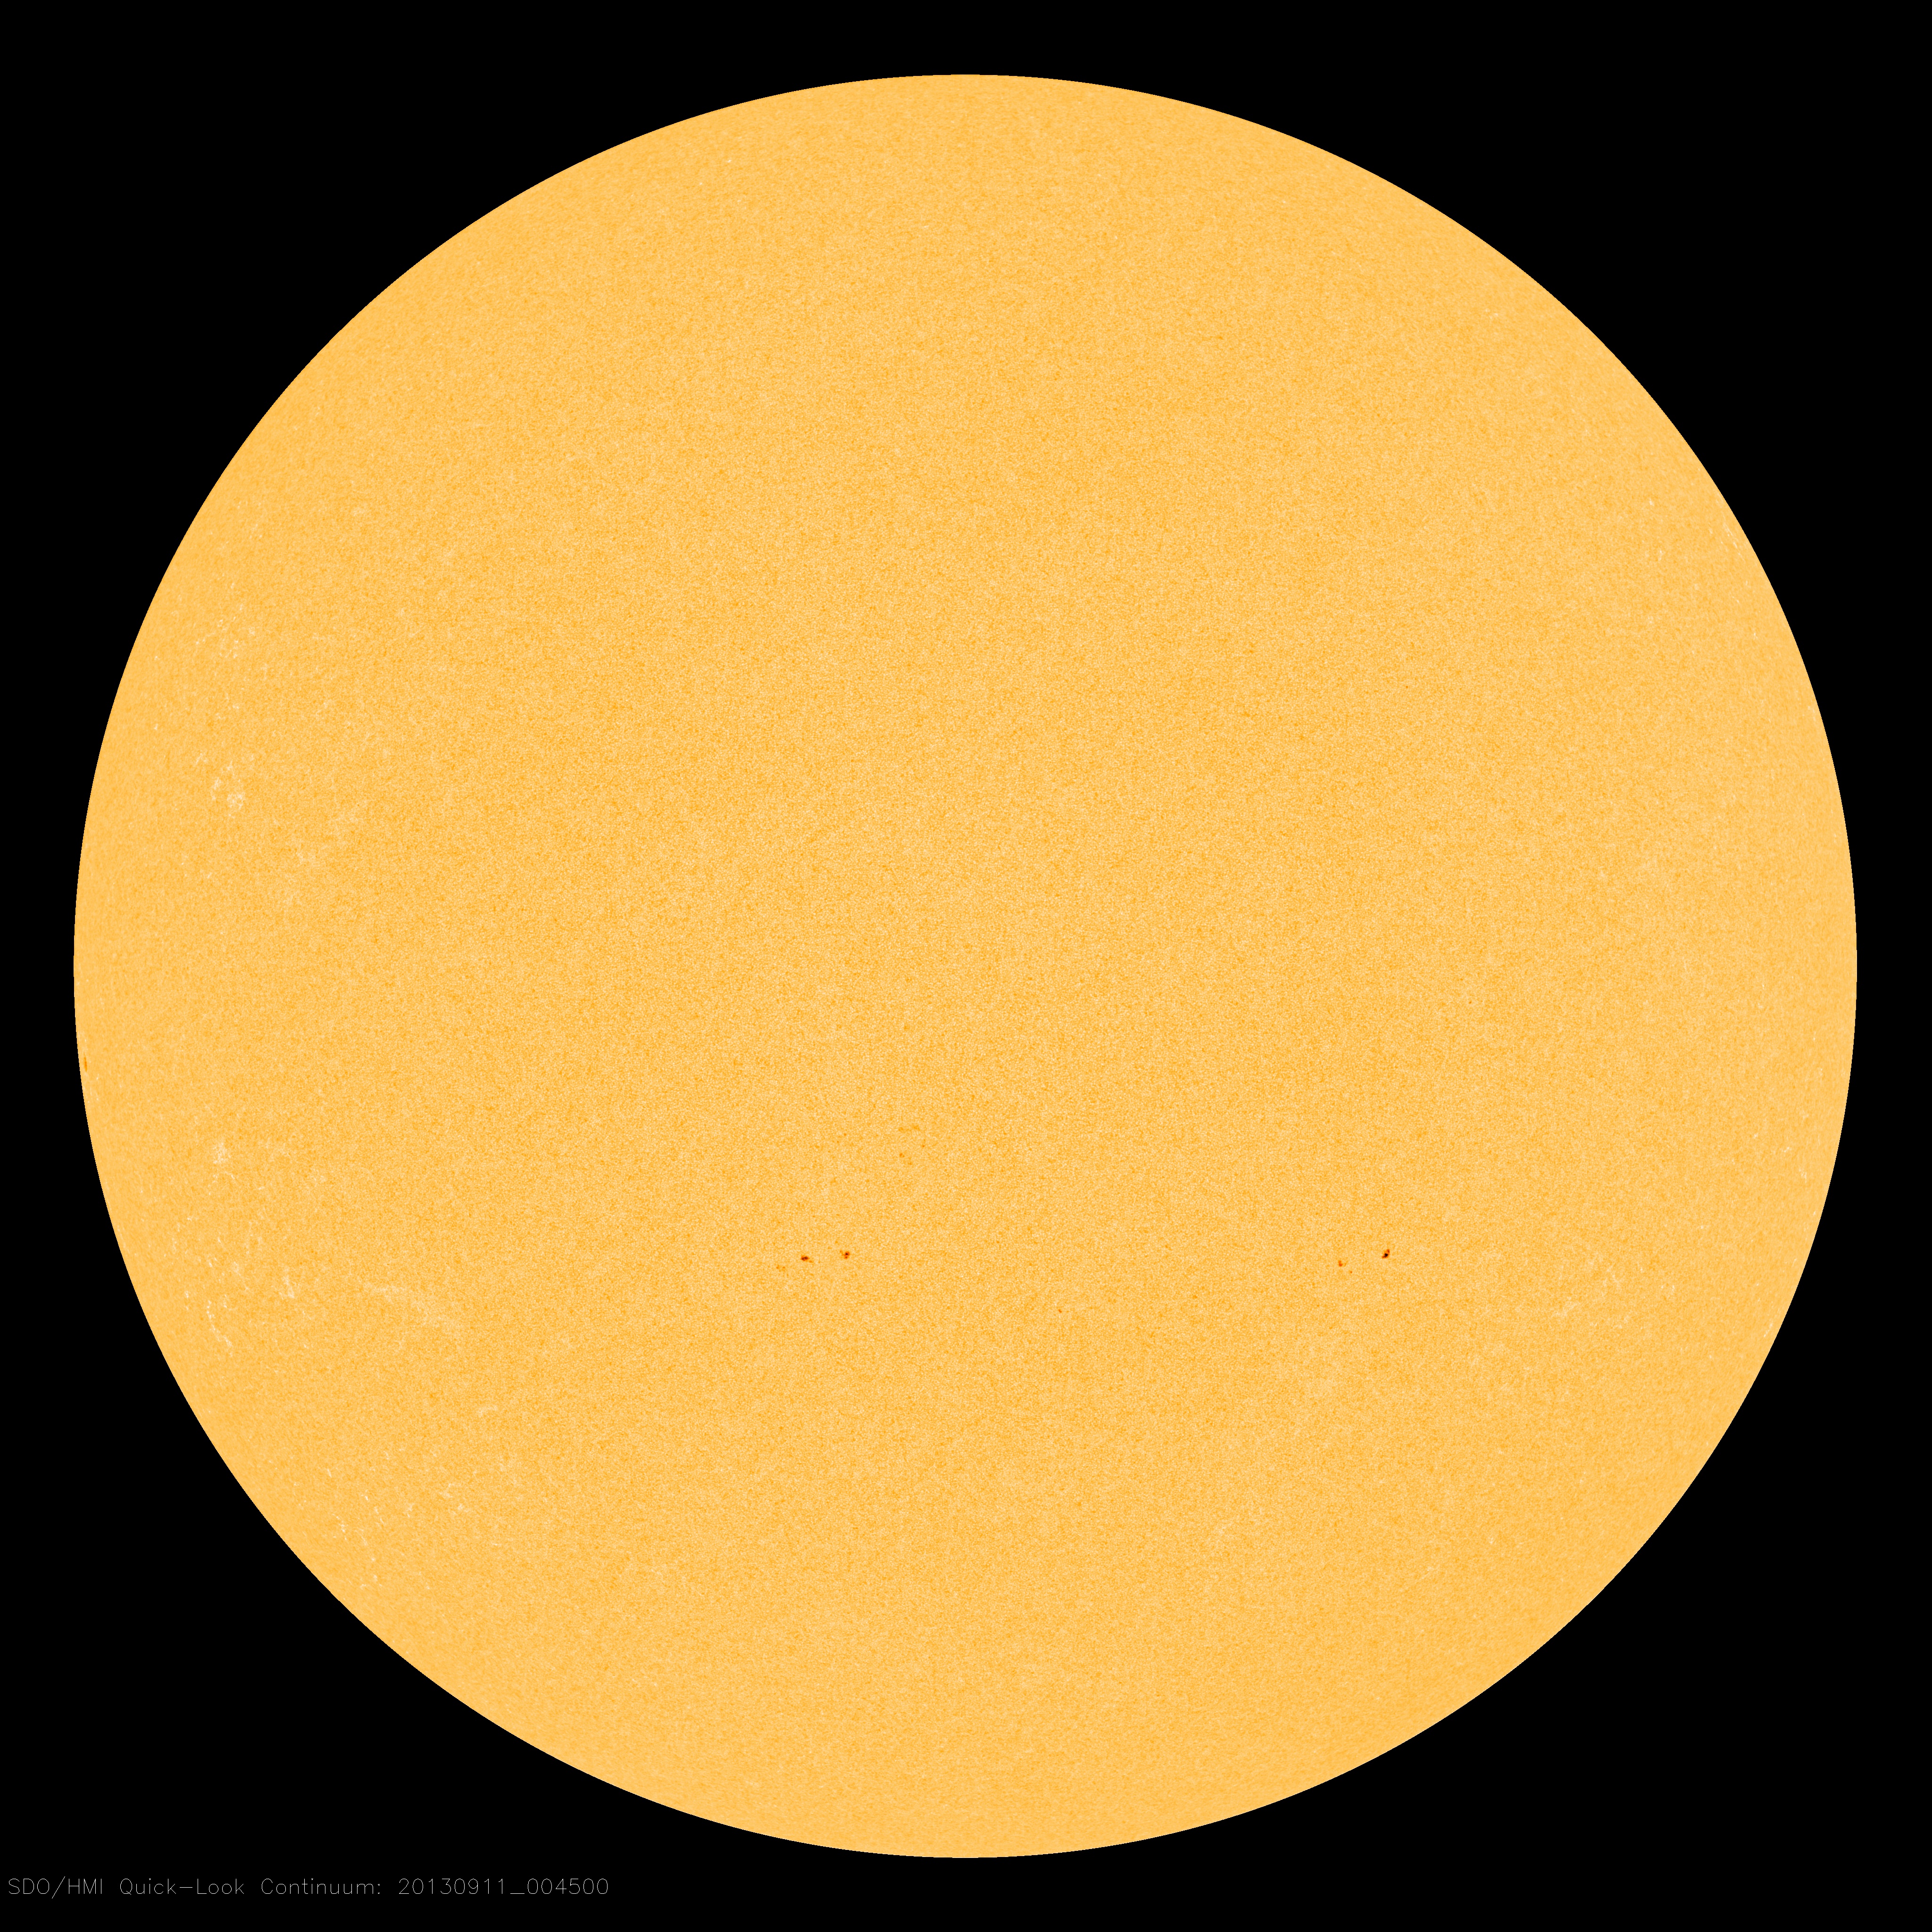
Solar maximum and an almost spotless sun.
========================================================
The AGU turns to lobbying, this was in my Inbox this morning:

================================================================
Traveling today, light blogging expected – Anthony
Richard Barraclough says:
September 11, 2013 at 5:55 pm
Summer solstice. No – only 8 hours earlier, but the logic still applies
The data I found had 2002 summer solstice on June 20, 1:04am EDT and at June 21, 9:24am EDT for 2013. I did not double check these dates. Do you have another reference?
Richard M says:
September 11, 2013 at 3:47 pm
We had this discussion over that tripod/ice out event in Alaska. Let’s not replay that battle all over again. If you must, please use the fall equinox, it’s closer to the peak hurricane season.
And, don’t forget to adjust all high and low records where the time of occurance was know to make it be days since the vernal equinox, when (I think) the Earth is at the astronomical start of the orbit.
Philip Bradley says:
September 11, 2013 at 6:50 pm
Dust absorbs sunlight and heats the middle atmosphere. By letting less light reach the surface, the ocean warms more slowly. Together the reduced temperature gradient bring reduced convection and that makes it harder for a tropical storm to be maintained.
Ric Werme says:
September 11, 2013 at 8:06 pm
The mechanism documented for anthropogenic aerosols is the aerosols act as condensation nuclei and cause cloud formation and precipitation in the outer bands, reducing the amount of WV reaching the central part of the hurricane and thus reducing its intensity. The effect is surprisingly large, documented to reduce hurricane intensity by more than 1 category.
Its a combination of heat and humidity that drives the convection in hurricanes, as it does in tropical thunderstorms.
The reason you don’t hear much about the effect of anthropogenic aerosols on hurricane intensity, is no one wants advertise the fact that cleaner air increases hurricane intensity when a hurricane strikes a large urban area.
Philip Bradley says:
September 11, 2013 at 10:00 pm
The reason you don’t hear much about the effect of anthropogenic aerosols on hurricane intensity, is no one wants advertise the fact that cleaner air increases hurricane intensity when a hurricane strikes a large urban area.
=============
Please stop.
No one is hiding anything about hurricanes.
Better predictions save lives and property.
Sheesh.
Put ‘hurricane strength aerosols’ into google and you will get many links to papers and scientific sources on anthropogenic aerosols and hurricanes, including this from the New Scientist.
Want fewer hurricanes? Pollute the air
http://www.newscientist.com/article/dn23743-want-fewer-hurricanes-pollute-the-air.html#.UjFgpNLTfHY
Make the same search on Google news and you get 1 hit and that is about the effect of Saharan dust.
I tried the same with ‘hurricane intensity anthropogenic aerosols’ and a few other combinations and couldn’t find a single news article that linked anthropogenic aerosols to hurricane frequency or intensity.
It’s obvious why. The AGW crowd has spent years blurring the distinction between CO2 and aerosols/BC. If people realized reduced aerosols were exposing them to more frequent and intense hurricanes, it will make mandating CO2 reductions in the USA a lot harder.
The linear trend that Roger Pielke jr. draws in his chart of Hurricane Landfall intervalls is meaningless. It’s like measuring the number of throws between throwing sixes with a dice. Obviously, the distribution of such intervalls is asymmetric, probably follows a hyperbolic shape in the case of a fair dice. (Ever longer intervals occur with ever smaller probability)
So short intervals will always dominate the trend computation.
@ur momisugly JustThinkin
“How can I say shove CAGW up your butt,in a nice way?”
You can’t – the gubmint don’t do nice…
Richard M:
I’d call it a statistical tie:
Summer Soltice Date/Time (GMT)
2002 June 21 13:24
2013 June 21 05:04
http://www.theguardian.com/news/datablog/2011/jun/21/summer-solstice-data
I was impressed by dr. Pielke’s graph on the hurricane drought. But how about Sandy (2012), doesn’t that one count, and if so why?
Hi Richard M
The solstices, and equinoxes, each get later by almost 6 hours from one year to the next, because the Earth inconveniently doesn’t take a whole number of days to orbit the sun – a fact which has caused various compromises in establishing calendars over the last few thousand years.
Then every 4 years, the leap year pushes them back by a day (less the 6 hours), to keep them all within the same 18 hour period. So the summer solstice spends 3 years on 21st June, and then in leap years pops back to late on the 20th (I’m talking Universal Time, or what used to be Greenwich Mean Time, so other time zones will have an adjustment to make).The autumnal equinox behaves in an (almost) identical way on 22nd and 23rd September.
Sadly, the annual change is not exactly 6 hours, so one leap year every 4 years doesn’t quite do the trick. In successive leap years the whole set of solstice and equinox times moves back by about 45 minutes. The modern (Gregorian) calendar corrects for this by missing out leap years in century years which are not divisible by 400, so 2000 was a leap year, but 2100 won’t be. This should keep the dates in place for several thousand years.
The calendar commissioned by Julius Caesar (the Julian calendar) didn’t have this refinement, and the solstices, etc had moved back by 11 days by the time Pope Gregory had it fixed in 1582.Timing of Atlantic hurricanes, and melting of Alaskan rivers was not the driving force behind his reforms – he was more worried that Easter was being celebrated at the wrong time of year.
Regards
Richard
u.k.(us) says:
September 11, 2013 at 11:00 pm
Please stop.
No one is hiding anything about hurricanes.
Better predictions save lives and property.
I am awaiting your response. Hopefully, without the usual hand waving blather we usually get from Warmists.
AJ says:
September 12, 2013 at 3:16 am
Richard M:
I’d call it a statistical tie:
Summer Soltice Date/Time (GMT)
2002 June 21 13:24
2013 June 21 05:04
Thanks, I went back to my source and discovered it was my own mistake. I had copied the date from the year 2000 instead of 2002.
Colder SST’s means colder air means dryer land means more dusty air means less insolation, means colder SST’s means colder air means… OMG it’s a tipping point! I found the tipping point!
But seriously, dry dusty air over colder SST’s is a hurricane killer. Snuffs them right out. Our current hurricane barely made it to the toddler stage and is now weakening due to the above.
With the birth of Hurricane Humberto the Accumulated Cyclone Energy in the Atlantic basin is really ramping up!
It has got to nearly 14 (10^-4 knots^2). Average season (1951-2000) = 93.2
twil says:
September 12, 2013 at 3:35 am
I was impressed by dr. Pielke’s graph on the hurricane drought. But how about Sandy (2012), doesn’t that one count, and if so why?
The hurricane drought tally is for major hurricane landfalls, Cat 3-5. From what I’ve seen it is a point of contention whether Sandy was even a Cat 1 at landfall.
Dave Wendt says:
September 12, 2013 at 10:15 am
“The hurricane drought tally is for major hurricane landfalls, Cat 3-5. From what I’ve seen it is a point of contention whether Sandy was even a Cat 1 at landfall.”
Sandy was an “extra-tropical” storm when it made landfall in the U.S.
http://www.nhc.noaa.gov/data/tcr/AL182012_Sandy.pdf
“Sandy was a classic late-season hurricane in the southwestern Caribbean Sea. The cyclone made landfall as a category 1 hurricane (on the Saffir-Simpson Hurricane Wind Scale) in Jamaica, and as a 100-kt category 3 hurricane in eastern Cuba before quickly weakening to a category 1 hurricane while moving through the central and northwestern Bahamas. Sandy underwent a complex evolution and grew considerably in size while over the Bahamas, and continued to grow despite weakening into a tropical storm north of those islands. The system re-strengthened into a hurricane while it moved northeastward, parallel to the coast of the southeastern United States, and reached a secondary peak intensity of 85 kt while it turned northwestward toward the mid-Atlantic states. Sandy weakened somewhat and then made landfall as a post-tropical cyclone near Brigantine, New Jersey with 70-kt maximum sustained winds. “
Scratchin’ for ‘canes.
If cooling takes hold, storminess should increase. Won’t that mess with some minds!?
What some seem to refer to as a “fish storm”*.
It’s back to TS status today.
* http://www.storm2k.org/phpbb2/viewtopic.php?f=31&t=37308&view=next
.