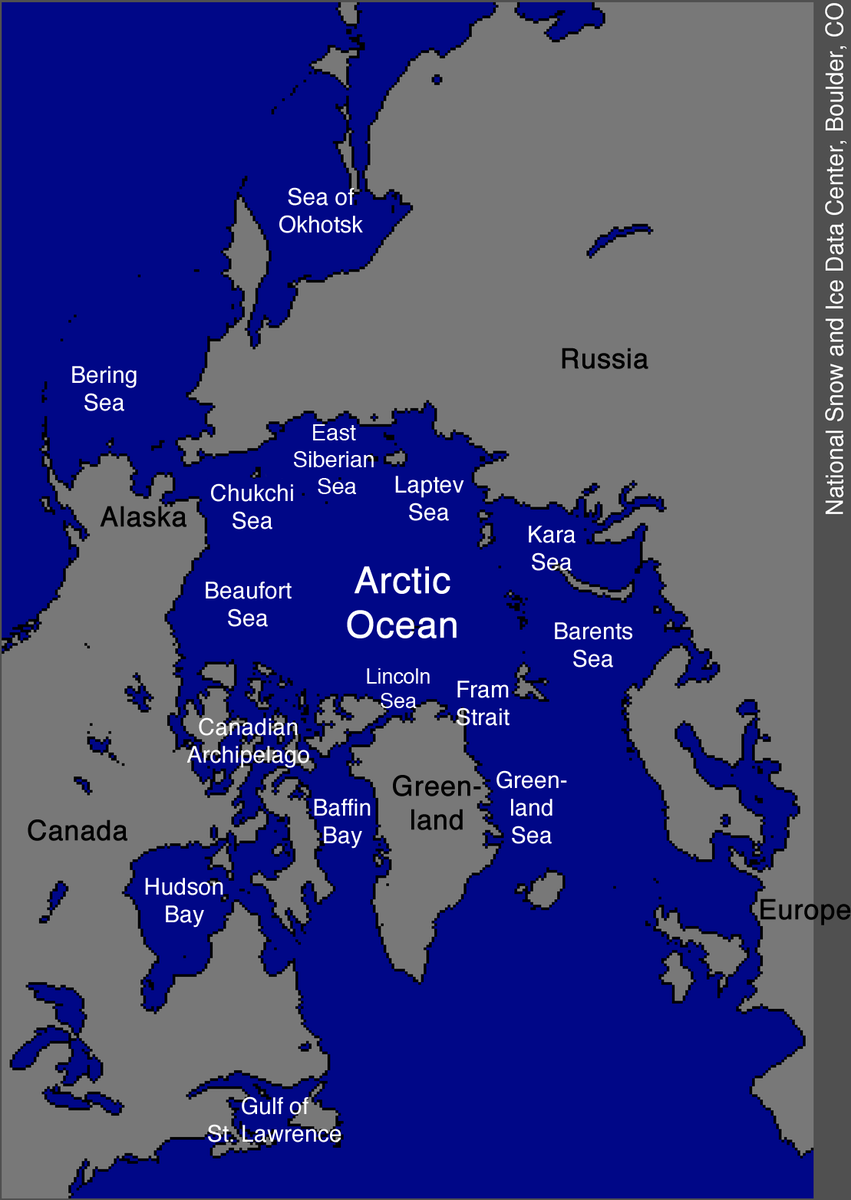
Map of the Arctic – Thanks to REP

NSIDC Sea Ice Index region map – click to explore current conditions by region via NSIDC MASIE
Current regional overviews:
• Zachary Labe – Arctic Sea Ice Extent & Concentration (updated daily)
• NSIDC MASIE – Explore by Region (interactive daily viewer)
• NSIDC ChArctic – Interactive Sea Ice Extent Graph
• ClimatReanalyzer – Daily Sea Ice (NSIDC Sea Ice Index v4)
Arctic Basin – Central Arctic – Baffin Bay / Gulf of St. Lawrence / Newfoundland – Baltic Sea – Barents Sea – Beaufort Sea – Bering Sea – Canadian Archipelago – Chukchi Sea – Cook Inlet – East Siberian Sea – Greenland Sea – Gulf of St. Lawrence – Hudson Bay – Kara Sea – Laptev Sea – Sea of Okhotsk – Yellow Sea
Note on image sources: Live time series charts below are from NSIDC/USNIC MASIE (G02186), updated daily. Charts labeled [Historical record – archived] are snapshots from Cryosphere Today (University of Illinois Polar Research Group), which ceased active updates. They are preserved here as long-record reference images.
Arctic Basin
Note: MASIE provides 16 individual Arctic sub-region charts. For the full Arctic Basin total, see the NSIDC ChArctic interactive tool or Zachary Labe’s Arctic extent page.

Cryosphere Today – University of Illinois – Polar Research Group [Historical record – archived] – Click to view current data at NSIDC

Cryosphere Today – University of Illinois – Polar Research Group [Historical record – archived] – Click to view current data at NSIDC
Central Arctic
Live – MASIE Daily Time Series (r11):

NSIDC/USNIC MASIE (G02186) – Updated daily – Credit: NSIDC/USNIC MASIE product – Click to explore by region
Baffin Bay / Gulf of St. Lawrence / Newfoundland Bay
Live – MASIE Daily Time Series (r08):

NSIDC/USNIC MASIE (G02186) – Updated daily – Credit: NSIDC/USNIC MASIE product – Click to explore by region

Cryosphere Today – University of Illinois – Polar Research Group [Historical record – archived]

Cryosphere Today – University of Illinois – Polar Research Group [Historical record – archived]

Cryosphere Today – University of Illinois – Polar Research Group [Historical record – archived]
Baltic Sea
Live – MASIE Daily Time Series (r13):

NSIDC/USNIC MASIE (G02186) – Updated daily – Credit: NSIDC/USNIC MASIE product – Click to explore by region
Barents Sea
Live – MASIE Daily Time Series (r06):

NSIDC/USNIC MASIE (G02186) – Updated daily – Credit: NSIDC/USNIC MASIE product – Click to explore by region

Cryosphere Today – University of Illinois – Polar Research Group [Historical record – archived]

Cryosphere Today – University of Illinois – Polar Research Group [Historical record – archived]
Beaufort Sea
Live – MASIE Daily Time Series (r01):

NSIDC/USNIC MASIE (G02186) – Updated daily – Credit: NSIDC/USNIC MASIE product – Click to explore by region

Cryosphere Today – University of Illinois – Polar Research Group [Historical record – archived]

Cryosphere Today – University of Illinois – Polar Research Group [Historical record – archived]
Bering Sea
Live – MASIE Daily Time Series (r12):

NSIDC/USNIC MASIE (G02186) – Updated daily – Credit: NSIDC/USNIC MASIE product – Click to explore by region

Cryosphere Today – University of Illinois – Polar Research Group [Historical record – archived]

Cryosphere Today – University of Illinois – Polar Research Group [Historical record – archived]
Canadian Archipelago
Live – MASIE Daily Time Series (r09):

NSIDC/USNIC MASIE (G02186) – Updated daily – Credit: NSIDC/USNIC MASIE product – Click to explore by region

Cryosphere Today – University of Illinois – Polar Research Group [Historical record – archived]

Cryosphere Today – University of Illinois – Polar Research Group [Historical record – archived]
Chukchi Sea
Live – MASIE Daily Time Series (r02):

NSIDC/USNIC MASIE (G02186) – Updated daily – Credit: NSIDC/USNIC MASIE product – Click to explore by region

Cryosphere Today – University of Illinois – Polar Research Group [Historical record – archived]

Cryosphere Today – University of Illinois – Polar Research Group [Historical record – archived]
Cook Inlet
Live – MASIE Daily Time Series (r16):

NSIDC/USNIC MASIE (G02186) – Updated daily – Credit: NSIDC/USNIC MASIE product – Click to explore by region
For additional Cook Inlet sea ice conditions: NOAA National Weather Service – Alaska Forecast Office
East Siberian Sea
Live – MASIE Daily Time Series (r03):

NSIDC/USNIC MASIE (G02186) – Updated daily – Credit: NSIDC/USNIC MASIE product – Click to explore by region

Cryosphere Today – University of Illinois – Polar Research Group [Historical record – archived]

Cryosphere Today – University of Illinois – Polar Research Group [Historical record – archived]
Greenland Sea
Live – MASIE Daily Time Series (r07):

NSIDC/USNIC MASIE (G02186) – Updated daily – Credit: NSIDC/USNIC MASIE product – Click to explore by region

Cryosphere Today – University of Illinois – Polar Research Group [Historical record – archived]

Cryosphere Today – University of Illinois – Polar Research Group [Historical record – archived]
Gulf of St. Lawrence
Gulf of St. Lawrence sea ice is included within the Baffin Bay / Gulf of St. Lawrence (r08) MASIE region above. For dedicated Gulf of St. Lawrence ice charts and forecasts, see the Environment and Climate Change Canada – Canadian Ice Service.
Hudson Bay
Live – MASIE Daily Time Series (r10):

NSIDC/USNIC MASIE (G02186) – Updated daily – Credit: NSIDC/USNIC MASIE product – Click to explore by region

Cryosphere Today – University of Illinois – Polar Research Group [Historical record – archived]

Cryosphere Today – University of Illinois – Polar Research Group [Historical record – archived]
Kara Sea
Live – MASIE Daily Time Series (r05):

NSIDC/USNIC MASIE (G02186) – Updated daily – Credit: NSIDC/USNIC MASIE product – Click to explore by region

Cryosphere Today – University of Illinois – Polar Research Group [Historical record – archived]

Cryosphere Today – University of Illinois – Polar Research Group [Historical record – archived]
Laptev Sea
Live – MASIE Daily Time Series (r04):

NSIDC/USNIC MASIE (G02186) – Updated daily – Credit: NSIDC/USNIC MASIE product – Click to explore by region

Cryosphere Today – University of Illinois – Polar Research Group [Historical record – archived]

Cryosphere Today – University of Illinois – Polar Research Group [Historical record – archived]
Sea of Okhotsk
Live – MASIE Daily Time Series (r14):

NSIDC/USNIC MASIE (G02186) – Updated daily – Credit: NSIDC/USNIC MASIE product – Click to explore by region

Cryosphere Today – University of Illinois – Polar Research Group [Historical record – archived]

Cryosphere Today – University of Illinois – Polar Research Group [Historical record – archived]
Yellow Sea
Live – MASIE Daily Time Series (r15):

NSIDC/USNIC MASIE (G02186) – Updated daily – Credit: NSIDC/USNIC MASIE product – Click to explore by region
For additional Yellow Sea ice conditions: Japan Meteorological Agency | NERSC Arctic ROOS – Regional Variability
Source Guide
NSIDC/USNIC – Multisensor Analyzed Sea Ice Extent – Northern Hemisphere (MASIE-NH) — Primary source for all live regional time series on this page
Home Page – https://nsidc.org/data/masie
Explore by Region (Interactive) – https://nsidc.org/data/masie/explore-region
Data & Plots Directory – https://masie_web.apps.nsidc.org/pub/DATASETS/NOAA/G02186/plots/
All-Years Extent CSV – https://masie_web.apps.nsidc.org/pub/DATASETS/NOAA/G02186/masie_4km_allyears_extent_sqkm.csv
Citation: U.S. National Ice Center, Fetterer, F., Savoie, M., Helfrich, S. & Clemente-Colón, P. (2010, updated daily). MASIE-NH (G02186). NSIDC. doi:10.7265/N5GT5K3K
National Snow and Ice Data Center (NSIDC) – Sea Ice Index v4
Home Page – https://nsidc.org/
Sea Ice Index – https://nsidc.org/data/seaice_index
ChArctic Interactive Graph – https://nsidc.org/sea-ice-today/sea-ice-tools/charctic-interactive-sea-ice-graph
Sea Ice Today – https://nsidc.org/sea-ice-today
Zachary Labe – Arctic Sea Ice Visualizations (NSIDC Sea Ice Index v4, updated daily)
Arctic Sea Ice Extent & Concentration – https://zacklabe.com/arctic-sea-ice-extentconcentration/
Regional extent map – https://zacklabe.com/wp-content/uploads/2022/08/b203f-nsidc_mapseas.png
ClimatReanalyzer – Daily Sea Ice (powered by NSIDC Sea Ice Index v4)
https://climatereanalyzer.org/clim/seaice_daily/
Nansen Environmental and Remote Sensing Center (NERSC) – Arctic ROOS
Home Page – https://arctic-roos.org/
Sea Ice Area and Extent – https://arctic-roos.org/observations/satellite-data/sea-ice/ice-area-and-extent-in-arctic
Regional Variability – https://arctic-roos.org/observations/satellite-data/sea-ice/sea-ice-variability-in-regions
Environment and Climate Change Canada – Canadian Ice Service
Latest Conditions – https://www.canada.ca/en/environment-climate-change/services/ice-forecasts-observations/latest-conditions.html
Cryosphere Today – University of Illinois Polar Research Group (archived — no longer actively updated)
Archive – https://arctic.atmos.uiuc.edu/cryosphere/
Image Archive – https://arctic.atmos.uiuc.edu/cryosphere/IMAGES/
Is there any data on the ice in the Northwest Passage? I have a bet, and Environment Canada has stopped giving the data.
Jim Cripwell says: August 25, 2013 at 2:31 pm
Is there any data on the ice in the Northwest Passage? I have a bet, and Environment Canada has stopped giving the data.
This blog offers a stream of reports summarizing the conditions encountered by those attempting to navigate it;
http://northwestpassage2013.blogspot.com/
Anthony you have to add all the links Neven has listed here..
https://sites.google.com/site/arcticseaicegraphs/
He did not have very nice things to say about you in is past the other day.
Jim Cripwell says:
August 25, 2013 at 2:31 pm
Is there any data on the ice in the Northwest Passage? I have a bet, and Environment Canada has stopped giving the data.
Here is Environment Canada web site for daily and weekly ice updates..
http://www.ec.gc.ca/glaces-ice/default.asp
They do have new notice up,
Please note the Canadian Ice Service (CIS) is modifying several of its web pages to meet the international Web Content Accessibility Guidelines (WCAG). We apologize for the inconvenience this may cause
New Data Picture of the Arctic Ice coverage from E. Canada.
https://twitter.com/NJSnowFan/status/372338435815518209/photo/1
I suggest that, in the Reference Page drop-down list, this page be listed adjacent to the Sea Ice page.
rogerknights says: September 3, 2013 at 9:08 am
I suggest that, in the Reference Page drop-down list, this page be listed adjacent to the Sea Ice page.
Done, thanks.
There seems to be a lot of broken links on the main sea ice page at the moment. Is it just a coincidence or am I getting paranoid?
Bloke down the pub says: September 7, 2013 at 3:59 am
There seems to be a lot of broken links on the main sea ice page at the moment. Is it just a coincidence or am I getting paranoid?
The U.S. Navy’s, Naval Research Laboratory, HYCOM Consortium for Data-Assimilative Ocean Modeling site;
http://www7320.nrlssc.navy.mil/hycomARC/
has been “down for maintenance” for several days. Similar to JAXA update;
http://wattsupwiththat.com/2013/09/06/jaxa-timing-worst-ever-switching-arctic-sea-ice-software-right-as-the-minimum-is-about-to-happen/
the timing is odd, given the impending minimum.
re. JAXA moving the goal posts :
Their attempt at rewriting the data record seems to be totally unfounded, being based on applying techniques for newer, more precise satellites to data from older instruments. This leads to a sizeable changes that increase past decadal averages. Yet another dataset falls victim to non science motivated “corrections”.
I go into this in more detail at Lucia’s:
http://rankexploits.com/musings/2013/september-nsidc-prediction/#comment-119346
Here’s a more objective way to compare successive years. I use a low-pass filter to remove short term ‘weather’ noise. This result uses ALL the daily data.
Here I looked at all years since 2005 on a spaghetti plot and retained the two nearest to this years trace. 2013 so far is bounded by the data of 2008 and 2009.
http://climategrog.wordpress.com/?attachment_id=439
So far since 2005 , 05,06,09 had more ice than 2013, 08,11,12 had less.
justthefactswuwt , if you want to add that graph to this page, I can provide scripts to reproduce it.
I also have a fully interactive SVG version will all years since 2005. That format can be zoomed in and each year toggled on/off in the browser. I’ve had to arrange for this to be hosted outside my usual WordPress site since I can’t seem to upload svg format.
http://piments.com/svg/arctic_ice_annual_smoothed.svg
If that is possible on WUWT’s new ‘executive’ hosting options it would be a neat addition.
contact me if you want to know how to reproduce that. 😉
I have a book at home called “Wilkie’s Weather” which was written in 1976 by a then famous Australian meteorologist called Alan Wilkie. It contains the following paragraph:
“In a previous chapter we saw that a very useful tool came into our possession in 1960 and that was the weather satellite. The picture of the earth taken by these satellites show ice and snow areas (as distinct from cloud) and after an examination of tens of thousands of pictures taken between 1960 and 1970 it has been established that the north polar ice cap has spread over an additional area of some 4 million square kilometres, which is thought-provoking to say the least, as it is an increase of 12% in ten years!”
I’m wondering if you know (or can find out) how the current amount of snow and ice compares to what it was in 1960.
I have 95% a confidence level that there will be a record refreeze in the arctic this year…
a 95% confidence level – Duh…
Susie says:
September 30, 2013 at 3:51 am
“I have a book at home called “Wilkie’s Weather” which was written in 1976 by a then famous Australian meteorologist called Alan Wilkie. It contains the following paragraph:
“In a previous chapter we saw that a very useful tool came into our possession in 1960 and that was the weather satellite. The picture of the earth taken by these satellites show ice and snow areas (as distinct from cloud) and after an examination of tens of thousands of pictures taken between 1960 and 1970 it has been established that the north polar ice cap has spread over an additional area of some 4 million square kilometres, which is thought-provoking to say the least, as it is an increase of 12% in ten years!”
I’m wondering if you know (or can find out) how the current amount of snow and ice compares to what it was in 1960.”
The secret of knowing actual climate history back then is indeed to look at what was published before the political era.
A huge 1960s rise in arctic ice is seen in a plot from a Russian-source archive in the second link in my subsequent post, while the first link is an example of how that history has been rewritten and deleted from the version published by the Cryosphere Today plot source on this page.
Cryosphere Today, the source of most of these plots, also publishes a hockey stick version of sea ice history extending further back, with magical flatness pre-1950, as if such actually occurs in the messy real world of nature outside the CAGW narrative of climate not changing before modern world economic development. That can be seen at http://arctic.atmos.uiuc.edu/cryosphere/IMAGES/seasonal.extent.1900-2007.jpg
When compared to actual archival history then in utter contrast (as in both the graphs and references about 3/4ths of the way down within http://img250.imagevenue.com/img.php?image=45311_expanded_overview2_122_15lo.jpg ), such implies that funded source of sleek plots, the Cryosphere Today public education/outreach (propaganda) site, has been compromised by enviro-activists acting at a frequent level of honesty for their particular subgroup of the population. Such is not shocking for a UIUC website which links to other CAGW movement websites while never linking to inconvenient ones.
I deliberately use the word compromised. It is a word sometimes used by military intelligence professionals having the right non-naive attitude in other context: If a source is known to have sent deliberately false data and done so with cunning and subtlety (as all the best liars know the most effective lie has mixed in some partial truth — or partial real data but a moderate percentage adjustment in trends etc), you shouldn’t auto-trust them on other claims without very explicit disclaimers.
A saying goes: “Fool me once, shame on you. Fool me twice, shame on me.”
I don’t know a saying for “fool me XY times in a row because it never occurs to me that known past lies should make me skeptical about other claims.”
Pointing this out is not an implausible “conspiracy theory” strawman as claimed in a typical argumentative response of defenders of enviro-activist groups: Outright conspiracies are rare in the real world when taking formal organization, when on something which would collapse with any or a few dissenting “whistleblowers,” and when against the inclinations of the majority in the group. None of those imply here. In contrast, activists acting on their natural inclinations and copying their heroes like Ehrlich & Mann & Hansen is just natural (not appropriate to call a conspiracy unless “used car salesmen” or “lawyers” or “politicians” would be called a conspiracy just because not always honest when counterproductive to their desires), while the CAGW movement has quite survived thousands of dissenting scientists.
The only magnitude to which they may be trusted (with heavy disclaimers foremost) is to the degree they are constrained by too blatant other observations, although such as cross-comparison to aerial photos is more complicated than it might seem when ice area isn’t just continuous. (For instance, generally the CAGW movement BSes even far more about sea ice volume than sea ice area, since the former is less cross-checkable, much like they go hogwild on unverifiable deep ocean average temperature trends while rewriting surface temperature plots too but more subtly).
Was looking at the .ijis.iarc site and though I can see 2014 and 2012, it seems that 2013 was removed from the graph. Flipped over to the NSIDC site and 2013 is conveniently omitted from that site also.
The Government wouldn’t be attempting to filter the data to tell the story that they want.
/sarc
Read about jet streams being accelerated by mid-latitude oxygen/ozone conversion which extends Rossby wave meander loops. Study the new theory on your desktop at this dedicated website:
https://www.harrytodd.org
This page has no images for me at all except the first one???