Please note that WUWT cannot vouch for the accuracy of the data within this page, as all of the data is linked from third party sources and WUWT is simply an aggregator.
Atmospheric Temperatures:
UAH Lower Atmosphere Temperature Anomalies – 1979 to Present

Surface Temperature, US. Climate Reference Network, 2005 to present:

UAH Lower Atmosphere Temperature Anomalies – 1979 to Present

RSS Temperature Lower Troposphere (TLT) – Brightness Temperature Anomaly – 1979 to Present

Note: Per John Christy, RSS and UAH anomalies are not comparable because they use different base periods, i.e., “RSS only uses 1979-1998 (20 years) while UAH uses the WMO standard of 1981-2010.”
RSS Temperature Middle Troposphere (TMT) – Brightness Temperature Anomaly – 1979 to Present

Temperature Troposphere / Stratosphere (TTS) – Brightness Temperature Anomaly – 1987 to Present

Temperature Lower Stratosphere (TLS) – Brightness Temperature Anomaly – 1979 to Present

Global Surface Temperatures:
Monthly Mean Surface Temperature Anomaly – 1996 to Present
Annual Global Mean Temperature Anomaly Over Land & Sea – 1880 to Present

Annual Global Average Land and Ocean Temperature Anomaly – 1850 to 2012

Monthly Global Average Land Temperature – 1850 to Present

HadCRUT4 Global, Northern and Southern Hemispheric Temperature Anomalies

Ocean Temperature:
Global Sea Surface Temperature Anomaly – NCDC

Global Sea Surface Temperature Anomaly – HadSST2 and HadSST3

Global Sea Surface Temperature Anomaly – Monthly

Global Sea Surface Temperature

Global Sea Surface Temperature Animation – 30 Days Including 7 Day Forecast

Global Sea Surface Temperature – 3 Months – NOAA:
http://www.cpc.ncep.noaa.gov/products/analysis_monitoring/enso_update/gsstanim.gif
Global Sea Surface Temperature – 12 Months – Naval Research Laboratory (NRL):
http://www7320.nrlssc.navy.mil/GLBhycom1-12/navo/globalsst_nowcast_anim365d.gif
Custom Sea Surface Temperature Mapping Tool – from 1981 – NOAA:
http://www.cpc.ncep.noaa.gov/products/GODAS/mnth_movie.shtml
Equatorial Pacific Sea Surface Temperature – 30 Days Including 7 Day Forecast

Equatorial Pacific Sea Surface Temperature – NOAA – 3 Months:
http://www.cpc.ncep.noaa.gov/products/analysis_monitoring/enso_update/sstanim.gif
Equatorial Pacific Sea Surface Temperature Anomalies – BoM – 3 Months:
http://www.bom.gov.au/climate/enso/surface_anim.gif
Equatorial Pacific Sea Surface Temperature – 1 Year Including 7 Day Forecast:
http://www7320.nrlssc.navy.mil/GLBhycom1-12/navo/equpacsst_nowcast_anim365d.gif
Ocean Subsurface Temperature:
BoM Global Subsurface Average Temperature and Anomalies at 150 Meters:

BoM Global Subsurface Average Temperature and Anomalies at 400 Meters:

BoM Monthly Subsurface Pacific Ocean Equatorial Temperature Anomalies down to 400 Meters:

BoM 5 Day Subsurface Pacific Ocean Equatorial Temperature Means and Anomalies down to 500 Meters:

Global Ocean Heat Content – 0-700 Meters – 1955 to Present

Accumulated Cyclone Energy
Global Tropical Cyclone Accumulated Cyclone Energy – 1970 to Present

Northern Hemisphere Temperatures:
Northern Hemisphere Temperature Lower Troposphere (TLT) 1979 to Present

Northern Hemisphere Surface Temperatures

Northern Hemisphere Sea Surface Temperature

RSS Northern Polar Temperature Lower Troposphere (TLT) – 1979 to Present

Mean Temperature above 80°N

Southern Hemisphere Temperatures:
Southern Hemisphere Temperature Lower Troposphere (TLT) 1979 to Present
 - 1979 to Present")
RSS Southern Polar Temperature Lower Troposphere (TLT) – 1979 to Present

Shortlink for this page, suitable for blog posts and Twitter feeds:
Source Guide:
Australian Bureau of Meteorology (BOM):
Home Page – http://www.bom.gov.au/
Climate Page – http://www.bom.gov.au/climate/
ENSO Page – http://www.bom.gov.au/climate/enso/
Center for Ocean-Atmospheric Prediction Studies (COAPS), Florida State University – Ryan N. Maue PhD – Environmental Prediction (NCEP) – Global Forecast System (GFS)
Home Page –http://www.coaps.fsu.edu/index.shtml
Products Page – http://www.coaps.fsu.edu/~maue/weather/
Data Page – http://www.coaps.fsu.edu/~maue/extreme/gfs/current/
Cryosphere Today – Arctic Climate Research at the University of Illinois:
Home Page – http://arctic.atmos.uiuc.edu/
Products Page – http://arctic.atmos.uiuc.edu/cryosphere/
Images Indexed By Date – http://arctic.atmos.uiuc.edu/cryosphere/IMAGES/
DrRoySpencer.com – Dr. Roy Spencer
Home Page – http://www.drroyspencer.com/
Current Temperature Page – http://www.drroyspencer.com/latest-global-temperatures/
Uploads Page – http://www.drroyspencer.com/wp-content/uploads/
Danish Meteorological Institute (DMI) – Centre for Ocean and Ice
http://ocean.dmi.dk/english/index.php
http://ocean.dmi.dk/arctic/index.uk.php
climate4you.com – Ole Humlum
Home Page –http://climate4you.com/
Ole Humlum Bibliography – http://climate4you.com/Text/BIBLIOGRAPHY%20OLE%20HUMLUM.pdf
Center for Ocean-Atmospheric Prediction Studies (COAPS), Florida State University – Ryan N. Maue PhD – Environmental Prediction (NCEP) – Global Forecast System (GFS)
Home Page –http://www.coaps.fsu.edu/index.shtml
Products Page – http://www.coaps.fsu.edu/~maue/weather/
Data Page – http://www.coaps.fsu.edu/~maue/extreme/gfs/current/
Met Office – Hadley Center
Home Page – http://www.metoffice.gov.uk/
Products Page – http://www.metoffice.gov.uk/hadobs/
Global Temperature Products Page – Products Page – http://www.metoffice.gov.uk/hadobs/hadcrut3/diagnostics/comparison.html
National Oceanic & Atmospheric Administration (NOAA) – Climate Prediction Center (CPC)
Home Page – http://www.cpc.ncep.noaa.gov/
Products Page – http://www.cpc.ncep.noaa.gov/products/
Monitoring and Data Products Page – http://www.cpc.ncep.noaa.gov/products/MD_index.shtml
Atmospheric & SST Indices Page – http://www.cpc.ncep.noaa.gov/data/indices/
Regional Climate Maps – http://www.cpc.ncep.noaa.gov/products/analysis_monitoring/regional_monitoring/
Monitoring and Data Page – http://www.cpc.ncep.noaa.gov/products/monitoring_and_data/
FTP Page – ftp://ftp.cpc.ncep.noaa.gov/
National Oceanic & Atmospheric Administration – (NOAA) – Environmental Modeling Center (EMC)
Home Pagehttp://www.emc.ncep.noaa.gov/
National Oceanic and Atmospheric Administration (NOAA) – Earth System Research Laboratory (ESRL)
Home Page – http://www.esrl.noaa.gov/
Physical Sciences Division (PSD) Products Page – http://www.esrl.noaa.gov/psd/products/
Physical Sciences Division (PSD) Data Data Page – http://www.esrl.noaa.gov/psd/data/
Physical Sciences Division (PSD) Data Maps Page – http://www.esrl.noaa.gov/psd/map/
National Aeronautics and Space Administration (NASA) Goddard Institute for Space Studies (GISS)
Home Page – http://data.giss.nasa.gov/gistemp/
Products – http://data.giss.nasa.gov/
National Oceanic and Atmospheric Administration (NOAA) – National Operational Hydrologic Remote Sensing Center (NOHRSC)
Home Page – http://www.nohrsc.noaa.gov/
Snow Analysis Page –http://www.nohrsc.noaa.gov/nsa/
Forecasts – http://www.nohrsc.noaa.gov/forecasts/
National Oceanic and Atmospheric Administration (NOAA) – National Ice Center (NATICE):
Home Page – http://www.natice.noaa.gov/mission.html?bandwidth=high
Products Page – http://www.natice.noaa.gov/products/products_on_demand.html?bandwidth=high
National Oceanic and Atmospheric Administration (NOAA) – National Climatic Data Center (NCDC)
Home Page – http://www.ncdc.noaa.gov/oa/about/about.html?bandwidth=high
Products Page – http://www.ncdc.noaa.govgov/oa/ncdc.html?bandwidth=high
FTP Page – http://www1.ncdc.noaa.gov/pub/data/cmb/?bandwidth=high
National Oceanic & Atmospheric Administration – (NOAA) – National Oceanographic Data Center (NODC)
Home Pagehttp://www.nodc.noaa.gov/
Products Page – http://www.nodc.noaa.gov/General/NODC-About/NODC-Major-Products.html
Data Page – http://www.nodc.noaa.gov/General/getdata.html
Heat Content Page – http://www.nodc.noaa.gov/OC5/3M_HEAT_CONTENT/
Naval Research Laboratory (NRL) Monterey Marine Meteorology Division
Home Page – http://www.nrlmry.navy.mil/
Products Page – http://www.nrlmry.navy.mil/proddemo.htm
Satellite Products Page- http://www.nrlmry.navy.mil/sat_products.html
NOGAPS Forcast Products Page – http://www.nrlmry.navy.mil/metoc/nogaps/NOGAPS_global_net.html
Data Page – http://www.nrlmry.navy.mil/archdat/
Multi-view – http://www.nrlmry.navy.mil/sat-bin/global.cgi
Navel Coasal Ocean Model – http://www7320.nrlssc.navy.mil/global_ncom/
FTP Page – http://www7320.nrlssc.navy.mil/global_ncom/Links/
FTP Page Global – http://www7320.nrlssc.navy.mil/global_ncom/Links/glb/
Remote Sensing Systems (RSS)
Home Page – http://ssmi.com/?bandwidth=high
MSU Page – http://ssmi.com/msu/msu_browse.html?bandwidth=high
MSU FTP Page – ftp://ftp.ssmi.com/msu/?bandwidth=high
FTP Page – ftp://ftp.ssmi.com/?bandwidth=high
Rutgers University – Global Snow Lab (GSL)
Home Page – http://climate.rutgers.edu/snowcover/index.php?bandwidth=high
Products Page – http://climate.rutgers.edu/snowcover/chart_seasonal.php?ui_set=eurasia&ui_season=1?bandwidth=high
University of Colorado at Boulder
Home Page – http://sealevel.colorado.edu/
Sea Level Calibration Page: http://sealevel.colorado.edu/content/calibration
Sea Level Release Notes Page: http://sealevel.colorado.edu/content/release-notes
Temperature Results Page – http://sealevel.colorado.edu/results.php
FTP Page – http://sealevel.colorado.edu/current/
University of East Anglia (UEA) – Climatic Research Unit (CRU)
Home Page – http://www.cru.uea.ac.uk/
Data Page – http://www.cru.uea.ac.uk/data
Additional Resources:
University of Alabama at Huntsville – Distributed Information Services for Climate and Ocean Products and Visualizations for Earth Research (DISCOVER) Project:
Home Page – http://discover.itsc.uah.edu/
Temperature Page – http://discover.itsc.uah.edu/amsutemps/amsutemps.html
Global Temp Page – http://discover.itsc.uah.edu/amsutemps/
Sea Surface Temperature Page – http://discover.itsc.uah.edu/amsutemps/execute.csh?amsutemps+001
Temperature 14,000 feet Page: – http://discover.itsc.uah.edu/amsutemps/execute.csh?amsutemps+002
Temperature 25,000 feet Page – http://discover.itsc.uah.edu/amsutemps/execute.csh?amsutemps+003
Temperature 36,000 feet Page: – http://discover.itsc.uah.edu/amsutemps/execute.csh?amsutemps+004
Temperature 46,000 feet Page – http://discover.itsc.uah.edu/amsutemps/execute.csh?amsutemps+005
Temperature 56,000 feet Page: – http://discover.itsc.uah.edu/amsutemps/execute.csh?amsutemps+006
Temperature 68,000 feet Page – http://discover.itsc.uah.edu/amsutemps/execute.csh?amsutemps+007
Temperature 82,000 feet Page: – http://discover.itsc.uah.edu/amsutemps/execute.csh?amsutemps+008
Temperature 102,000 feet Page – http://discover.itsc.uah.edu/amsutemps/execute.csh?amsutemps+009
Temperature 118,000 feet Page: – http://discover.itsc.uah.edu/amsutemps/execute.csh?amsutemps+010
Temperature 135,000 feet Page – http://discover.itsc.uah.edu/amsutemps/execute.csh?amsutemps+011
Thank you for making this compilation available.
Any time I see historical records that show the 1930s as cooler than today… I am skeptical.
EPA “Disappears” the 1930s Drought and Heat Wave Climate Data – Watts Up With That?
I also noticed the charts that didn’t have biased/adjusted ground station data conveniently start at the end of 1970’s cold period. Those Globull Warming Alarmists are tricky folks.
Maybe the graph in the “CRU Information Sheet no. 1: Global Temperature Record” (Dr. Phil Jones), at http://www.cru.uea.ac.uk/cru/info/warming/ should be included?
Thanks Anthony, great work!
The above gives a lot on nice information. I am a dabbler, not very knowledgeable, and I am usually only interested in the global results for a month or year(the numbers). The following URL’s are implicit or explicit above but some readers might find them helpful when gathered. These are the only ones I know of—please correct me if I have misinterpreted something or omitted some interdependent source.
1)Hadley Centre.
http://www.cru.uea.ac.uk/cru/data/temperature/hadcrut3gl.txt [gives monthly(first 12 columns) and yearly global(last column)]
http://www.cru.uea.ac.uk/cru/data/temperature/ [page with links to various Hadley Centre data sets]
2)GISS-NASA
http://data.giss.nasa.gov/gistemp/tabledata/GLB.Ts.txt [gives monthly and yearly results]
[explains at bottom how to go from “anomaly”to temperature at this site.]
3)RISS
ftp://ftp.ssmi.com/msu/monthly_time_series/rss_monthly_msu_amsu_channel_tlt_anomalies_land_and_ocean_v03_3.txt [gives monthly only(first column is ? global)—must average to get yearly]
ftp://ftp.remss.com/msu/monthly_time_series/ [page with links to various RISS monthly series]
4)UAH
http://vortex.nsstc.uah.edu/data/msu/t2lt/uahncdc.lt [gives monthly only(first column is global)—must average to get yearly]
http://www.drroyspencer.com/latest-global-temperatures/ [graph of above]
The Annual Global Average Land Temperature Anomaly – 1850 to Present, HADCRUT3, Land & Ocean, is at http://www.metoffice.gov.uk/hadobs/hadcrut3/diagnostics/global/nh+sh/annual_bar.png
Thanks for the kind words, but most of us ( Steve included) know where this is going ovleral the next 20-30 years. N America has been the warm heart of a cooling planet. For the record, I expect a weak to perhaps moderate el nino to evolve this summer into winter, and while that will push global temps up a bit, double la ninas followed by el ninos with a cold PDO means the break we had this year in N America is not likely to repeat next year. Europe is likely to have another severe stretch, which would make it 4 winters in a row year to deal with a cold extreme. While I officially have forecasted global temps , as measured by objective satellites, to return to the temps of the late 70s by 2030, I must confess that some of the more extreme forecasts due to solar cycle theory certainly have reason to have a seat at the table. The real shame is that we are now handcuffed by out of control warmingistas that have choked the lifeblood of our nations economy and find ourselves in a real bind as far as energy because of a ghost that never existed, and a reality that has a good chance of proving the opposite. Its amazing how many problems would be solved if we were just drilling without the paranoia about global warming. A more prosperous economy, less unemployment, more national security, and right on down the line. Years from now, people will marvel at how all this actually went on, perhaps with the same morbid fascination we look at what happened at Europe in the 30s. Tell a big enough lie loud enough , and people believe it
Well said – we are in total agreement. The big lie of CAGW is a global wealth redistribution scam.
Rushikesh Hi there,it’s now 2016-would you like to revise your statement here ? (from 2012)?
Jerry, Hi there, It’s now mid 2018, and Rushikesh can still stand by his assessment.
I have learn some excellent stuff here. Certainly value bookmarking for revisiting. I surprise how so much attempt you put to create the sort of fantastic informative website.
[Reply: Is this a legit comment? I don’t know, so I am letting it through. ~dbs, mod.]
The disconnect between Temperatures and CO2 is now stunningly obvious!
See http://www.colderside.com/Colderside/Temp_%26_CO2.html
Please take a look at years 2014, 2015, and 2016, now that the data is out.
Bruce, the disconnect still remains for previous datasets throughout earth’s history on CO2. However, Cosmic Ray Flux vs Temperature is still spot on.
Thank you rdr200 for the links. Everyone is so concerned with the anomalies that they forget to include the absolute temperatures, and you can’t create a mathematical climate model without knowing the absolute temperature!
WHERE CAN ONE GET ABSOLUTE TEMPERATURE? I once saw a chart of absolute temperature from the 1800s to present, but I cannot find it now. Can any one provide the link?
How about a chart for contiguous US temperatures, since that’s often in dispute? E.g., Bill McKibben recently claimed that 2012 would be the hottest temperature ever for the lower 48.
Often in dispute? Tony Heller has eviscerated NOAA’s work for the contiguous USA. Strangely, ‘experts’ such as NS contend that he is wrong, but no one has gone to his blog and demonstrated that he is wrong. I particularly like TH’s using newspapers from the 20s, 30s and 40s to validate the raw NOAA data, then he demonstrates how those temperatures have been ‘adjusted’ down to give us the ‘warmest ever’ story.
Thus I do not accept many of the graphs shown here to be valid. Certainly, any graph showing global temperatures before satellites is a fraud. There simply is no data behind those cartoons. No one had the oceans monitored by thermometers, ditto much of Africa, South America, the Arctic, and the Antarctic. When they have no data for 85% of the world, how dare scientists call it ‘global’ anomalies!
A more recent graph for the NOAA-NCDC database is at http://www.ncdc.noaa.gov/sotc/service/global/global-land-ocean-mntp-anom/201101-201112.png
It is linked from http://lwf.ncdc.noaa.gov/cmb-faq/anomalies.php
Roger Knights says: November 20, 2012 at 9:42 am
How about a chart for contiguous US temperatures, since that’s often in dispute? E.g., Bill McKibben recently claimed that 2012 would be the hottest temperature ever for the lower 48.
Should be covered on the WUWT US Climatic History Page:
http://wattsupwiththat.com/reference-pages/us-weather-climate-pages/us-climatic-history/
If there are any charts you’d like added to that page, please let us know.
Andres Valencia says: November 24, 2012 at 7:27 am
A more recent graph for the NOAA-NCDC database is at http://www.ncdc.noaa.gov/sotc/service/global/global-land-ocean-mntp-anom/201101-201112.png
It is linked from http://lwf.ncdc.noaa.gov/cmb-faq/anomalies.php
Updated, thank you.
Lots of charts not showing any longer. Some outdated. Same for the sea ice page.
A more recent graph for UAH Lower Atmosphere Temperature Anomalies – 1979 to Present is at http://www.drroyspencer.com/wp-content/uploads/UAH_LT_1979_thru_Jan_2013_v5.5.png
Andres Valencia says: February 18, 2013 at 8:39 am
A more recent graph for UAH Lower Atmosphere Temperature Anomalies – 1979 to Present is at http://www.drroyspencer.com/wp-content/uploads/UAH_LT_1979_thru_Jan_2013_v5.5.png
Updated, thanks.
Assumptions? Conclusions?
Very contrary to the plots on this page, there has been no net global warming for now relative to the 1940s, and that can be seen by looking closely at the *unadjusted* instrumental temperature data for the world, for the northern hemisphere, and for the southern hemisphere in the plots in http://wattsupwiththat.com/2013/05/17/an-analysis-of-night-time-cooling-based-on-ncdc-station-record-data/
That is in direct contradiction to plots from Hansen’s GISS, from the CRU of climategate (HadCRUT), and from the U.K. Met Office which has a level of bias and trustworthiness illustrated, for example, by what is discussed in http://wattsupwiththat.com/2013/06/14/12-reasons-why-the-met-office-is-alarmed/ . But those are all heavily *adjusted* data in contrast.
(Observe the total of three temperature plots here which extend as far back as 1940/before are two from the Met Office and one from the NOAA/NCDC; the rest are more recent decades alone).
The “Annual Global Mean Temperature Anomaly Over Land & Sea – 1880 to Present” graphic is no longer available from the NCDC. An equivalent graphic is at NCDC – Annual Global Land and Ocean Temperature Anomalies (1880-2013).
See http://www.ncdc.noaa.gov/cag/time-series/global/globe/land_ocean/13/1880-2013
With numerical data, but without the average line or error bars.
A copy of the original is available at http://www.ncdc.noaa.gov/sotc/service/global/global-land-ocean-mntp-anom/201101-201112.png
My 10 year old daughter just read an article in National Geographic Kids about global warming. ‘The world is getting warmer, daddy! See?’ She wouldn’t believe me when I said it wasn’t. I told her that data is more important than written words, and showed her this page as an explanation. We discussed how temperatures had increased but were now flat, and so when the article made the usual claims about the hottest temperatures being all in the last 10 years, we agreed it could be true but it still didn’t mean the world was still getting warmer.
She had no idea she could go online to see the actual numbers for herself, they don’t mention that sort of thing at school.
I don’t know if you ever find time to read these comments Anthony, but thank you and all at WUWT for being there and doing the work you do. It changes people.
Jonathan Abbott; When you and your daughter looked at these charts,did you notice that all of them show a warming?? Maybe you should listen to her…she could teach you something.(2016)
Yeah, show her 2014, 2015, & 2016 Global surface temps.
Jerry, maybe you could learn something by going to Tony Heller’s blog and looking at the thermometer coverage of the earth prior to satellites. There were essentially none for most of the earth. That makes your “teaching” moment a moment of propaganda bs. Maybe its better is to listen to Briffa’s trees: https://wattsupwiththat.com/2009/11/26/mcintyre-data-from-the-hide-the-decline/
The whole story of hiding the cooling(decline) is right there.. official “scientific” propaganda. It still goes on.
Jonathan Abbott says: July 23, 2013 at 12:59 pm
Thank you for your comment, it makes me think that it might be beneficial to craft some of our reference pages and articles to be more accessible to younger and less knowledgeable audiences. Any suggestions on how we might do so?
Show her this one
I like this one Mark, thank you….
Can you give me the link? And who took the data? Is it the same one that is taking data of the oceans’ temperature in current days? I get that some scientists can approximate the temperature, but at this point? And why would a scientist be more credible than another one?
Thank you in advance.
Are there any references for UAH and RSS temperatures by daytime hours and by night time to see the difference?
WUWT for Kids. I love that idea! I know we have some creative minds here, and most probably with children. How fun would that be for the family to browse kid friendly reference pages just for them.
I suggest WUWT for kids needs to keep the data intact but have step by step explanations on how to read it …and what are the possible interpretations …..leaving the choice of interpretation to the reader …..this would be useful for non-experts such as myself too ….
Oh drool
Note the plots on this page (from Climategate type sources) would imply the global cooling scare of the 1960s-1970s happened for negligible reason.
Climate scientists of the time (a majority being honest academics before the later influx of enviropolitical alignments, money, and new activist individuals) are implicitly implied to be utter fools who couldn’t notice that temperatures (global, Northern Hemisphere, etc) were near-constantly rising overall with little downturn.
Except that is not how reality works. Events don’t happen ex nihilo. One of the best applications of intelligence is to cross-connect info, to see how data of many types can form a consistent and plausible whole, rather than having unexamined glaring implausibilities left.
And doing so leads to the beautiful actual history of temperatures and the climate seen in publications of the time (like plots in a 1976 National Geographic issue I’ve even seen in paper form in a library, not the highly publicized rewritten versions of later activists), which can be combined with later data from non-activist real scientist sources to explain all from the LIA to the current “pause” in global warming:
http://img250.imagevenue.com/img.php?image=45311_expanded_overview2_122_15lo.jpg
As a follower of this site and especially climate discussion in general from the 80’s, I’ll share my personal take on this issue:
10 years is imho a rough minimum span to consider when quantifying the planets temperatures or climate state. With that in mind it looks like we have hit a (slowly rising) plateau of sorts which migh last for decades more assuming there is a ~30y oscillating trend of any magnitude. From al the above graphs it can be deducted that the climate has warmed somewhat, for whatever reason. The assumption that the lower side of the 30 year oscillation actually just makes the temps stay on somewhat the same level and the positive side of the trend is fairly fast warming fits the graphs well, we will see in a few decades whather that is to continue or not.
The activity sugre of the sun in the last century is a good candidate for a very long trend, (spanning over the 30y trend) especially considering the vast mass of the planet – delays expected. CO2 is not a very likely prime forcer of the temperature but very likely does contribute to some level. In any case a warmer climate (or about status quo) is a necessity as any dip into a little ice age would cause very severe issues which I would like to see mentioned in the MSM even once.
Also noteworthy to mention is that the CO2 demonizing in MSM is a dierct result of 3 main motives:
1. Tax income needs to grow for a plethora of reasons. Big government and welfare state etc.
2. Lower the dependence to outside energy suppliers (trade deficit, unpredictability of the middle east).
3. The need to spur the research and with that the competitiveness of a nation / western civ.. linked to reason no 2 but also a standalone interest.
More scare, more money.
It is a nice plan also because people will pay taxes more and more willingly if they are both scared and secondly think it results in greated good. Very well thought out and largely a lie, Some of the money goes to actual good use of course so there is a thin silver lining.
MM says….3 main motives for CO2 demonisation. I would add No 4 ….UN Agenda 21 which should really be No 1. It all comes from there.
Yeah, right. 97% of climate scientists are willing to fake the data for some reason.
What is the agenda for the multiple 1% types with billions in foundation money who are behind the creation of agenda 21?
What are their motivations? Is it world wide governance through an un-elected UN? World wide free trade control for maximum profit? De militarization for less warfare? Reduced nationalism to allow mass migration of peoples? Uniform law of the sea? Preservation of wild spaces worldwide? There are a number of fine goals to rally behind.
I think the election of Trump has thrown a spanner in the grand plan. Between the 1% types owing the media and their buying of politicians, I doubt that Trump can succeed. The USA Constitution he supports is in reality an obstacle, a relic, a throwback to the idea of sovereign states.. and it would have been circumvented successfully if Hillary had won.
Simplified climate data reference pages would be most welcome in newsrooms as well. Just like schoolkids, most journalists don’t know that it is possible and even to access temperature and other climate data. “WUWT for kids ‘n hacks”, yes please!
…even easy…
Henry Clark says:
December 21, 2013 at 4:30 pm…
Henry, that is an excellent link. Thanks for posting it.
That link doesn’t work. Is there a newer one?
I’m confused, since about 2003 the global ocean temperatures have been pretty flat, maybe even a little negative. How is it then that the global ocean heat content graph is climbing so steep ? It seems counter intuitive.
Why are we given global temperature graphs using anamolies instead of average temperatures as compiled from measuring station reported readings? Doesn’t the use of varying bases upon which to compute anamolies skew the results and prevent accurate comparison with earlier periods?
Website work needed: UAH Lower Atmosphere Temperature Anomalies show only through June, but the link has data through August.
Updated through September, thank you.
Some of the links on this page are not working.
[Thank you for noting the issue: which ones did you have a problem with? .mod]
Perhaps a graph that shows the past GISS LOTI compared with the current GISS LOTI would be helpful?
Nothing fancy. No animation. Just what they said before compared with what they say now for the same data?
Something to make it easy to see that the “settled” science can’t even settle on what happened in the past.
That could help newcomers.
Might want to consider adding Berkely Earth take on the data. http://berkeleyearth.org/data/
Pause? What pause? I don’t see no stinking hiatus:
http://www.ncdc.noaa.gov/temp-and-precip/msu/
Why aren’t the graphs and data up to date. For example, the first temperature graph shows data only through January 2015?
I’ve been busy, graphs updated.
Thanks!
Trump is correct alarmists being fueled by money and political influence from people like gore and dupont their freon patent expired thus the refrigerant scare
The CO2 myth.
If you placed a coin on the footpath, to represent a CO2 molecule in the atmosphere. you would then need to place 2500 more non CO2 coins the same size, before you would need another CO2 molecule coin.
and then another 2500 non CO2 coins, etc. and that is supposed to significantly affect global temperatures?
The 2011 NCDC graphic at http://www.ncdc.noaa.gov/sotc/service/global/global-land-ocean-mntp-anom/201101-201112.png is outdated.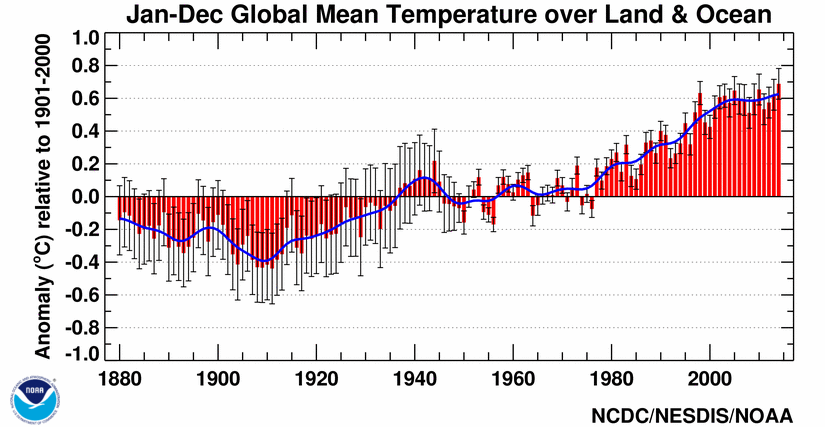
The latest (2014) is at
Thanks for all the good work!
Updated, thank you!
I think water vapor makes the story even more interesting.
http://i68.tinypic.com/35d5jsg.png
RSS Northern Polar Temperature Lower Troposphere (TLT) – 1979 to Present should be “Southern Polar” as in the graph, right?
just wow. good old ‘wish You where here.’
and we’re here in the 21st ctry.
Do the NY folk still the easter parade, ever saw that in black/White. sentimental stuff holds the feet on the ground.
Thanks to A . Watts, staff and Best 2016.
How about a question? In the 1900’s, how many mercury thermometers were there actually available to track “global” temps? I can’t imagine how many far more accurate digital thermometers and satelite temp readings are available today than 100 years ago. Would most not agree that reading a glass, mercury filled thermometer from early 1900s as compared to a modern, NSIT traceable digital thermomoter, leave at least a reasonable amount of inaccuracy and variability? I don’t think that a .15 to .2 temperature discrepency or even expected margin of error would be overstated. Aside from the instrument question, weren’t temperatrue readings from even 50 years ago mainly ” at the airport” readings not center city Chicago or L.A.?
Many weather stations have been relocated as well. A relatively minor move can be enough to substantially change the readings. From coastal to a couple of miles inland for instance or a change of altitude of a couple of hundred feet. Has anyone looked into any adjustment of weather station readings to acknowledge these alterations?
Anybody else here notice that all the graphs show warming-just curious????
Yes Jerry, we all know that it has been warming for ~250 years since the depths CO2Science.Org – Click the pic to view at source[/caption]
 JoNova.com – Click the pic to view at source[/caption]
endof the Little Ice Age:1,100 Years – Ljungqvist et al
[caption id="" align="alignnone" width="542"]
1,100 Years Ljungqvist et al
[caption id="" align="alignnone" width="542"]
However, anthropogenic CO2 emissions have only been potentially consequential since ~1950;
https://wattsupwiththat.com/2014/03/29/when-did-anthropogenic-global-warming-begin/
and Phil Jones noted during a 2010 BBC interview, “As for the two periods 1910-40 and 1975-1998 the warming rates are not statistically significantly different.” As such, the warming from 1910 – 1940, before Anthropogenic CO2 became potentially consequential, is “not statistically significantly different” from the warming during the period from 1975 – 1998. If CO2 is a potent greenhouse gas at current atmospheric concentrations, we should see significant acceleration in the warming that was already occurring naturally due to the rebound from the Little Ice Age.
Warming is evidence of Earth’s temperature changing naturally, the lack of acceleration of this warming is evidence that CO2 is not a potent greenhouse gas at current atmospheric concentrations.
If you have any other questions, please do let us know…
“The main drivers of the Little Ice Age cooling were decreased solar activity and increased volcanic activity. These factors cannot account for the global warming observed over the past 50-100 years. Furthermore, it is physically incorrect to state that the planet is simply “recovering” from the Little Ice Age.”
Couldn’t have said it better myself.
https://skepticalscience.com/coming-out-of-little-ice-age-advanced.htm
You’ve produced a nice cherry picking of temperature proxies and timescaling.
http://www.realclimate.org/images/m08.jpg
CO2 forcings have been directly measured: http://newscenter.lbl.gov/2015/02/25/co2-greenhouse-effect-increase/
Kyle December 13, 2016 at 12:08
“The main drivers of the Little Ice Age cooling were decreased solar activity and increased volcanic activity”
We do not know what caused the Little Ice Age. Solar activity,volcanic activity are both possible factors, but the data is very limited for this time period.
“These factors cannot account for the global warming observed over the past 50-100 years.”
Of course “decreased solar activity and increased volcanic activity” “cannot account for the global warming observed over the past 50-100 years.” However, increased solar activity and decreased volcanic activity certainly could be possible factors in the “global warming observed over the past 50-100 years”.
“Furthermore, it is physically incorrect to state that the planet is simply “recovering” from the Little Ice Age.”
I did not say recovering, I said rebounding.
“Couldn’t have said it better myself.”
A sad statement fact given Skepticalscience.com’s inaccuracy.
“You’ve produced a nice cherry picking of temperature proxies and timescaling.”
I provided the most reliable proxies for the time period, whereas you’ve produced an erroneous chart that splices disparate and incomparable data sets.
As I noted above, during the periods “1910-40 and 1975-1998 the warming rates are not statistically significantly different.” even though Anthorpogenc CO2 emissions were not potentially consequential until after ~1950. What do you think caused the warming between 1910-40?
But from 1910 to 1940 the Sun was warming, and the CO2 was not much changed.
from 1975 to 1998 the Sun was not much changed, and the CO2 was increasing.
Wandering magnetic poles control the weather. Do you believe that? Pull up this link on a desktop monitor, study the graphics, and initiate a discussion.
https://www.harrytodd.org
The UHA temperature graphs have not updated here since September. They show a decisive downturn in temperature now 12/30.
With the increase in competition and product supply within these
industries, as well as tax incentives and possible government subsidies of those clean energy resources, cleaner smarter energy have been around in reach of numerous quickly another several years.
We are currently investigating some areas for average investors and funding your company
too take advantage of some BIG lucrative opportunities later on because they areas grow and develop on the coming years.
– Next you need to get in touch the blades to a shaft which,
subsequently, connects to the motor.
I have just found some time to read through all the threads. I love both the way so mch factual data is presented as well as the clear scientific rebuffals to the odd alarmist popping up. Keep up the good work
The UAH global temperature chart on this page was being updated monthly through February 2019. Since then it has not been updated – as temperatures have moved upward. “Watts up with that”?
[Nothing sinister. From that page: “all of the data is linked from third party sources and WUWT is simply an aggregator.” We will look into why its not linking. Mod]
Mods: no luck with the updates yet? It’s over a year since the above comment was made and the UAH chart still stops in Feb 2018. The RSS TLT chart appears to stop in early 2017 and is still showing the discontinued v3 data. RSS TLT v4 has been in use since July 2017 – almost 3 years now. Have these updates been abandoned by WUWT? Thanks.
The RSS TLT chart (3rd chart from the top) shows the old version 3 data, trend 0.134 K/dec. Updates stopped being added to version 3 some time ago (although the horizontal axis on the chart above suggests otherwise, for some reason). RSS TLT version 4, trend 0.204 K/dec, is the producer’s latest and fully updated operational data set:
http://images.remss.com/data/msu/graphics/TLT_v40/plots/RSS_TS_channel_TLT_Global_Land_And_Sea_v04_0.png
Updated to June 2021
The very globality of the “global” temperature hasn’t been addressed enough, and that should come before everything else, before the trends, before the models and before predictions. How do we know the global sampling was adequate for the entire industrial period when even as of 2013 it wasn’t adequate for one of the main datasets, the HadCRUT4: https://rmets.onlinelibrary.wiley.com/doi/full/10.1002/qj.2297? HadCRUT4 covers 84% of the globe, with the worst coverage in Africa and on the poles. I seriously doubt the globality of pre-war measurements, and even after the war they are suspicious. How do they account for the missing data?
We are taking the mean temperature values for granted in these graphs, on both sides of the debate, but we really shouldn’t.
Also, if we do, HadCRUT4 shows a big pause in the temperature rise between 1940 and 1980. Are we supposed to believe that everybody went green in the most intensive period of the post-war rebuild?
I am wondering where geographically the apparent warming in the past 20 years is occurring. I have seen some maps that show almost all of the delta above 20th century average temps, isolated to regions within and near the former USSR. Do you have some reliable maps showing, say, each decade’s temperature delta spatial distribution across the planet? Would be interesting to see if the same temperature reporting stations keep reporting anomalies each decade, or if the deviations are more well-distributed worldwide.
On the UAH satellite map if a straight line is drawn from the temperature for 1979 and extended through the temperature for 2004 and another line is drawn horizontally from the temperature for 2004 forward in time the presence of changeover from continuous warming to pause in warming is obvious. Since 2004 most of the temperature readings for the succeeding years fall below the horizontal line. This is more obvious when the temperatures for the major El Ninos of 1998 and 2016 are deleted.
The linear warming trend in UAH from Jan 2005 to May 2020 is +0.25 C/dec. That’s considerably faster than the warming trend in UAH from Dec 1978 to Dec 2004 (+0.15 C/dec).
https://woodfortrees.org/graph/uah6/to:2005/plot/uah6/to:2005/trend/plot/uah6/from:2005/plot/uah6/from:2005/trend
If we edit out the warming signal caused by El Nino but retain the cooling signal caused by La Nina then should we be surprised that overall the warming trend reduces?
That’s a bit weird looking at it that way. The data looks like there was a plateau at about -0.2C (anomaly) from 1980 to 1998’s El Nino which left temperatures at 0.0C from 2000 to 2015, another El Nino and then a new level at 0.2C.
A plot of a non-anomaly GAST would be nice — showing the nearly straight and level plain of 14.7 C air temperatures since 1880 or so.